Races in Chelmsford, Massachusetts (MA) Detailed Stats
Ancestries, Foreign-born residents, place of birth

Recent posts about races in Chelmsford, Massachusetts on our local forum with over 2,400,000 registered users:
 | Break-ins targeting South Asian families (58 replies) |
| Can you please recommend towns closer to Chelmsford to buy a property for my friend? (30 replies) |
| Billerica Houses (47 replies) |
| Towns like Chelmsford but more affordable (44 replies) |
| Chelmsford or Westford? (42 replies) |
| Relocating to MA- Burlington or North Chelmsford or Lowell or Woburn (30 replies) |
Latest news about races in Chelmsford, MA collected exclusively by city-data.com from local newspapers, TV, and radio stations
7.1% of Chelmsford, MA residents are foreign-born (3.5% born in Asia, 2.3% born in Europe), which is 152.0% less than the foreign-born rate of 18.0% across the entire state of Massachusetts.
Race distribution in Chelmsford

- 31,29192.4%White alone
- 1,5614.6%Asian alone
- 4181.2%Hispanic
- 2570.8%Black alone
- 2750.8%Two or more races
- 330.10%Other race alone
- 220.06%American Indian alone

2000
2022
-
- 5,198,35981.9%White alone
- 428,7296.8%Hispanic
- 318,3295.0%Black alone
- 236,7863.7%Asian alone
- 110,3381.7%Two or more races
- 43,5860.7%Other race alone
- 11,2640.2%American Indian alone
- 1,7060.03%Native Hawaiian and Other
Pacific Islander alone

-
- 4,676,62767.0%White alone
- 911,03813.0%Hispanic
- 501,4637.2%Asian alone
- 459,7406.6%Black alone
- 341,8894.9%Two or more races
- 84,4031.2%Other race alone
- 5,8380.08%American Indian alone
- 9760.01%Native Hawaiian and Other
Pacific Islander alone

Income and house value in Chelmsford
- Median household income in 2022
- $136,968White non-Hispanic householders
- $109,500Black householders
- $185,239Asian householders
- $13,266Some other race householders
- $103,147Two or more races householders
- $74,897Hispanic or Latino race householders
- Median 2022 house value
- $604,873White Non-Hispanic householders
- $609,396Black or African American householders
- $613,918Asian householders
- $570,673Two or more races householders
- $532,515Hispanic or Latino householders
Household income for White non-Hispanic householders

Household income for Black householders

Household income for Asian householders

Household income for Two or more races householders

Household income for Hispanic or Latino race householders

Foreign-born residents in Chelmsford
2,418 residents are foreign born (3.5% Asia, 2.3% Europe).
| This city: | 7.1% |
| Massachusetts: | 12.2% |
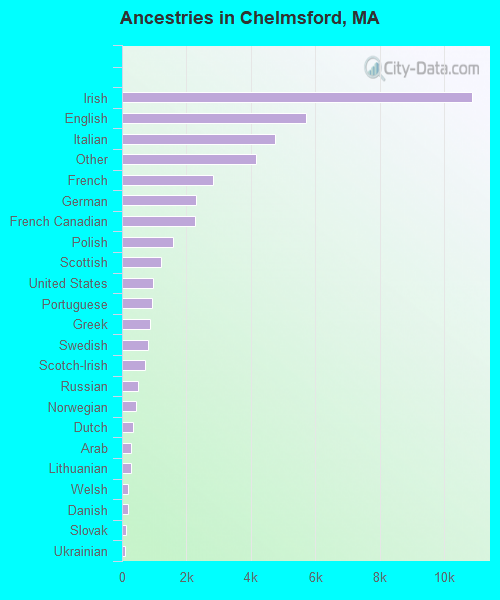
Ancestries in Chelmsford

- 10,85225.4%Irish
- 5,72613.4%English
- 4,75211.1%Italian
- 4,1739.8%Other
- 2,8136.6%French
- 2,3095.4%German
- 2,2685.3%French Canadian
- 1,5693.7%Polish
- 1,2112.8%Scottish
- 9742.3%United States
- 9422.2%Portuguese
- 8722.0%Greek
- 8211.9%Swedish
- 7211.7%Scotch-Irish
- 4861.1%Russian
- 4491.1%Norwegian
- 3360.8%Dutch
- 2930.7%Arab
- 2720.6%Lithuanian
- 1760.4%Welsh
- 1740.4%Danish
- 1210.3%Slovak
- 1050.2%Ukrainian
- 830.2%Hungarian
- 700.2%Czech
- 580.1%Subsaharan African
- 310.07%Swiss
- 270.06%West Indian
Zip codes: 01824.