Races in Cherryland, California (CA) Detailed Stats
Data:
Races - White alone (%)
Races - White alone (% change since 2000)
Races - Black alone (%)
Races - Black alone (% change since 2000)
Races - American Indian alone (%)
Races - American Indian alone (% change since 2000)
Races - Asian alone (%)
Races - Asian alone (% change since 2000)
Races - Hispanic (%)
Races - Hispanic (% change since 2000)
Races - Native Hawaiian and Other Pacific Islander alone (%)
Races - Native Hawaiian and Other Pacific Islander alone (% change since 2000)
Races - Two or more races(%)
Races - Two or more races(% change since 2000)
Races - Other race alone (%)
Races - Other race alone (% change since 2000)
Racial diversity
Place of birth - Born in state of residence (%)
Place of birth - Born in state of residence (%) - White
Place of birth - Born in state of residence (%) - Black or African American
Place of birth - Born in state of residence (%) - Asian
Place of birth - Born in state of residence (%) - Hispanic or Latino
Place of birth - Born in state of residence (%) - American Indian and Alaska Native
Place of birth - Born in state of residence (%) - Multirace
Place of birth - Born in state of residence (%) - Other Race
Place of birth - Born in other state (%)
Place of birth - Born in other state (%) - White
Place of birth - Born in other state (%) - Black or African American
Place of birth - Born in other state (%) - Asian
Place of birth - Born in other state (%) - Hispanic or Latino
Place of birth - Born in other state (%) - American Indian and Alaska Native
Place of birth - Born in other state (%) - Multirace
Place of birth - Born in other state (%) - Other Race
Place of birth - Native, outside of US (%)
Place of birth - Native, outside of US (%) - White
Place of birth - Native, outside of US (%) - Black or African American
Place of birth - Native, outside of US (%) - Asian
Place of birth - Native, outside of US (%) - Hispanic or Latino
Place of birth - Native, outside of US (%) - American Indian and Alaska Native
Place of birth - Native, outside of US (%) - Multirace
Place of birth - Native, outside of US (%) - Other Race
Place of birth - Foreign born (%)
Place of birth - Foreign born (%) - White
Place of birth - Foreign born (%) - Black or African American
Place of birth - Foreign born (%) - Asian
Place of birth - Foreign born (%) - Hispanic or Latino
Place of birth - Foreign born (%) - American Indian and Alaska Native
Place of birth - Foreign born (%) - Multirace
Place of birth - Foreign born (%) - Other Race
Residents speaking English at home (%)
Residents speaking English at home - Born in the United States (%)
Residents speaking English at home - Native, born elsewhere (%)
Residents speaking English at home - Foreign born (%)
Residents speaking Spanish at home (%)
Residents speaking Spanish at home - Born in the United States (%)
Residents speaking Spanish at home - Native, born elsewhere (%)
Residents speaking Spanish at home - Foreign born (%)
Residents speaking other language at home (%)
Residents speaking other language at home - Born in the United States (%)
Residents speaking other language at home - Native, born elsewhere (%)
Residents speaking other language at home - Foreign born (%)
Marital status - Never married (%)
Marital status - Now married (%)
Marital status - Separated (%)
Marital status - Widowed (%)
Marital status - Divorced (%)
Ancestries Reported - Arab (%)
Ancestries Reported - Czech (%)
Ancestries Reported - Danish (%)
Ancestries Reported - Dutch (%)
Ancestries Reported - English (%)
Ancestries Reported - French (%)
Ancestries Reported - French Canadian (%)
Ancestries Reported - German (%)
Ancestries Reported - Greek (%)
Ancestries Reported - Hungarian (%)
Ancestries Reported - Irish (%)
Ancestries Reported - Italian (%)
Ancestries Reported - Lithuanian (%)
Ancestries Reported - Norwegian (%)
Ancestries Reported - Polish (%)
Ancestries Reported - Portuguese (%)
Ancestries Reported - Russian (%)
Ancestries Reported - Scotch-Irish (%)
Ancestries Reported - Scottish (%)
Ancestries Reported - Slovak (%)
Ancestries Reported - Subsaharan African (%)
Ancestries Reported - Swedish (%)
Ancestries Reported - Swiss (%)
Ancestries Reported - Ukrainian (%)
Ancestries Reported - United States (%)
Ancestries Reported - Welsh (%)
Ancestries Reported - West Indian (%)
Ancestries Reported - Other (%)
Geographical mobility - Same house 1 year ago (%)
Geographical mobility - Same house 1 year ago (%) - White
Geographical mobility - Same house 1 year ago (%) - Black or African American
Geographical mobility - Same house 1 year ago (%) - Asian
Geographical mobility - Same house 1 year ago (%) - Hispanic or Latino
Geographical mobility - Same house 1 year ago (%) - American Indian and Alaska Native
Geographical mobility - Same house 1 year ago (%) - Multirace
Geographical mobility - Same house 1 year ago (%) - Other Race
Geographical mobility - Moved within same county (%)
Geographical mobility - Moved within same county (%) - White
Geographical mobility - Moved within same county (%) - Black or African American
Geographical mobility - Moved within same county (%) - Asian
Geographical mobility - Moved within same county (%) - Hispanic or Latino
Geographical mobility - Moved within same county (%) - American Indian and Alaska Native
Geographical mobility - Moved within same county (%) - Multirace
Geographical mobility - Moved within same county (%) - Other Race
Geographical mobility - Moved from different county within same state (%)
Geographical mobility - Moved from different county within same state (%) - White
Geographical mobility - Moved from different county within same state (%) - Black or African American
Geographical mobility - Moved from different county within same state (%) - Asian
Geographical mobility - Moved from different county within same state (%) - Hispanic or Latino
Geographical mobility - Moved from different county within same state (%) - American Indian and Alaska Native
Geographical mobility - Moved from different county within same state (%) - Multirace
Geographical mobility - Moved from different county within same state (%) - Other Race
Geographical mobility - Moved from different state (%)
Geographical mobility - Moved from different state (%) - White
Geographical mobility - Moved from different state (%) - Black or African American
Geographical mobility - Moved from different state (%) - Asian
Geographical mobility - Moved from different state (%) - Hispanic or Latino
Geographical mobility - Moved from different state (%) - American Indian and Alaska Native
Geographical mobility - Moved from different state (%) - Multirace
Geographical mobility - Moved from different state (%) - Other Race
Geographical mobility - Moved from abroad (%)
Geographical mobility - Moved from abroad (%) - White
Geographical mobility - Moved from abroad (%) - Black or African American
Geographical mobility - Moved from abroad (%) - Asian
Geographical mobility - Moved from abroad (%) - Hispanic or Latino
Geographical mobility - Moved from abroad (%) - American Indian and Alaska Native
Geographical mobility - Moved from abroad (%) - Multirace
Geographical mobility - Moved from abroad (%) - Other Race
Place of birth for the foreign-born population - Ireland (%)
Place of birth for the foreign-born population - Denmark (%)
Place of birth for the foreign-born population - Norway (%)
Place of birth for the foreign-born population - Sweden (%)
Place of birth for the foreign-born population - United Kingdom (%)
Place of birth for the foreign-born population - England (%)
Place of birth for the foreign-born population - Scotland (%)
Place of birth for the foreign-born population - Other Northern Europe (%)
Place of birth for the foreign-born population - Austria (%)
Place of birth for the foreign-born population - Belgium (%)
Place of birth for the foreign-born population - France (%)
Place of birth for the foreign-born population - Germany (%)
Place of birth for the foreign-born population - Netherlands (%)
Place of birth for the foreign-born population - Switzerland (%)
Place of birth for the foreign-born population - Other Western Europe (%)
Place of birth for the foreign-born population - Greece (%)
Place of birth for the foreign-born population - Italy (%)
Place of birth for the foreign-born population - Portugal (%)
Place of birth for the foreign-born population - Spain (%)
Place of birth for the foreign-born population - Other Southern Europe (%)
Place of birth for the foreign-born population - Albania (%)
Place of birth for the foreign-born population - Belarus (%)
Place of birth for the foreign-born population - Bosnia and Herzegovina (%)
Place of birth for the foreign-born population - Bulgaria (%)
Place of birth for the foreign-born population - Croatia (%)
Place of birth for the foreign-born population - Czechoslovakia (%)
Place of birth for the foreign-born population - Hungary (%)
Place of birth for the foreign-born population - Latvia (%)
Place of birth for the foreign-born population - Lithuania (%)
Place of birth for the foreign-born population - North Macedonia (Macedonia) (%)
Place of birth for the foreign-born population - Moldova (%)
Place of birth for the foreign-born population - Poland (%)
Place of birth for the foreign-born population - Romania (%)
Place of birth for the foreign-born population - Russia (%)
Place of birth for the foreign-born population - Serbia (%)
Place of birth for the foreign-born population - Ukraine (%)
Place of birth for the foreign-born population - Other Eastern Europe (%)
Place of birth for the foreign-born population - China (%)
Place of birth for the foreign-born population - Hong Kong (%)
Place of birth for the foreign-born population - Taiwan (%)
Place of birth for the foreign-born population - Japan (%)
Place of birth for the foreign-born population - Korea (%)
Place of birth for the foreign-born population - Other Eastern Asia (%)
Place of birth for the foreign-born population - Afghanistan (%)
Place of birth for the foreign-born population - Bangladesh (%)
Place of birth for the foreign-born population - India (%)
Place of birth for the foreign-born population - Iran (%)
Place of birth for the foreign-born population - Kazakhstan (%)
Place of birth for the foreign-born population - Nepal (%)
Place of birth for the foreign-born population - Pakistan (%)
Place of birth for the foreign-born population - Sri Lanka (%)
Place of birth for the foreign-born population - Uzbekistan (%)
Place of birth for the foreign-born population - Other South Central Asia (%)
Place of birth for the foreign-born population - Burma (%)
Place of birth for the foreign-born population - Cambodia (%)
Place of birth for the foreign-born population - Indonesia (%)
Place of birth for the foreign-born population - Laos (%)
Place of birth for the foreign-born population - Malaysia (%)
Place of birth for the foreign-born population - Philippines (%)
Place of birth for the foreign-born population - Singapore (%)
Place of birth for the foreign-born population - Thailand (%)
Place of birth for the foreign-born population - Vietnam (%)
Place of birth for the foreign-born population - Other South Eastern Asia (%)
Place of birth for the foreign-born population - Armenia (%)
Place of birth for the foreign-born population - Iraq (%)
Place of birth for the foreign-born population - Israel (%)
Place of birth for the foreign-born population - Jordan (%)
Place of birth for the foreign-born population - Kuwait (%)
Place of birth for the foreign-born population - Lebanon (%)
Place of birth for the foreign-born population - Saudi Arabia (%)
Place of birth for the foreign-born population - Syria (%)
Place of birth for the foreign-born population - Turkey (%)
Place of birth for the foreign-born population - Yemen (%)
Place of birth for the foreign-born population - Other Western Asia (%)
Place of birth for the foreign-born population - Eritrea (%)
Place of birth for the foreign-born population - Ethiopia (%)
Place of birth for the foreign-born population - Kenya (%)
Place of birth for the foreign-born population - Somalia (%)
Place of birth for the foreign-born population - Uganda (%)
Place of birth for the foreign-born population - Zimbabwe (%)
Place of birth for the foreign-born population - Other Eastern Africa (%)
Place of birth for the foreign-born population - Cameroon (%)
Place of birth for the foreign-born population - Congo (%)
Place of birth for the foreign-born population - Democratic Republic of Congo (Zaire) (%)
Place of birth for the foreign-born population - Other Middle Africa (%)
Place of birth for the foreign-born population - Egypt (%)
Place of birth for the foreign-born population - Morocco (%)
Place of birth for the foreign-born population - Sudan (%)
Place of birth for the foreign-born population - Other Northern Africa (%)
Place of birth for the foreign-born population - South Africa (%)
Place of birth for the foreign-born population - Other Southern Africa (%)
Place of birth for the foreign-born population - Cabo Verde (%)
Place of birth for the foreign-born population - Ghana (%)
Place of birth for the foreign-born population - Liberia (%)
Place of birth for the foreign-born population - Nigeria (%)
Place of birth for the foreign-born population - Senegal (%)
Place of birth for the foreign-born population - Sierra Leone (%)
Place of birth for the foreign-born population - Other Western Africa (%)
Place of birth for the foreign-born population - Australia (%)
Place of birth for the foreign-born population - New Zealand (%)
Place of birth for the foreign-born population - Fiji (%)
Place of birth for the foreign-born population - Micronesia (%)
Place of birth for the foreign-born population - Bahamas (%)
Place of birth for the foreign-born population - Barbados (%)
Place of birth for the foreign-born population - Cuba (%)
Place of birth for the foreign-born population - Dominica (%)
Place of birth for the foreign-born population - Dominican Republic (%)
Place of birth for the foreign-born population - Grenada (%)
Place of birth for the foreign-born population - Haiti (%)
Place of birth for the foreign-born population - Jamaica (%)
Place of birth for the foreign-born population - St. Vincent and the Grenadines (%)
Place of birth for the foreign-born population - Trinidad and Tobago (%)
Place of birth for the foreign-born population - West Indies (%)
Place of birth for the foreign-born population - Other Caribbean (%)
Place of birth for the foreign-born population - Belize (%)
Place of birth for the foreign-born population - Costa Rica (%)
Place of birth for the foreign-born population - El Salvador (%)
Place of birth for the foreign-born population - Guatemala (%)
Place of birth for the foreign-born population - Honduras (%)
Place of birth for the foreign-born population - Mexico (%)
Place of birth for the foreign-born population - Nicaragua (%)
Place of birth for the foreign-born population - Panama (%)
Place of birth for the foreign-born population - Other Central America (%)
Place of birth for the foreign-born population - Argentina (%)
Place of birth for the foreign-born population - Bolivia (%)
Place of birth for the foreign-born population - Brazil (%)
Place of birth for the foreign-born population - Chile (%)
Place of birth for the foreign-born population - Colombia (%)
Place of birth for the foreign-born population - Ecuador (%)
Place of birth for the foreign-born population - Guyana (%)
Place of birth for the foreign-born population - Peru (%)
Place of birth for the foreign-born population - Uruguay (%)
Place of birth for the foreign-born population - Venezuela (%)
Place of birth for the foreign-born population - Other South America (%)
Place of birth for the foreign-born population - Canada (%)
Place of birth for the foreign-born population - Other Northern America (%)
Place of birth for the foreign-born population - Other (%)
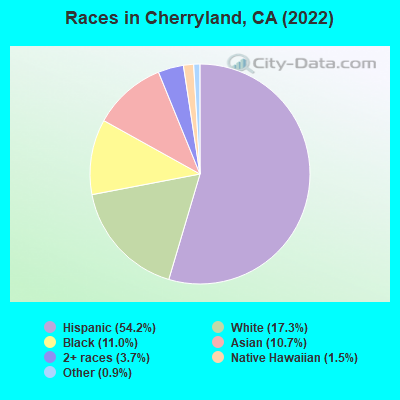
According to 2022 data, the most numerous races in Cherryland, CA are Hispanic (9,129 residents), White alone (2,617 residents), and Asian alone (1,823 residents). 40.4% of Cherryland residents speak English at home. 34.9% of Cherryland, CA residents are foreign-born (21.3% born in Latin America, 8.0% born in Asia), which is 25.5% greater than the foreign-born rate of 26.0% across the entire state of California.
Race distribution in Cherryland
2000 2022
15,816,790 46.7% White alone 10,966,556 32.4% Hispanic 3,648,860 10.8% Asian alone 2,181,926 6.4% Black alone 903,115 2.7% Two or more races 178,984 0.5% American Indian alone 103,736 0.3% Native Hawaiian and Other 71,681 0.2% Other race alone
15,732,184 40.3% Hispanic 13,160,426 33.7% White alone 5,957,867 15.3% Asian alone 2,025,218 5.2% Black alone 1,663,222 4.3% Two or more races 251,618 0.6% Other race alone 135,777 0.3% Native Hawaiian and Other 103,030 0.3% American Indian alone
Income and house value in Cherryland Median household income in 2022 $86,735 White non-Hispanic householders$54,066 Black householders$50,527 American Indian and Alaska Native householders$116,473 Asian householders$99,181 Native Hawaiian and other Pacific Islander householders$97,579 Some other race householders$76,566 Two or more races householders$105,005 Hispanic or Latino race householdersMedian 2022 house value $723,818 White Non-Hispanic householders$719,859 Black or African American householders$624,837 American Indian or Alaska Native householders $641,754 Asian householders$789,685 Some other race householders$989,806 Two or more races householders$732,096 Hispanic or Latino householders
Median age by race in Cherryland
41.2 Median age for White residents40.7 44.4 34.4 Median age for Black or African American residents33.3 34.6 45.7 Median age for American Indian / Alaska Native residents49.8 28.1 40.9 Median age for Asian residents46.4 40.2 36.6 Median age for Native Hawaiian / Pacific Islander residents42.8 35.2 31.7 Median age for Other race residents28.7 32.3 54.2 Median age for Two or more races residents55.8 53.5 55.0 Median age for White alone residents53.9 57.1 31.6 Median age for Hispanic or Latino residents30.7 32.7
Owner/renter occupied households by race in Cherryland
House owners and renters - White residents 654 33.1% Owner occupied1,325 66.9% Renter occupiedHouse owners and renters - Black or African American residents 25 3.7% Owner occupied659 96.3% Renter occupiedHouse owners and renters - American Indian / Alaska Native residents 11 30.3% Owner occupied25 69.7% Renter occupiedHouse owners and renters - Asian residents 228 37.9% Owner occupied373 62.1% Renter occupiedHouse owners and renters - Native Hawaiian / Pacific Islander residents 33 32.8% Owner occupied67 67.2% Renter occupiedHouse owners and renters - Other race residents 229 17.3% Owner occupied1,094 82.7% Renter occupiedHouse owners and renters - Two or more races residents 133 24.1% Owner occupied418 75.9% Renter occupiedHouse owners and renters - White alone residents 463 38.3% Owner occupied745 61.7% Renter occupiedHouse owners and renters - Hispanic or Latino residents 529 21.8% Owner occupied1,898 78.2% Renter occupied
Language usage in Cherryland
English speakers - Total 40.4% of residents of Cherryland speak English at home.
43.5% of residents speak Spanish at home 3,770 57.9% Speak English very well2,744 42.1% Speak English less than very well15.6% of residents speak other language at home 1,256 53.7% Speak English very well1,085 46.3% Speak English less than very well
English speakers - Born in the United States 88.2% of residents of Cherryland speak English at home.
8.1% of residents speak Spanish at home 67 64.4% Speak English very well37 35.6% Speak English less than very well3.4% of residents speak other language at home 34 79.1% Speak English very well9 20.9% Speak English less than very well
English speakers - Native, born elsewhere 53.0% of residents of Cherryland speak English at home.
10.4% of residents speak Spanish at home 12 63.2% Speak English very well7 36.8% Speak English less than very well33.9% of residents speak other language at home 54 87.1% Speak English very well8 12.9% Speak English less than very well
English speakers - Foreign-born 6.0% of residents of Cherryland speak English at home.
59.4% of residents speak Spanish at home 936 28.7% Speak English very well2,327 71.3% Speak English less than very well33.1% of residents speak other language at home 825 45.4% Speak English very well991 54.6% Speak English less than very well
White (Caucasian) - Speak only English Native:
70.2% (2,614)Foreign-born:
6.5% (93)
White (Caucasian) - Speak another language Native:
26.7% (993)Foreign-born:
88.5% (1,262)
Black or African American - Speak only English Native:
95.7% (1,392)Foreign-born:
11.7% (50)
Black or African American - Speak another language Native:
4.2% (62)Foreign-born:
78.6% (336)
Asian - Speak only English Native:
38.3% (168)Foreign-born:
12.6% (154)
Asian - Speak another language Native:
60.2% (264)Foreign-born:
87.7% (1,077)
Native Hawaiian / Pacific Islander - Speak only English Native:
57.2% (103)Foreign-born:
8.9% (19)
Native Hawaiian / Pacific Islander - Speak another language Native:
41.0% (74)Foreign-born:
90.2% (188)
Other race - Speak only English Native:
33.4% (1,023)Foreign-born:
1.5% (23)
Other race - Speak another language Native:
66.7% (2,043)Foreign-born:
96.3% (1,548)
Two or more races - Speak only English Native:
60.6% (645)Foreign-born:
5.3% (28)
Two or more races - Speak another language Native:
42.6% (453)Foreign-born:
98.7% (516)
White alone - Speak only English Native:
92.7% (2,107)Foreign-born:
22.1% (75)
White alone - Speak another language Native:
7.5% (170)Foreign-born:
78.7% (269)
Hispanic or Latino - Speak only English Native:
35.8% (1,857)Foreign-born:
1.8% (56)
Hispanic or Latino - Speak another language Native:
63.3% (3,285)Foreign-born:
96.5% (3,042)
Foreign-born residents in Cherryland 5,663 residents are foreign born (21.3% Latin America , 8.0% Asia ).
This city:
34.9%California:
100.0%
Marital status for residents in Cherryland Marital status - White (Caucasian) population 15 years and over
Males 52.9% Never married35.5% Now married1.2% Separated0.8% Widowed9.6% DivorcedFemales 39.3% Never married37.7% Now married4.7% Separated8.8% Widowed9.5% DivorcedWomen who gave birth in the past 12 months Now married:
100.0% (58)Unmarried:
0.0% (0)
Women who did not give birth in the past 12 months Now married:
37.8% (413)Unmarried:
62.2% (681)
Marital status - Black or African American population 15 years and over
Males 48.3% Never married27.1% Now married0.4% Separated0.0% Widowed24.3% DivorcedFemales 44.2% Never married27.2% Now married0.0% Separated3.0% Widowed25.6% DivorcedWomen who gave birth in the past 12 months Now married:
0.0% (0)Unmarried:
100.0% (48)
Women who did not give birth in the past 12 months Now married:
33.5% (146)Unmarried:
66.5% (291)
Marital status - American Indian / Alaska Native population 15 years and over
Males 0.0% Never married100.0% Now married0.0% Separated0.0% Widowed0.0% DivorcedFemales 62.8% Never married14.0% Now married0.0% Separated23.3% Widowed0.0% DivorcedWomen who did not give birth in the past 12 months Now married:
0.0% (0)Unmarried:
100.0% (46)
Marital status - Asian population 15 years and over
Males 26.1% Never married60.2% Now married0.0% Separated2.9% Widowed10.7% DivorcedFemales 26.9% Never married49.9% Now married0.0% Separated11.0% Widowed12.3% DivorcedWomen who gave birth in the past 12 months Now married:
86.1% (32)Unmarried:
13.9% (5)
Women who did not give birth in the past 12 months Now married:
52.1% (237)Unmarried:
47.9% (218)
Marital status - Native Hawaiian / Pacific Islander population 15 years and over
Males 36.6% Never married42.1% Now married0.0% Separated0.0% Widowed21.3% DivorcedFemales 10.8% Never married83.8% Now married5.4% Separated0.0% Widowed0.0% DivorcedWomen who did not give birth in the past 12 months Now married:
83.5% (65)Unmarried:
16.5% (13)
Marital status - Other race population 15 years and over
Males 40.9% Never married53.4% Now married0.0% Separated0.6% Widowed5.1% DivorcedFemales 34.9% Never married52.1% Now married2.1% Separated3.8% Widowed7.0% DivorcedWomen who gave birth in the past 12 months Now married:
83.3% (76)Unmarried:
16.7% (15)
Women who did not give birth in the past 12 months Now married:
54.0% (668)Unmarried:
46.0% (569)
Marital status - Two or more races population 15 years and over
Males 27.8% Never married25.1% Now married0.0% Separated15.5% Widowed31.6% DivorcedFemales 69.6% Never married3.2% Now married10.1% Separated0.0% Widowed17.1% DivorcedWomen who gave birth in the past 12 months Now married:
100.0% (15)Unmarried:
0.0% (0)
Women who did not give birth in the past 12 months Now married:
5.9% (24)Unmarried:
94.1% (380)
Marital status - White alone, not Hispanic / Latino population 15 years and over
Males 54.0% Never married30.2% Now married0.6% Separated0.0% Widowed15.1% DivorcedFemales 35.7% Never married31.6% Now married3.9% Separated15.3% Widowed13.6% DivorcedWomen who gave birth in the past 12 months Now married:
100.0% (5)Unmarried:
0.0% (0)
Women who did not give birth in the past 12 months Now married:
29.5% (85)Unmarried:
70.5% (203)
Marital status - Hispanic or Latino population 15 years and over
Males 45.3% Never married46.1% Now married0.9% Separated1.9% Widowed5.9% DivorcedFemales 39.7% Never married45.6% Now married3.9% Separated4.1% Widowed6.6% DivorcedWomen who gave birth in the past 12 months Now married:
91.2% (138)Unmarried:
8.8% (13)
Women who did not give birth in the past 12 months Now married:
45.1% (1,051)Unmarried:
54.9% (1,279)
Ancestries in Cherryland
191 1.8% Portuguese144 1.3% Italian132 1.2% German128 1.2% American62 0.6% English55 0.5% Irish52 0.5% British46 0.4% Scottish43 0.4% African34 0.3% Yugoslavian32 0.3% Ethiopian31 0.3% Romanian28 0.3% Russian26 0.2% European23 0.2% Iranian22 0.2% Arab21 0.2% Norwegian19 0.2% Northern European18 0.2% Dutch9 0.08% Jamaican8 0.07% Scotch-Irish6 0.06% Palestinian6 0.06% Danish
Geographical mobility in Cherryland Same house 1 year ago 5,391 95.6% White (Caucasian)1,601 81.2% Black or African American126 100.0% American Indian / Alaska Native1,638 92.6% Asian386 94.7% Native Hawaiian / Pacific Islander4,440 89.3% Other race1,544 100.0% Two or more races2,414 90.4% White alone, not Hispanic / Latino8,525 95.0% Hispanic or LatinoMoved within same county 193 3.4% White / Caucasian64 3.2% Black or African American92 5.2% Asian19 4.8% Native Hawaiian / Pacific Islander335 6.7% Other race23 1.5% Two or more races180 6.7% White alone, not Hispanic / Latino365 4.1% Hispanic or LatinoMoved within same state 58 1.0% White / Caucasian24 1.2% Black or African American37 2.1% Asian123 2.5% Other race8 0.5% Two or more races48 1.8% White alone, not Hispanic / Latino95 1.1% Hispanic or LatinoMoved from different state 30 0.5% White / Caucasian16 0.8% Black or African American36 1.3% White alone, not Hispanic / LatinoMoved from abroad 247 12.5% Black or African American12 0.7% Asian45 0.9% Other race37 0.4% Hispanic or Latino
Children Nativity (place of birth) in Cherryland
Children under 6 years - Living with two parents Both parents native 313 100.0% NativeBoth parents foreign-born 391 100.0% NativeOne native, one foreign-born parent 45 100.0% NativeChildren under 6 years - Living with one parent Native parent 207 99.9% Native0 0.1% Foreign-bornForeign-born parent 117 71.4% Native47 28.6% Foreign-bornChildren 6 to 17 years - Living with two parents Both parents native 638 99.9% Native1 0.1% Foreign-bornBoth parents foreign-born 708 86.7% Native108 13.3% Foreign-bornOne native, one foreign-born parent 108 100.0% NativeChildren 6 to 17 years - Living with one parent Native parent 440 100.0% NativeForeign-born parent 381 53.3% Native334 46.7% Foreign-born
Grandparents responsible for own grandchildren in Cherryland
Grandparents (30 to 59 years) White / Caucasian 32 100.0% Not responsible for grandchildrenAmerican Indian / Alaska Native 8 100.0% Not responsible for grandchildrenOther race 16 38.6% Responsible for grandchildren26 61.4% Not responsible for grandchildrenWhite alone, not Hispanic / Latino 13 100.0% Not responsible for grandchildrenHispanic or Latino 13 15.9% Responsible for grandchildren68 84.1% Not responsible for grandchildrenGrandparents (60 years and over) White / Caucasian 46 100.0% Not responsible for grandchildrenOther race 31 31.8% Responsible for grandchildren66 68.2% Not responsible for grandchildrenWhite alone, not Hispanic / Latino 44 100.0% Not responsible for grandchildrenHispanic or Latino 23 20.3% Responsible for grandchildren90 79.7% Not responsible for grandchildren