Races in Chesterfield, Missouri (MO) Detailed Stats
Data:
Races - White alone (%)
Races - White alone (% change since 2000)
Races - Black alone (%)
Races - Black alone (% change since 2000)
Races - American Indian alone (%)
Races - American Indian alone (% change since 2000)
Races - Asian alone (%)
Races - Asian alone (% change since 2000)
Races - Hispanic (%)
Races - Hispanic (% change since 2000)
Races - Native Hawaiian and Other Pacific Islander alone (%)
Races - Native Hawaiian and Other Pacific Islander alone (% change since 2000)
Races - Two or more races(%)
Races - Two or more races(% change since 2000)
Races - Other race alone (%)
Races - Other race alone (% change since 2000)
Racial diversity
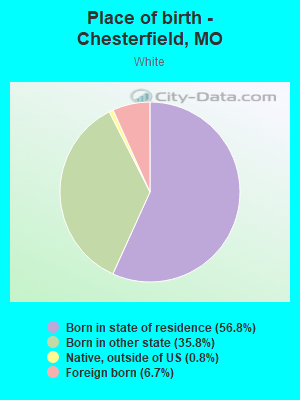
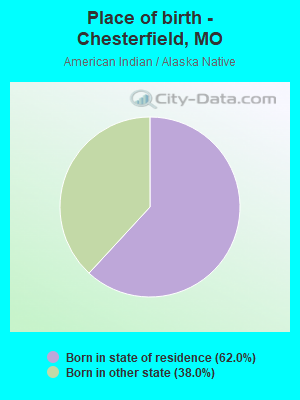
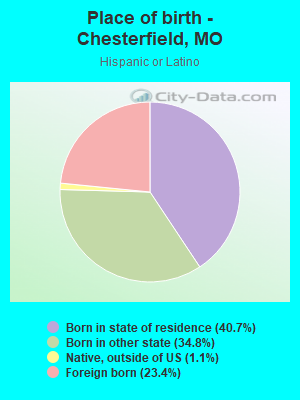
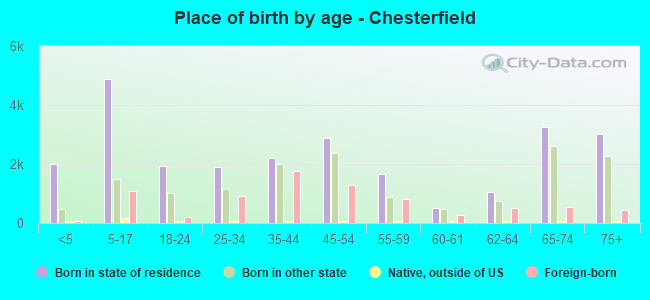
Place of birth - Born in state of residence (%)
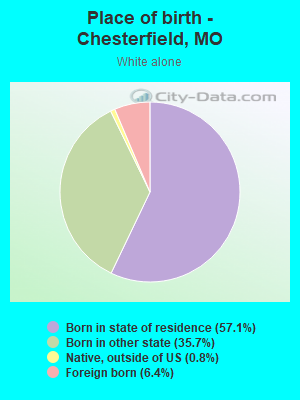
Place of birth - Born in state of residence (%) - White
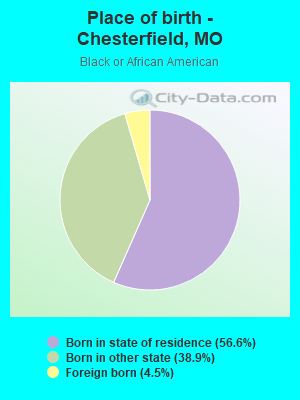
Place of birth - Born in state of residence (%) - Black or African American
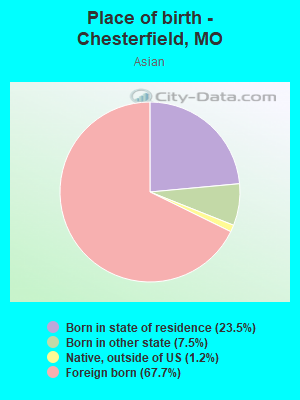
Place of birth - Born in state of residence (%) - Asian
Place of birth - Born in state of residence (%) - Hispanic or Latino
Place of birth - Born in state of residence (%) - American Indian and Alaska Native
Place of birth - Born in state of residence (%) - Multirace
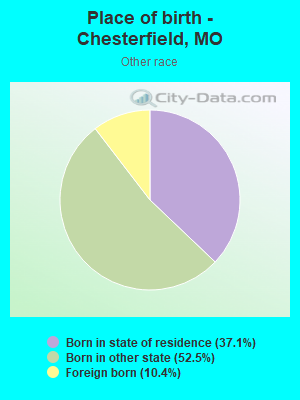
Place of birth - Born in state of residence (%) - Other Race
Place of birth - Born in other state (%)
Place of birth - Born in other state (%) - White
Place of birth - Born in other state (%) - Black or African American
Place of birth - Born in other state (%) - Asian
Place of birth - Born in other state (%) - Hispanic or Latino
Place of birth - Born in other state (%) - American Indian and Alaska Native
Place of birth - Born in other state (%) - Multirace
Place of birth - Born in other state (%) - Other Race
Place of birth - Native, outside of US (%)
Place of birth - Native, outside of US (%) - White
Place of birth - Native, outside of US (%) - Black or African American
Place of birth - Native, outside of US (%) - Asian
Place of birth - Native, outside of US (%) - Hispanic or Latino
Place of birth - Native, outside of US (%) - American Indian and Alaska Native
Place of birth - Native, outside of US (%) - Multirace
Place of birth - Native, outside of US (%) - Other Race
Place of birth - Foreign born (%)
Place of birth - Foreign born (%) - White
Place of birth - Foreign born (%) - Black or African American
Place of birth - Foreign born (%) - Asian
Place of birth - Foreign born (%) - Hispanic or Latino
Place of birth - Foreign born (%) - American Indian and Alaska Native
Place of birth - Foreign born (%) - Multirace
Place of birth - Foreign born (%) - Other Race
Residents speaking English at home (%)
Residents speaking English at home - Born in the United States (%)
Residents speaking English at home - Native, born elsewhere (%)
Residents speaking English at home - Foreign born (%)
Residents speaking Spanish at home (%)
Residents speaking Spanish at home - Born in the United States (%)
Residents speaking Spanish at home - Native, born elsewhere (%)
Residents speaking Spanish at home - Foreign born (%)
Residents speaking other language at home (%)
Residents speaking other language at home - Born in the United States (%)
Residents speaking other language at home - Native, born elsewhere (%)
Residents speaking other language at home - Foreign born (%)
Marital status - Never married (%)
Marital status - Now married (%)
Marital status - Separated (%)
Marital status - Widowed (%)
Marital status - Divorced (%)
Ancestries Reported - Arab (%)
Ancestries Reported - Czech (%)
Ancestries Reported - Danish (%)
Ancestries Reported - Dutch (%)
Ancestries Reported - English (%)
Ancestries Reported - French (%)
Ancestries Reported - French Canadian (%)
Ancestries Reported - German (%)
Ancestries Reported - Greek (%)
Ancestries Reported - Hungarian (%)
Ancestries Reported - Irish (%)
Ancestries Reported - Italian (%)
Ancestries Reported - Lithuanian (%)
Ancestries Reported - Norwegian (%)
Ancestries Reported - Polish (%)
Ancestries Reported - Portuguese (%)
Ancestries Reported - Russian (%)
Ancestries Reported - Scotch-Irish (%)
Ancestries Reported - Scottish (%)
Ancestries Reported - Slovak (%)
Ancestries Reported - Subsaharan African (%)
Ancestries Reported - Swedish (%)
Ancestries Reported - Swiss (%)
Ancestries Reported - Ukrainian (%)
Ancestries Reported - United States (%)
Ancestries Reported - Welsh (%)
Ancestries Reported - West Indian (%)
Ancestries Reported - Other (%)
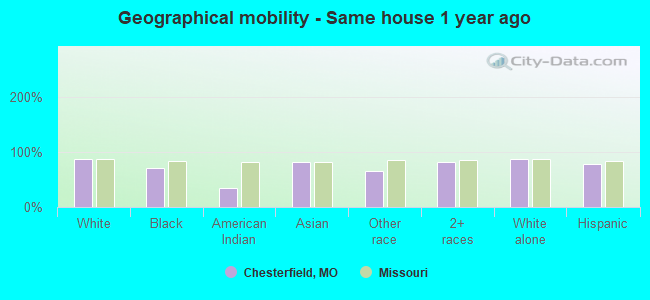
Geographical mobility - Same house 1 year ago (%)
Geographical mobility - Same house 1 year ago (%) - White
Geographical mobility - Same house 1 year ago (%) - Black or African American
Geographical mobility - Same house 1 year ago (%) - Asian
Geographical mobility - Same house 1 year ago (%) - Hispanic or Latino
Geographical mobility - Same house 1 year ago (%) - American Indian and Alaska Native
Geographical mobility - Same house 1 year ago (%) - Multirace
Geographical mobility - Same house 1 year ago (%) - Other Race
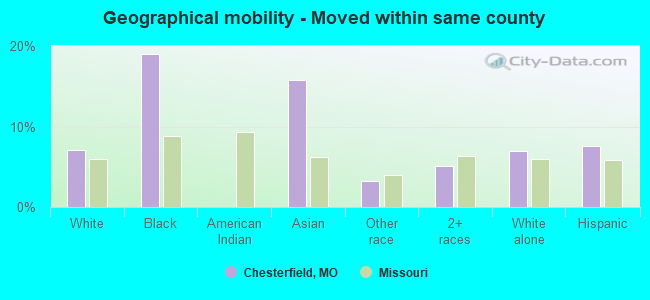
Geographical mobility - Moved within same county (%)
Geographical mobility - Moved within same county (%) - White
Geographical mobility - Moved within same county (%) - Black or African American
Geographical mobility - Moved within same county (%) - Asian
Geographical mobility - Moved within same county (%) - Hispanic or Latino
Geographical mobility - Moved within same county (%) - American Indian and Alaska Native
Geographical mobility - Moved within same county (%) - Multirace
Geographical mobility - Moved within same county (%) - Other Race
Geographical mobility - Moved from different county within same state (%)
Geographical mobility - Moved from different county within same state (%) - White
Geographical mobility - Moved from different county within same state (%) - Black or African American
Geographical mobility - Moved from different county within same state (%) - Asian
Geographical mobility - Moved from different county within same state (%) - Hispanic or Latino
Geographical mobility - Moved from different county within same state (%) - American Indian and Alaska Native
Geographical mobility - Moved from different county within same state (%) - Multirace
Geographical mobility - Moved from different county within same state (%) - Other Race
Geographical mobility - Moved from different state (%)
Geographical mobility - Moved from different state (%) - White
Geographical mobility - Moved from different state (%) - Black or African American
Geographical mobility - Moved from different state (%) - Asian
Geographical mobility - Moved from different state (%) - Hispanic or Latino
Geographical mobility - Moved from different state (%) - American Indian and Alaska Native
Geographical mobility - Moved from different state (%) - Multirace
Geographical mobility - Moved from different state (%) - Other Race
Geographical mobility - Moved from abroad (%)
Geographical mobility - Moved from abroad (%) - White
Geographical mobility - Moved from abroad (%) - Black or African American
Geographical mobility - Moved from abroad (%) - Asian
Geographical mobility - Moved from abroad (%) - Hispanic or Latino
Geographical mobility - Moved from abroad (%) - American Indian and Alaska Native
Geographical mobility - Moved from abroad (%) - Multirace
Geographical mobility - Moved from abroad (%) - Other Race
Place of birth for the foreign-born population - Ireland (%)
Place of birth for the foreign-born population - Denmark (%)
Place of birth for the foreign-born population - Norway (%)
Place of birth for the foreign-born population - Sweden (%)
Place of birth for the foreign-born population - United Kingdom (%)
Place of birth for the foreign-born population - England (%)
Place of birth for the foreign-born population - Scotland (%)
Place of birth for the foreign-born population - Other Northern Europe (%)
Place of birth for the foreign-born population - Austria (%)
Place of birth for the foreign-born population - Belgium (%)
Place of birth for the foreign-born population - France (%)
Place of birth for the foreign-born population - Germany (%)
Place of birth for the foreign-born population - Netherlands (%)
Place of birth for the foreign-born population - Switzerland (%)
Place of birth for the foreign-born population - Other Western Europe (%)
Place of birth for the foreign-born population - Greece (%)
Place of birth for the foreign-born population - Italy (%)
Place of birth for the foreign-born population - Portugal (%)
Place of birth for the foreign-born population - Spain (%)
Place of birth for the foreign-born population - Other Southern Europe (%)
Place of birth for the foreign-born population - Albania (%)
Place of birth for the foreign-born population - Belarus (%)
Place of birth for the foreign-born population - Bosnia and Herzegovina (%)
Place of birth for the foreign-born population - Bulgaria (%)
Place of birth for the foreign-born population - Croatia (%)
Place of birth for the foreign-born population - Czechoslovakia (%)
Place of birth for the foreign-born population - Hungary (%)
Place of birth for the foreign-born population - Latvia (%)
Place of birth for the foreign-born population - Lithuania (%)
Place of birth for the foreign-born population - North Macedonia (Macedonia) (%)
Place of birth for the foreign-born population - Moldova (%)
Place of birth for the foreign-born population - Poland (%)
Place of birth for the foreign-born population - Romania (%)
Place of birth for the foreign-born population - Russia (%)
Place of birth for the foreign-born population - Serbia (%)
Place of birth for the foreign-born population - Ukraine (%)
Place of birth for the foreign-born population - Other Eastern Europe (%)
Place of birth for the foreign-born population - China (%)
Place of birth for the foreign-born population - Hong Kong (%)
Place of birth for the foreign-born population - Taiwan (%)
Place of birth for the foreign-born population - Japan (%)
Place of birth for the foreign-born population - Korea (%)
Place of birth for the foreign-born population - Other Eastern Asia (%)
Place of birth for the foreign-born population - Afghanistan (%)
Place of birth for the foreign-born population - Bangladesh (%)
Place of birth for the foreign-born population - India (%)
Place of birth for the foreign-born population - Iran (%)
Place of birth for the foreign-born population - Kazakhstan (%)
Place of birth for the foreign-born population - Nepal (%)
Place of birth for the foreign-born population - Pakistan (%)
Place of birth for the foreign-born population - Sri Lanka (%)
Place of birth for the foreign-born population - Uzbekistan (%)
Place of birth for the foreign-born population - Other South Central Asia (%)
Place of birth for the foreign-born population - Burma (%)
Place of birth for the foreign-born population - Cambodia (%)
Place of birth for the foreign-born population - Indonesia (%)
Place of birth for the foreign-born population - Laos (%)
Place of birth for the foreign-born population - Malaysia (%)
Place of birth for the foreign-born population - Philippines (%)
Place of birth for the foreign-born population - Singapore (%)
Place of birth for the foreign-born population - Thailand (%)
Place of birth for the foreign-born population - Vietnam (%)
Place of birth for the foreign-born population - Other South Eastern Asia (%)
Place of birth for the foreign-born population - Armenia (%)
Place of birth for the foreign-born population - Iraq (%)
Place of birth for the foreign-born population - Israel (%)
Place of birth for the foreign-born population - Jordan (%)
Place of birth for the foreign-born population - Kuwait (%)
Place of birth for the foreign-born population - Lebanon (%)
Place of birth for the foreign-born population - Saudi Arabia (%)
Place of birth for the foreign-born population - Syria (%)
Place of birth for the foreign-born population - Turkey (%)
Place of birth for the foreign-born population - Yemen (%)
Place of birth for the foreign-born population - Other Western Asia (%)
Place of birth for the foreign-born population - Eritrea (%)
Place of birth for the foreign-born population - Ethiopia (%)
Place of birth for the foreign-born population - Kenya (%)
Place of birth for the foreign-born population - Somalia (%)
Place of birth for the foreign-born population - Uganda (%)
Place of birth for the foreign-born population - Zimbabwe (%)
Place of birth for the foreign-born population - Other Eastern Africa (%)
Place of birth for the foreign-born population - Cameroon (%)
Place of birth for the foreign-born population - Congo (%)
Place of birth for the foreign-born population - Democratic Republic of Congo (Zaire) (%)
Place of birth for the foreign-born population - Other Middle Africa (%)
Place of birth for the foreign-born population - Egypt (%)
Place of birth for the foreign-born population - Morocco (%)
Place of birth for the foreign-born population - Sudan (%)
Place of birth for the foreign-born population - Other Northern Africa (%)
Place of birth for the foreign-born population - South Africa (%)
Place of birth for the foreign-born population - Other Southern Africa (%)
Place of birth for the foreign-born population - Cabo Verde (%)
Place of birth for the foreign-born population - Ghana (%)
Place of birth for the foreign-born population - Liberia (%)
Place of birth for the foreign-born population - Nigeria (%)
Place of birth for the foreign-born population - Senegal (%)
Place of birth for the foreign-born population - Sierra Leone (%)
Place of birth for the foreign-born population - Other Western Africa (%)
Place of birth for the foreign-born population - Australia (%)
Place of birth for the foreign-born population - New Zealand (%)
Place of birth for the foreign-born population - Fiji (%)
Place of birth for the foreign-born population - Micronesia (%)
Place of birth for the foreign-born population - Bahamas (%)
Place of birth for the foreign-born population - Barbados (%)
Place of birth for the foreign-born population - Cuba (%)
Place of birth for the foreign-born population - Dominica (%)
Place of birth for the foreign-born population - Dominican Republic (%)
Place of birth for the foreign-born population - Grenada (%)
Place of birth for the foreign-born population - Haiti (%)
Place of birth for the foreign-born population - Jamaica (%)
Place of birth for the foreign-born population - St. Vincent and the Grenadines (%)
Place of birth for the foreign-born population - Trinidad and Tobago (%)
Place of birth for the foreign-born population - West Indies (%)
Place of birth for the foreign-born population - Other Caribbean (%)
Place of birth for the foreign-born population - Belize (%)
Place of birth for the foreign-born population - Costa Rica (%)
Place of birth for the foreign-born population - El Salvador (%)
Place of birth for the foreign-born population - Guatemala (%)
Place of birth for the foreign-born population - Honduras (%)
Place of birth for the foreign-born population - Mexico (%)
Place of birth for the foreign-born population - Nicaragua (%)
Place of birth for the foreign-born population - Panama (%)
Place of birth for the foreign-born population - Other Central America (%)
Place of birth for the foreign-born population - Argentina (%)
Place of birth for the foreign-born population - Bolivia (%)
Place of birth for the foreign-born population - Brazil (%)
Place of birth for the foreign-born population - Chile (%)
Place of birth for the foreign-born population - Colombia (%)
Place of birth for the foreign-born population - Ecuador (%)
Place of birth for the foreign-born population - Guyana (%)
Place of birth for the foreign-born population - Peru (%)
Place of birth for the foreign-born population - Uruguay (%)
Place of birth for the foreign-born population - Venezuela (%)
Place of birth for the foreign-born population - Other South America (%)
Place of birth for the foreign-born population - Canada (%)
Place of birth for the foreign-born population - Other Northern America (%)
Place of birth for the foreign-born population - Other (%)
Latest news about races in Chesterfield, MO collected exclusively by city-data.com from local newspapers, TV, and radio stations
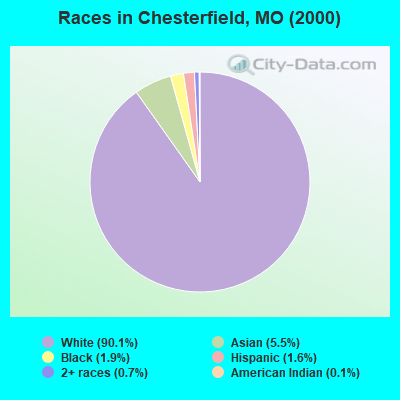
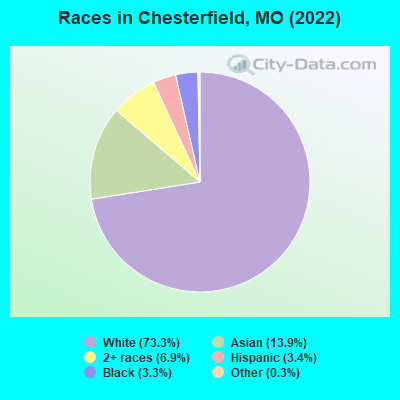
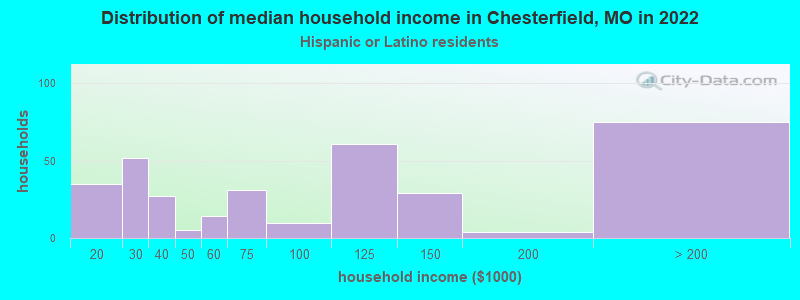
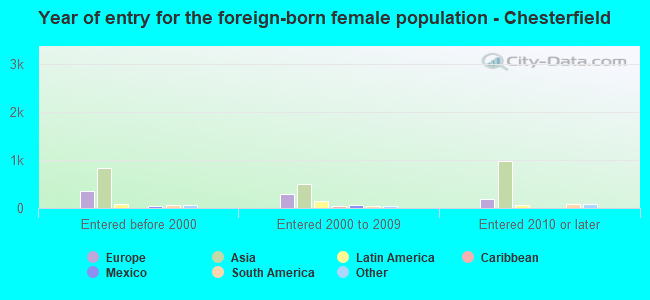
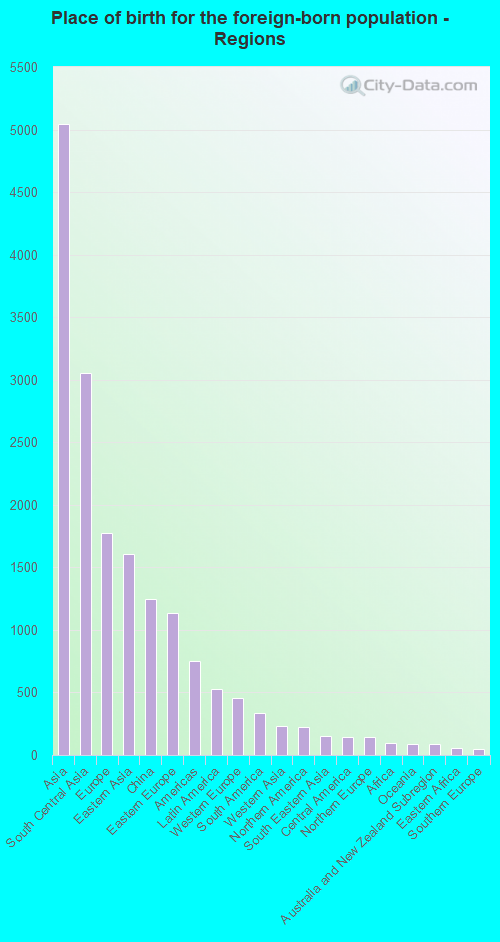
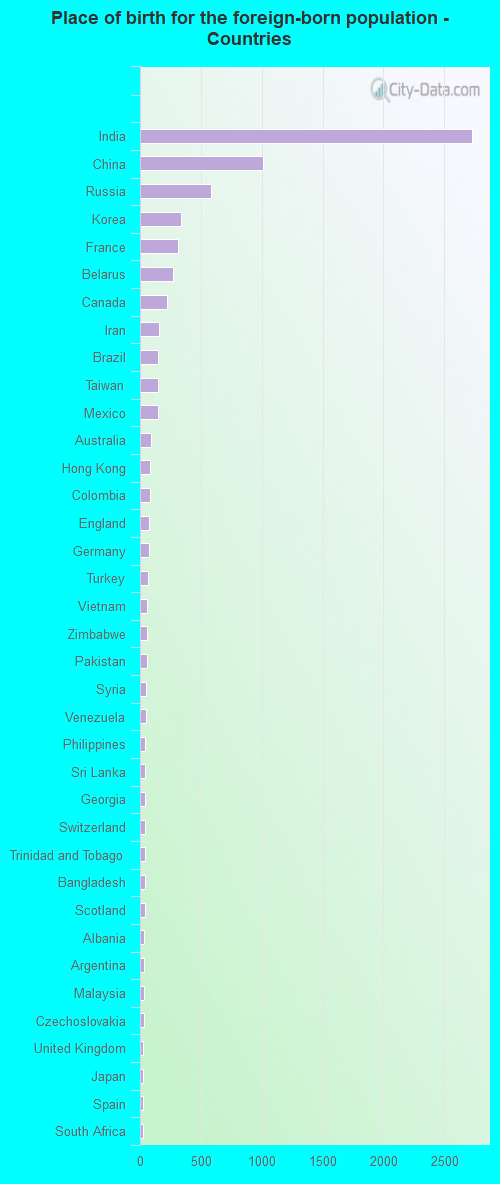
According to 2022 data, the most numerous races in Chesterfield, MO are White alone (36,030 residents), Black alone (1,632 residents), and Two or more races (3,394 residents). 83.5% of Chesterfield residents speak English at home. 15.8% of Chesterfield, MO residents are foreign-born (10.4% born in Asia, 3.7% born in Europe), which is 74.7% greater than the foreign-born rate of 4.0% across the entire state of Missouri.
Race distribution in Chesterfield
2000 2022
4,686,474 83.8% White alone 625,667 11.2% Black alone 118,592 2.1% Hispanic 71,905 1.3% Two or more races 61,041 1.1% Asian alone 23,302 0.4% American Indian alone 5,291 0.09% Other race alone 2,939 0.05% Native Hawaiian and Other
4,733,411 76.6% White alone 656,739 10.6% Black alone 316,300 5.1% Two or more races 291,763 4.7% Hispanic 132,436 2.1% Asian alone 27,467 0.4% Other race alone 12,313 0.2% American Indian alone 7,528 0.1% Native Hawaiian and Other
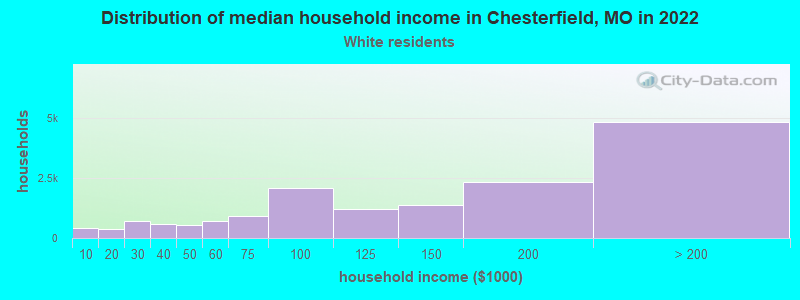
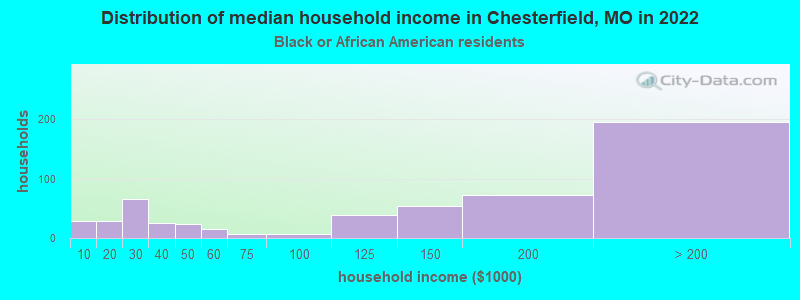
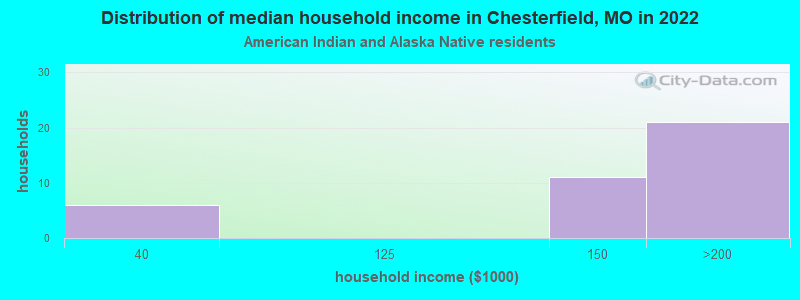
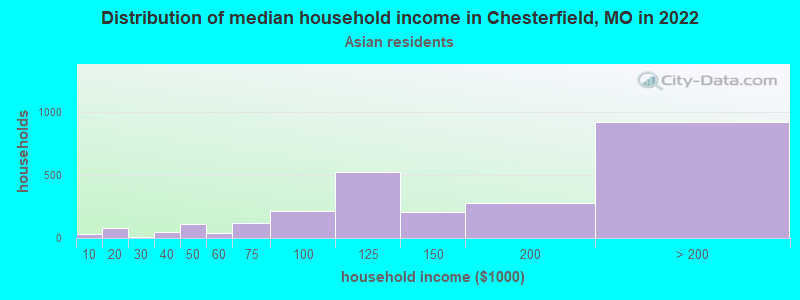
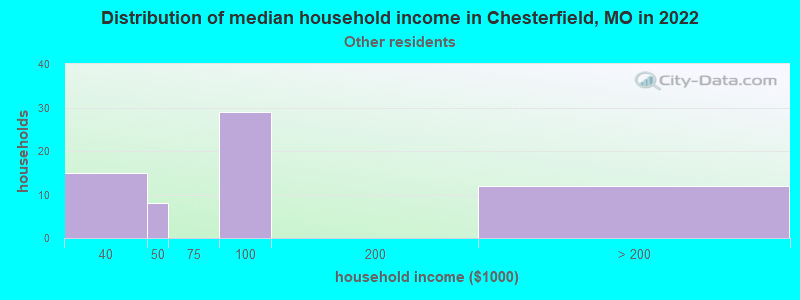
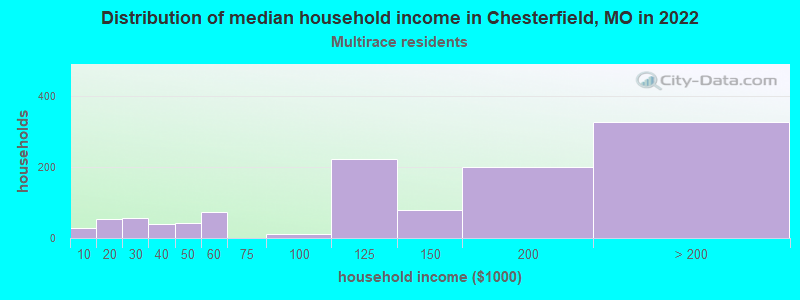
Income and house value in Chesterfield Median household income in 2022 $139,720 White non-Hispanic householders$139,716 Black householders$133,158 Asian householders$140,143 Two or more races householdersMedian 2022 house value $477,673 White Non-Hispanic householders$423,201 Black or African American householders$190,949 American Indian or Alaska Native householders $448,542 Asian householders$414,023 Some other race householders$299,294 Two or more races householders$639,491 Hispanic or Latino householders
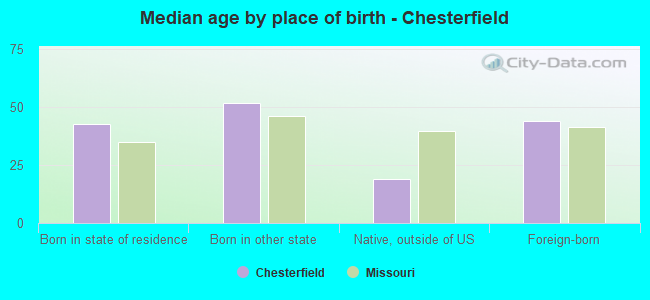
Median age by race in Chesterfield
51.0 Median age for White residents49.9 52.7 37.6 Median age for Black or African American residents37.0 39.1 46.8 Median age for American Indian / Alaska Native residents59.3 -505,494,505.0 37.6 Median age for Asian residents38.5 37.9 -710,303,029.6 Median age for Native Hawaiian / Pacific Islander residents-1,449,781,657.9 -752,136,751.4 29.3 Median age for Other race residents34.1 30.0 24.0 Median age for Two or more races residents20.7 26.9 51.3 Median age for White alone residents50.2 52.7 28.5 Median age for Hispanic or Latino residents20.4 36.5
Owner/renter occupied households by race in Chesterfield
House owners and renters - White residents 13,248 82.4% Owner occupied2,824 17.6% Renter occupiedHouse owners and renters - Black or African American residents 340 62.0% Owner occupied208 38.0% Renter occupiedHouse owners and renters - American Indian / Alaska Native residents 9 100.0% Owner occupiedHouse owners and renters - Asian residents 1,809 67.4% Owner occupied876 32.6% Renter occupiedHouse owners and renters - Other race residents 9 15.6% Owner occupied47 84.4% Renter occupiedHouse owners and renters - Two or more races residents 859 71.7% Owner occupied339 28.3% Renter occupiedHouse owners and renters - White alone residents 13,126 82.3% Owner occupied2,832 17.7% Renter occupiedHouse owners and renters - Hispanic or Latino residents 270 77.0% Owner occupied81 23.0% Renter occupied
Language usage in Chesterfield
English speakers - Total 83.5% of residents of Chesterfield speak English at home.
2.1% of residents speak Spanish at home 786 79.9% Speak English very well198 20.1% Speak English less than very well14.5% of residents speak other language at home 4,966 73.5% Speak English very well1,790 26.5% Speak English less than very well
English speakers - Born in the United States 95.4% of residents of Chesterfield speak English at home.
2.2% of residents speak Spanish at home 317 94.6% Speak English very well18 5.4% Speak English less than very well2.3% of residents speak other language at home 330 94.8% Speak English very well18 5.2% Speak English less than very well
English speakers - Native, born elsewhere 79.1% of residents of Chesterfield speak English at home.
12.4% of residents speak Spanish at home 44 100.0% Speak English very well11.3% of residents speak other language at home 18 45.0% Speak English very well22 55.0% Speak English less than very well
English speakers - Foreign-born 26.7% of residents of Chesterfield speak English at home.
4.4% of residents speak Spanish at home 194 56.4% Speak English very well150 43.6% Speak English less than very well68.2% of residents speak other language at home 3,731 70.0% Speak English very well1,599 30.0% Speak English less than very well
White (Caucasian) - Speak only English Native:
97.9% (32,168)Foreign-born:
38.6% (941)
White (Caucasian) - Speak another language Native:
2.1% (681)Foreign-born:
57.9% (1,410)
Black or African American - Speak another language Native:
15.7% (238)Foreign-born:
91.6% (64)
Asian - Speak only English Native:
47.7% (754)Foreign-born:
17.8% (831)
Asian - Speak another language Native:
50.2% (794)Foreign-born:
82.6% (3,845)
Other race - Speak another language Native:
26.0% (47)Foreign-born:
90.6% (26)
Two or more races - Speak only English Native:
93.1% (2,927)Foreign-born:
20.7% (95)
Two or more races - Speak another language Native:
6.7% (210)Foreign-born:
71.5% (330)
White alone - Speak only English Native:
98.2% (32,002)Foreign-born:
40.7% (932)
White alone - Speak another language Native:
1.8% (574)Foreign-born:
55.4% (1,269)
Hispanic or Latino - Speak only English Native:
73.0% (721)Foreign-born:
15.4% (60)
Hispanic or Latino - Speak another language Native:
28.5% (282)Foreign-born:
83.1% (324)
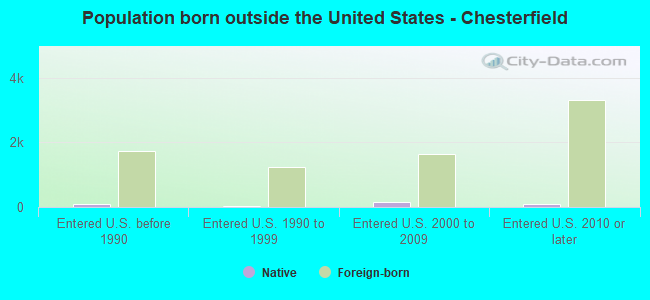
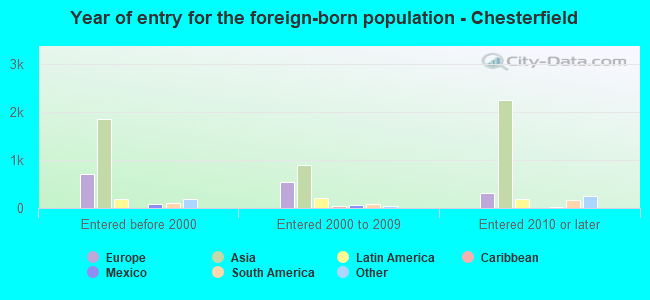
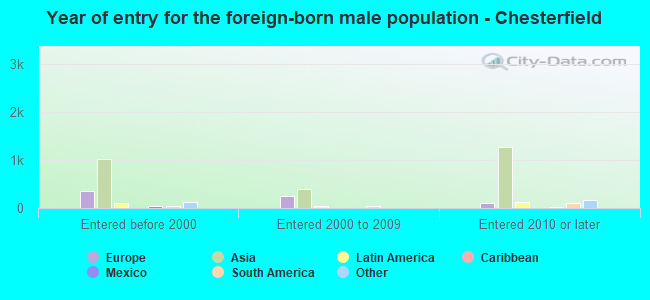
Foreign-born residents in Chesterfield 7,765 residents are foreign born (10.4% Asia , 3.7% Europe ).
This city:
15.8%Missouri:
4.2%
Marital status for residents in Chesterfield Marital status - White (Caucasian) population 15 years and over
Males 23.0% Never married67.7% Now married0.2% Separated2.1% Widowed7.0% DivorcedFemales 17.2% Never married59.9% Now married0.4% Separated13.7% Widowed8.9% DivorcedWomen who gave birth in the past 12 months Now married:
100.0% (324)Unmarried:
0.0% (0)
Women who did not give birth in the past 12 months Now married:
55.5% (3,458)Unmarried:
44.5% (2,772)
Marital status - Black or African American population 15 years and over
Males 43.9% Never married41.4% Now married5.8% Separated3.3% Widowed5.6% DivorcedFemales 53.4% Never married30.1% Now married0.6% Separated10.1% Widowed5.8% DivorcedWomen who did not give birth in the past 12 months Now married:
27.3% (127)Unmarried:
72.7% (340)
Marital status - American Indian / Alaska Native population 15 years and over
Males 38.1% Never married47.6% Now married0.0% Separated14.3% Widowed0.0% DivorcedFemales 0.0% Never married100.0% Now married0.0% Separated0.0% Widowed0.0% DivorcedMarital status - Asian population 15 years and over
Males 20.4% Never married72.1% Now married0.0% Separated1.2% Widowed6.3% DivorcedFemales 8.0% Never married85.2% Now married0.0% Separated3.9% Widowed2.8% DivorcedWomen who gave birth in the past 12 months Now married:
100.0% (177)Unmarried:
0.0% (0)
Women who did not give birth in the past 12 months Now married:
82.3% (1,124)Unmarried:
17.7% (241)
Marital status - Other race population 15 years and over
Males 0.0% Never married54.5% Now married0.0% Separated0.0% Widowed45.5% DivorcedFemales 22.2% Never married70.6% Now married0.0% Separated0.0% Widowed7.2% DivorcedWomen who did not give birth in the past 12 months Now married:
70.6% (116)Unmarried:
29.4% (48)
Marital status - Two or more races population 15 years and over
Males 46.9% Never married52.6% Now married0.0% Separated0.0% Widowed0.5% DivorcedFemales 31.9% Never married49.3% Now married0.6% Separated2.9% Widowed15.2% DivorcedWomen who gave birth in the past 12 months Now married:
100.0% (162)Unmarried:
0.0% (0)
Women who did not give birth in the past 12 months Now married:
37.3% (297)Unmarried:
62.7% (500)
Marital status - White alone, not Hispanic / Latino population 15 years and over
Males 22.8% Never married67.9% Now married0.2% Separated2.0% Widowed7.1% DivorcedFemales 17.3% Never married59.6% Now married0.3% Separated13.9% Widowed8.9% DivorcedWomen who gave birth in the past 12 months Now married:
100.0% (315)Unmarried:
0.0% (0)
Women who did not give birth in the past 12 months Now married:
55.1% (3,386)Unmarried:
44.9% (2,762)
Marital status - Hispanic or Latino population 15 years and over
Males 31.8% Never married63.6% Now married0.0% Separated2.4% Widowed2.2% DivorcedFemales 28.2% Never married58.4% Now married2.0% Separated2.9% Widowed8.5% DivorcedWomen who gave birth in the past 12 months Now married:
100.0% (72)Unmarried:
0.0% (0)
Women who did not give birth in the past 12 months Now married:
50.0% (234)Unmarried:
50.0% (234)
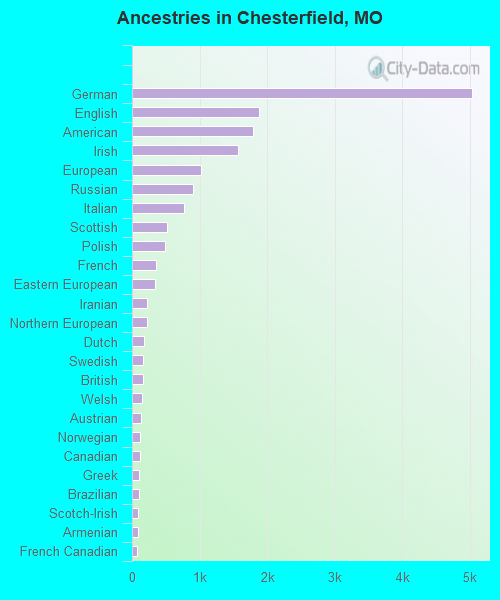
Ancestries in Chesterfield
5,034 18.7% German1,882 7.0% English1,793 6.7% American1,568 5.8% Irish1,025 3.8% European905 3.4% Russian774 2.9% Italian520 1.9% Scottish485 1.8% Polish352 1.3% French334 1.2% Eastern European228 0.8% Iranian216 0.8% Northern European179 0.7% Dutch163 0.6% Swedish156 0.6% British144 0.5% Welsh130 0.5% Austrian121 0.4% Norwegian117 0.4% Canadian110 0.4% Greek104 0.4% Brazilian94 0.3% Scotch-Irish87 0.3% Armenian68 0.3% French Canadian67 0.2% Swiss61 0.2% Turkish59 0.2% Kenyan54 0.2% Czech54 0.2% Lebanese53 0.2% Albanian45 0.2% Portuguese42 0.2% African37 0.1% Lithuanian33 0.1% Ukrainian31 0.1% Scandinavian26 0.10% Danish26 0.10% Belgian22 0.08% South African21 0.08% Arab18 0.07% Macedonian16 0.06% Romanian15 0.06% Croatian15 0.06% Yugoslavian11 0.04% Hungarian9 0.03% Syrian8 0.03% Israeli8 0.03% Slovene8 0.03% Latvian6 0.02% Finnish5 0.02% Slovak4 0.01% Serbian
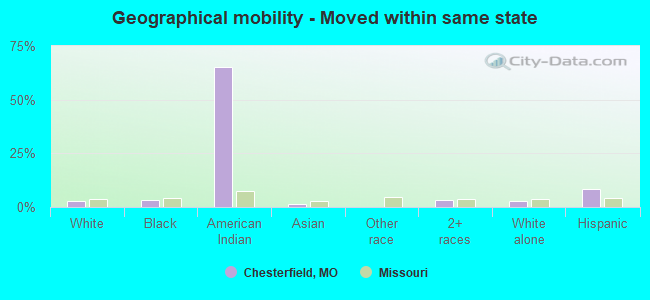
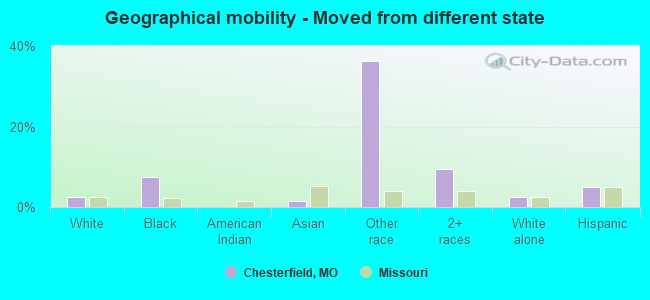
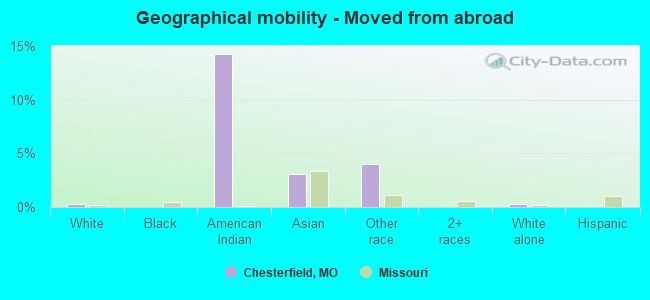
Geographical mobility in Chesterfield Same house 1 year ago 31,657 87.1% White (Caucasian)1,168 71.6% Black or African American11 34.9% American Indian / Alaska Native5,483 81.3% Asian169 64.8% Other race3,530 81.2% Two or more races31,266 87.1% White alone, not Hispanic / Latino1,216 78.8% Hispanic or LatinoMoved within same county 2,562 7.0% White / Caucasian309 18.9% Black or African American1,062 15.7% Asian8 3.2% Other race221 5.1% Two or more races2,497 7.0% White alone, not Hispanic / Latino117 7.6% Hispanic or LatinoMoved within same state 1,067 2.9% White / Caucasian53 3.3% Black or African American20 65.3% American Indian / Alaska Native106 1.6% Asian152 3.5% Two or more races1,056 2.9% White alone, not Hispanic / Latino133 8.6% Hispanic or LatinoMoved from different state 875 2.4% White / Caucasian120 7.4% Black or African American105 1.6% Asian94 36.3% Other race410 9.4% Two or more races872 2.4% White alone, not Hispanic / Latino78 5.0% Hispanic or LatinoMoved from abroad 104 0.3% White4 14.2% American Indian / Alaska Native206 3.1% Asian10 4.0% Other race107 0.3% White alone, not Hispanic / Latino
Children Nativity (place of birth) in Chesterfield
Children under 6 years - Living with two parents Both parents native 1,778 98.8% Native21 1.2% Foreign-bornBoth parents foreign-born 629 93.2% Native46 6.8% Foreign-bornOne native, one foreign-born parent 368 100.0% NativeChildren under 6 years - Living with one parent Native parent 147 100.0% NativeForeign-born parent 43 100.0% NativeChildren 6 to 17 years - Living with two parents Both parents native 4,176 90.0% Native466 10.0% Foreign-bornBoth parents foreign-born 567 49.3% Native583 50.7% Foreign-bornOne native, one foreign-born parent 258 100.0% NativeChildren 6 to 17 years - Living with one parent Native parent 937 100.0% NativeForeign-born parent 119 56.4% Native92 43.6% Foreign-born
Grandparents responsible for own grandchildren in Chesterfield
Grandparents (30 to 59 years) White / Caucasian 22 49.1% Responsible for grandchildren23 50.9% Not responsible for grandchildrenAsian 99 98.1% Responsible for grandchildren2 1.9% Not responsible for grandchildrenTwo or more races 7 32.1% Responsible for grandchildren15 67.9% Not responsible for grandchildrenWhite alone, not Hispanic / Latino 24 50.6% Responsible for grandchildren23 49.4% Not responsible for grandchildrenHispanic or Latino 9 100.0% Responsible for grandchildrenGrandparents (60 years and over) White / Caucasian 10 4.3% Responsible for grandchildren230 95.7% Not responsible for grandchildrenAsian 73 100.0% Not responsible for grandchildrenWhite alone, not Hispanic / Latino 10 4.3% Responsible for grandchildren230 95.7% Not responsible for grandchildrenHispanic or Latino 3 100.0% Not responsible for grandchildren