Races in Chillicothe, Ohio (OH) Detailed Stats
Data:
Races - White alone (%)
Races - White alone (% change since 2000)
Races - Black alone (%)
Races - Black alone (% change since 2000)
Races - American Indian alone (%)
Races - American Indian alone (% change since 2000)
Races - Asian alone (%)
Races - Asian alone (% change since 2000)
Races - Hispanic (%)
Races - Hispanic (% change since 2000)
Races - Native Hawaiian and Other Pacific Islander alone (%)
Races - Native Hawaiian and Other Pacific Islander alone (% change since 2000)
Races - Two or more races(%)
Races - Two or more races(% change since 2000)
Races - Other race alone (%)
Races - Other race alone (% change since 2000)
Racial diversity
Place of birth - Born in state of residence (%)
Place of birth - Born in state of residence (%) - White
Place of birth - Born in state of residence (%) - Black or African American
Place of birth - Born in state of residence (%) - Asian
Place of birth - Born in state of residence (%) - Hispanic or Latino
Place of birth - Born in state of residence (%) - American Indian and Alaska Native
Place of birth - Born in state of residence (%) - Multirace
Place of birth - Born in state of residence (%) - Other Race
Place of birth - Born in other state (%)
Place of birth - Born in other state (%) - White
Place of birth - Born in other state (%) - Black or African American
Place of birth - Born in other state (%) - Asian
Place of birth - Born in other state (%) - Hispanic or Latino
Place of birth - Born in other state (%) - American Indian and Alaska Native
Place of birth - Born in other state (%) - Multirace
Place of birth - Born in other state (%) - Other Race
Place of birth - Native, outside of US (%)
Place of birth - Native, outside of US (%) - White
Place of birth - Native, outside of US (%) - Black or African American
Place of birth - Native, outside of US (%) - Asian
Place of birth - Native, outside of US (%) - Hispanic or Latino
Place of birth - Native, outside of US (%) - American Indian and Alaska Native
Place of birth - Native, outside of US (%) - Multirace
Place of birth - Native, outside of US (%) - Other Race
Place of birth - Foreign born (%)
Place of birth - Foreign born (%) - White
Place of birth - Foreign born (%) - Black or African American
Place of birth - Foreign born (%) - Asian
Place of birth - Foreign born (%) - Hispanic or Latino
Place of birth - Foreign born (%) - American Indian and Alaska Native
Place of birth - Foreign born (%) - Multirace
Place of birth - Foreign born (%) - Other Race
Residents speaking English at home (%)
Residents speaking English at home - Born in the United States (%)
Residents speaking English at home - Native, born elsewhere (%)
Residents speaking English at home - Foreign born (%)
Residents speaking Spanish at home (%)
Residents speaking Spanish at home - Born in the United States (%)
Residents speaking Spanish at home - Native, born elsewhere (%)
Residents speaking Spanish at home - Foreign born (%)
Residents speaking other language at home (%)
Residents speaking other language at home - Born in the United States (%)
Residents speaking other language at home - Native, born elsewhere (%)
Residents speaking other language at home - Foreign born (%)
Marital status - Never married (%)
Marital status - Now married (%)
Marital status - Separated (%)
Marital status - Widowed (%)
Marital status - Divorced (%)
Ancestries Reported - Arab (%)
Ancestries Reported - Czech (%)
Ancestries Reported - Danish (%)
Ancestries Reported - Dutch (%)
Ancestries Reported - English (%)
Ancestries Reported - French (%)
Ancestries Reported - French Canadian (%)
Ancestries Reported - German (%)
Ancestries Reported - Greek (%)
Ancestries Reported - Hungarian (%)
Ancestries Reported - Irish (%)
Ancestries Reported - Italian (%)
Ancestries Reported - Lithuanian (%)
Ancestries Reported - Norwegian (%)
Ancestries Reported - Polish (%)
Ancestries Reported - Portuguese (%)
Ancestries Reported - Russian (%)
Ancestries Reported - Scotch-Irish (%)
Ancestries Reported - Scottish (%)
Ancestries Reported - Slovak (%)
Ancestries Reported - Subsaharan African (%)
Ancestries Reported - Swedish (%)
Ancestries Reported - Swiss (%)
Ancestries Reported - Ukrainian (%)
Ancestries Reported - United States (%)
Ancestries Reported - Welsh (%)
Ancestries Reported - West Indian (%)
Ancestries Reported - Other (%)
Geographical mobility - Same house 1 year ago (%)
Geographical mobility - Same house 1 year ago (%) - White
Geographical mobility - Same house 1 year ago (%) - Black or African American
Geographical mobility - Same house 1 year ago (%) - Asian
Geographical mobility - Same house 1 year ago (%) - Hispanic or Latino
Geographical mobility - Same house 1 year ago (%) - American Indian and Alaska Native
Geographical mobility - Same house 1 year ago (%) - Multirace
Geographical mobility - Same house 1 year ago (%) - Other Race
Geographical mobility - Moved within same county (%)
Geographical mobility - Moved within same county (%) - White
Geographical mobility - Moved within same county (%) - Black or African American
Geographical mobility - Moved within same county (%) - Asian
Geographical mobility - Moved within same county (%) - Hispanic or Latino
Geographical mobility - Moved within same county (%) - American Indian and Alaska Native
Geographical mobility - Moved within same county (%) - Multirace
Geographical mobility - Moved within same county (%) - Other Race
Geographical mobility - Moved from different county within same state (%)
Geographical mobility - Moved from different county within same state (%) - White
Geographical mobility - Moved from different county within same state (%) - Black or African American
Geographical mobility - Moved from different county within same state (%) - Asian
Geographical mobility - Moved from different county within same state (%) - Hispanic or Latino
Geographical mobility - Moved from different county within same state (%) - American Indian and Alaska Native
Geographical mobility - Moved from different county within same state (%) - Multirace
Geographical mobility - Moved from different county within same state (%) - Other Race
Geographical mobility - Moved from different state (%)
Geographical mobility - Moved from different state (%) - White
Geographical mobility - Moved from different state (%) - Black or African American
Geographical mobility - Moved from different state (%) - Asian
Geographical mobility - Moved from different state (%) - Hispanic or Latino
Geographical mobility - Moved from different state (%) - American Indian and Alaska Native
Geographical mobility - Moved from different state (%) - Multirace
Geographical mobility - Moved from different state (%) - Other Race
Geographical mobility - Moved from abroad (%)
Geographical mobility - Moved from abroad (%) - White
Geographical mobility - Moved from abroad (%) - Black or African American
Geographical mobility - Moved from abroad (%) - Asian
Geographical mobility - Moved from abroad (%) - Hispanic or Latino
Geographical mobility - Moved from abroad (%) - American Indian and Alaska Native
Geographical mobility - Moved from abroad (%) - Multirace
Geographical mobility - Moved from abroad (%) - Other Race
Place of birth for the foreign-born population - Ireland (%)
Place of birth for the foreign-born population - Denmark (%)
Place of birth for the foreign-born population - Norway (%)
Place of birth for the foreign-born population - Sweden (%)
Place of birth for the foreign-born population - United Kingdom (%)
Place of birth for the foreign-born population - England (%)
Place of birth for the foreign-born population - Scotland (%)
Place of birth for the foreign-born population - Other Northern Europe (%)
Place of birth for the foreign-born population - Austria (%)
Place of birth for the foreign-born population - Belgium (%)
Place of birth for the foreign-born population - France (%)
Place of birth for the foreign-born population - Germany (%)
Place of birth for the foreign-born population - Netherlands (%)
Place of birth for the foreign-born population - Switzerland (%)
Place of birth for the foreign-born population - Other Western Europe (%)
Place of birth for the foreign-born population - Greece (%)
Place of birth for the foreign-born population - Italy (%)
Place of birth for the foreign-born population - Portugal (%)
Place of birth for the foreign-born population - Spain (%)
Place of birth for the foreign-born population - Other Southern Europe (%)
Place of birth for the foreign-born population - Albania (%)
Place of birth for the foreign-born population - Belarus (%)
Place of birth for the foreign-born population - Bosnia and Herzegovina (%)
Place of birth for the foreign-born population - Bulgaria (%)
Place of birth for the foreign-born population - Croatia (%)
Place of birth for the foreign-born population - Czechoslovakia (%)
Place of birth for the foreign-born population - Hungary (%)
Place of birth for the foreign-born population - Latvia (%)
Place of birth for the foreign-born population - Lithuania (%)
Place of birth for the foreign-born population - North Macedonia (Macedonia) (%)
Place of birth for the foreign-born population - Moldova (%)
Place of birth for the foreign-born population - Poland (%)
Place of birth for the foreign-born population - Romania (%)
Place of birth for the foreign-born population - Russia (%)
Place of birth for the foreign-born population - Serbia (%)
Place of birth for the foreign-born population - Ukraine (%)
Place of birth for the foreign-born population - Other Eastern Europe (%)
Place of birth for the foreign-born population - China (%)
Place of birth for the foreign-born population - Hong Kong (%)
Place of birth for the foreign-born population - Taiwan (%)
Place of birth for the foreign-born population - Japan (%)
Place of birth for the foreign-born population - Korea (%)
Place of birth for the foreign-born population - Other Eastern Asia (%)
Place of birth for the foreign-born population - Afghanistan (%)
Place of birth for the foreign-born population - Bangladesh (%)
Place of birth for the foreign-born population - India (%)
Place of birth for the foreign-born population - Iran (%)
Place of birth for the foreign-born population - Kazakhstan (%)
Place of birth for the foreign-born population - Nepal (%)
Place of birth for the foreign-born population - Pakistan (%)
Place of birth for the foreign-born population - Sri Lanka (%)
Place of birth for the foreign-born population - Uzbekistan (%)
Place of birth for the foreign-born population - Other South Central Asia (%)
Place of birth for the foreign-born population - Burma (%)
Place of birth for the foreign-born population - Cambodia (%)
Place of birth for the foreign-born population - Indonesia (%)
Place of birth for the foreign-born population - Laos (%)
Place of birth for the foreign-born population - Malaysia (%)
Place of birth for the foreign-born population - Philippines (%)
Place of birth for the foreign-born population - Singapore (%)
Place of birth for the foreign-born population - Thailand (%)
Place of birth for the foreign-born population - Vietnam (%)
Place of birth for the foreign-born population - Other South Eastern Asia (%)
Place of birth for the foreign-born population - Armenia (%)
Place of birth for the foreign-born population - Iraq (%)
Place of birth for the foreign-born population - Israel (%)
Place of birth for the foreign-born population - Jordan (%)
Place of birth for the foreign-born population - Kuwait (%)
Place of birth for the foreign-born population - Lebanon (%)
Place of birth for the foreign-born population - Saudi Arabia (%)
Place of birth for the foreign-born population - Syria (%)
Place of birth for the foreign-born population - Turkey (%)
Place of birth for the foreign-born population - Yemen (%)
Place of birth for the foreign-born population - Other Western Asia (%)
Place of birth for the foreign-born population - Eritrea (%)
Place of birth for the foreign-born population - Ethiopia (%)
Place of birth for the foreign-born population - Kenya (%)
Place of birth for the foreign-born population - Somalia (%)
Place of birth for the foreign-born population - Uganda (%)
Place of birth for the foreign-born population - Zimbabwe (%)
Place of birth for the foreign-born population - Other Eastern Africa (%)
Place of birth for the foreign-born population - Cameroon (%)
Place of birth for the foreign-born population - Congo (%)
Place of birth for the foreign-born population - Democratic Republic of Congo (Zaire) (%)
Place of birth for the foreign-born population - Other Middle Africa (%)
Place of birth for the foreign-born population - Egypt (%)
Place of birth for the foreign-born population - Morocco (%)
Place of birth for the foreign-born population - Sudan (%)
Place of birth for the foreign-born population - Other Northern Africa (%)
Place of birth for the foreign-born population - South Africa (%)
Place of birth for the foreign-born population - Other Southern Africa (%)
Place of birth for the foreign-born population - Cabo Verde (%)
Place of birth for the foreign-born population - Ghana (%)
Place of birth for the foreign-born population - Liberia (%)
Place of birth for the foreign-born population - Nigeria (%)
Place of birth for the foreign-born population - Senegal (%)
Place of birth for the foreign-born population - Sierra Leone (%)
Place of birth for the foreign-born population - Other Western Africa (%)
Place of birth for the foreign-born population - Australia (%)
Place of birth for the foreign-born population - New Zealand (%)
Place of birth for the foreign-born population - Fiji (%)
Place of birth for the foreign-born population - Micronesia (%)
Place of birth for the foreign-born population - Bahamas (%)
Place of birth for the foreign-born population - Barbados (%)
Place of birth for the foreign-born population - Cuba (%)
Place of birth for the foreign-born population - Dominica (%)
Place of birth for the foreign-born population - Dominican Republic (%)
Place of birth for the foreign-born population - Grenada (%)
Place of birth for the foreign-born population - Haiti (%)
Place of birth for the foreign-born population - Jamaica (%)
Place of birth for the foreign-born population - St. Vincent and the Grenadines (%)
Place of birth for the foreign-born population - Trinidad and Tobago (%)
Place of birth for the foreign-born population - West Indies (%)
Place of birth for the foreign-born population - Other Caribbean (%)
Place of birth for the foreign-born population - Belize (%)
Place of birth for the foreign-born population - Costa Rica (%)
Place of birth for the foreign-born population - El Salvador (%)
Place of birth for the foreign-born population - Guatemala (%)
Place of birth for the foreign-born population - Honduras (%)
Place of birth for the foreign-born population - Mexico (%)
Place of birth for the foreign-born population - Nicaragua (%)
Place of birth for the foreign-born population - Panama (%)
Place of birth for the foreign-born population - Other Central America (%)
Place of birth for the foreign-born population - Argentina (%)
Place of birth for the foreign-born population - Bolivia (%)
Place of birth for the foreign-born population - Brazil (%)
Place of birth for the foreign-born population - Chile (%)
Place of birth for the foreign-born population - Colombia (%)
Place of birth for the foreign-born population - Ecuador (%)
Place of birth for the foreign-born population - Guyana (%)
Place of birth for the foreign-born population - Peru (%)
Place of birth for the foreign-born population - Uruguay (%)
Place of birth for the foreign-born population - Venezuela (%)
Place of birth for the foreign-born population - Other South America (%)
Place of birth for the foreign-born population - Canada (%)
Place of birth for the foreign-born population - Other Northern America (%)
Place of birth for the foreign-born population - Other (%)
Latest news about races in Chillicothe, OH collected exclusively by city-data.com from local newspapers, TV, and radio stations
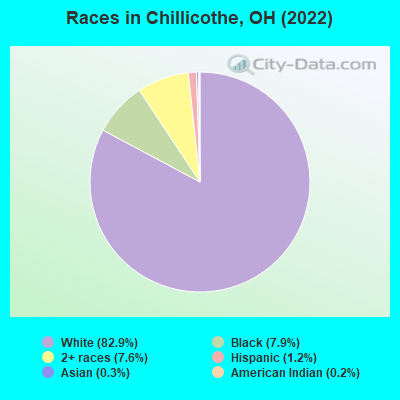
According to 2022 data, the most numerous races in Chillicothe, OH are White alone (18,221 residents), Black alone (1,739 residents), and Two or more races (1,679 residents). 98.1% of Chillicothe residents speak English at home. 0.4% of Chillicothe, OH residents are foreign-born , which is 852.3% less than the foreign-born rate of 4.0% across the entire state of Ohio.
Race distribution in Chillicothe
2000 2022
9,538,111 84.0% White alone 1,290,662 11.4% Black alone 217,123 1.9% Hispanic 137,770 1.2% Two or more races 131,670 1.2% Asian alone 21,985 0.2% American Indian alone 13,483 0.1% Other race alone 2,336 0.02% Native Hawaiian and Other
8,948,793 76.1% White alone 1,401,403 11.9% Black alone 529,291 4.5% Two or more races 517,232 4.4% Hispanic 293,387 2.5% Asian alone 52,805 0.4% Other race alone 9,785 0.08% American Indian alone 3,362 0.03% Native Hawaiian and Other
Income and house value in Chillicothe Median household income in 2022 $51,971 White non-Hispanic householders$48,452 Black householders$35,110 Two or more races householdersMedian 2022 house value $164,832 White Non-Hispanic householders$142,172 Black or African American householders$130,341 American Indian or Alaska Native householders $325,854 Asian householders$157,011 Two or more races householders$315,828 Hispanic or Latino householders
Median age by race in Chillicothe
45.8 Median age for White residents40.9 49.0 42.0 Median age for Black or African American residents40.0 56.5 65.8 Median age for American Indian / Alaska Native residents-665,463,296.6 -662,798,194.1 34.8 Median age for Asian residents26.9 35.3 -800,387,596.1 Median age for Native Hawaiian / Pacific Islander residents-666,666,666.0 -805,394,989.6 -276,371,307.7 Median age for Other race residents-537,313,432.3 -483,448,806.3 17.9 Median age for Two or more races residents29.1 15.9 46.0 Median age for White alone residents41.1 49.3 17.9 Median age for Hispanic or Latino residents17.7 2.1
Owner/renter occupied households by race in Chillicothe
House owners and renters - White residents 5,188 61.8% Owner occupied3,202 38.2% Renter occupiedHouse owners and renters - Black or African American residents 270 42.4% Owner occupied366 57.6% Renter occupiedHouse owners and renters - American Indian / Alaska Native residents 8 33.5% Owner occupied15 66.5% Renter occupiedHouse owners and renters - Asian residents 9 40.7% Owner occupied13 59.3% Renter occupiedHouse owners and renters - Other race residents 15 100.0% Owner occupiedHouse owners and renters - Two or more races residents 200 32.3% Owner occupied419 67.7% Renter occupiedHouse owners and renters - White alone residents 5,186 62.2% Owner occupied3,150 37.8% Renter occupiedHouse owners and renters - Hispanic or Latino residents 16 57.4% Owner occupied12 42.6% Renter occupied
Language usage in Chillicothe
English speakers - Total 98.1% of residents of Chillicothe speak English at home.
0.4% of residents speak Spanish at home 73 80.2% Speak English very well18 19.8% Speak English less than very well1.2% of residents speak other language at home 125 52.5% Speak English very well113 47.5% Speak English less than very well
English speakers - Born in the United States 99.8% of residents of Chillicothe speak English at home.
All residents speak only English at home
English speakers - Foreign-born 59.8% of residents of Chillicothe speak English at home.
37.0% of residents speak other language at home 8 23.5% Speak English very well26 76.5% Speak English less than very well
White (Caucasian) - Speak only English Native:
98.8% (17,028)Foreign-born:
77.3% (29)
White (Caucasian) - Speak another language Native:
1.2% (215)Foreign-born:
28.2% (11)
Asian - Speak only English Native:
78.3% (21)Foreign-born:
40.2% (16)
Asian - Speak another language Native:
23.2% (6)Foreign-born:
57.2% (23)
Two or more races - Speak only English Native:
95.4% (1,437)Foreign-born:
84.8% (8)
White alone - Speak only English Native:
98.6% (16,906)Foreign-born:
71.6% (30)
White alone - Speak another language Native:
1.4% (240)Foreign-born:
29.3% (12)
Foreign-born residents in Chillicothe 92 residents are foreign born
Marital status for residents in Chillicothe Marital status - White (Caucasian) population 15 years and over
Males 33.8% Never married46.4% Now married3.0% Separated3.9% Widowed12.9% DivorcedFemales 23.2% Never married41.3% Now married1.8% Separated12.7% Widowed21.0% DivorcedWomen who gave birth in the past 12 months Now married:
68.2% (158)Unmarried:
31.8% (73)
Women who did not give birth in the past 12 months Now married:
47.6% (1,783)Unmarried:
52.4% (1,965)
Marital status - Black or African American population 15 years and over
Males 48.7% Never married43.8% Now married0.5% Separated0.0% Widowed7.0% DivorcedFemales 35.5% Never married26.1% Now married1.5% Separated6.4% Widowed30.6% DivorcedWomen who did not give birth in the past 12 months Now married:
26.5% (106)Unmarried:
73.5% (296)
Marital status - American Indian / Alaska Native population 15 years and over
Males 0.0% Never married100.0% Now married0.0% Separated0.0% Widowed0.0% DivorcedFemales 0.0% Never married8.3% Now married0.0% Separated91.7% Widowed0.0% DivorcedWomen who did not give birth in the past 12 months Now married:
100.0% (1)Unmarried:
0.0% (0)
Marital status - Asian population 15 years and over
Males 100.0% Never married0.0% Now married0.0% Separated0.0% Widowed0.0% DivorcedFemales 29.0% Never married71.0% Now married0.0% Separated0.0% Widowed0.0% DivorcedWomen who did not give birth in the past 12 months Now married:
71.0% (22)Unmarried:
29.0% (9)
Marital status - Two or more races population 15 years and over
Males 50.4% Never married45.1% Now married0.0% Separated0.0% Widowed4.5% DivorcedFemales 18.3% Never married30.1% Now married6.5% Separated14.1% Widowed31.0% DivorcedWomen who did not give birth in the past 12 months Now married:
30.7% (56)Unmarried:
69.3% (127)
Marital status - White alone, not Hispanic / Latino population 15 years and over
Males 33.9% Never married46.1% Now married3.0% Separated4.0% Widowed13.0% DivorcedFemales 23.1% Never married41.3% Now married1.9% Separated12.8% Widowed21.0% DivorcedWomen who gave birth in the past 12 months Now married:
66.5% (146)Unmarried:
33.5% (73)
Women who did not give birth in the past 12 months Now married:
47.7% (1,773)Unmarried:
52.3% (1,945)
Marital status - Hispanic or Latino population 15 years and over
Males 32.5% Never married67.5% Now married0.0% Separated0.0% Widowed0.0% DivorcedFemales 42.6% Never married38.3% Now married0.0% Separated0.0% Widowed19.1% DivorcedWomen who gave birth in the past 12 months Now married:
100.0% (13)Unmarried:
0.0% (0)
Women who did not give birth in the past 12 months Now married:
23.1% (6)Unmarried:
76.9% (21)
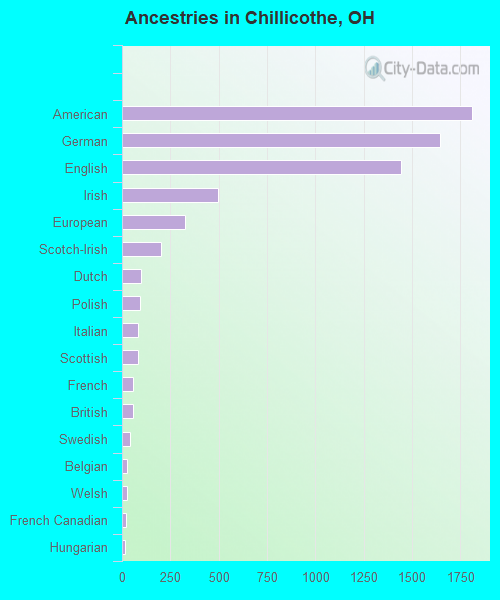
Ancestries in Chillicothe
1,809 20.3% American1,648 18.5% German1,446 16.2% English497 5.6% Irish326 3.7% European203 2.3% Scotch-Irish97 1.1% Dutch95 1.1% Polish85 1.0% Italian82 0.9% Scottish59 0.7% French55 0.6% British40 0.4% Swedish27 0.3% Belgian25 0.3% Welsh21 0.2% French Canadian18 0.2% Hungarian15 0.2% Czech15 0.2% Turkish9 0.1% Lebanese9 0.1% Greek8 0.09% Yugoslavian6 0.07% Norwegian4 0.04% Iranian
Geographical mobility in Chillicothe Same house 1 year ago 15,715 87.1% White (Caucasian)1,382 75.7% Black or African American41 100.0% American Indian / Alaska Native47 70.2% Asian13 100.0% Native Hawaiian / Pacific Islander13 98.6% Other race1,527 86.5% Two or more races15,538 87.1% White alone, not Hispanic / Latino215 83.0% Hispanic or LatinoMoved within same county 1,346 7.5% White / Caucasian329 18.0% Black or African American20 29.4% Asian146 8.3% Two or more races1,346 7.6% White alone, not Hispanic / Latino15 5.7% Hispanic or LatinoMoved within same state 716 4.0% White / Caucasian11 0.6% Black or African American69 3.9% Two or more races689 3.9% White alone, not Hispanic / Latino34 13.0% Hispanic or LatinoMoved from different state 230 1.3% White / Caucasian22 1.2% Black or African American14 0.8% Two or more races230 1.3% White alone, not Hispanic / LatinoMoved from abroad 11 0.1% White5 0.3% Black or African American11 0.1% White alone, not Hispanic / Latino
Children Nativity (place of birth) in Chillicothe
Children under 6 years - Living with two parents Both parents native 730 100.0% NativeChildren under 6 years - Living with one parent Native parent 702 100.0% NativeChildren 6 to 17 years - Living with two parents Both parents native 1,566 100.0% NativeOne native, one foreign-born parent 21 100.0% NativeChildren 6 to 17 years - Living with one parent Native parent 1,058 100.0% NativeForeign-born parent 12 50.4% Native12 49.6% Foreign-born
Grandparents responsible for own grandchildren in Chillicothe
Grandparents (30 to 59 years) White / Caucasian 36 32.5% Responsible for grandchildren74 67.5% Not responsible for grandchildrenBlack or African American 44 100.0% Not responsible for grandchildrenWhite alone, not Hispanic / Latino 36 32.0% Responsible for grandchildren76 68.0% Not responsible for grandchildrenGrandparents (60 years and over) White / Caucasian 63 58.6% Responsible for grandchildren45 41.4% Not responsible for grandchildrenBlack or African American 6 34.7% Responsible for grandchildren11 65.3% Not responsible for grandchildrenWhite alone, not Hispanic / Latino 63 58.4% Responsible for grandchildren45 41.6% Not responsible for grandchildren