Races in Citrus, California (CA) Detailed Stats
Data:
Races - White alone (%)
Races - White alone (% change since 2000)
Races - Black alone (%)
Races - Black alone (% change since 2000)
Races - American Indian alone (%)
Races - American Indian alone (% change since 2000)
Races - Asian alone (%)
Races - Asian alone (% change since 2000)
Races - Hispanic (%)
Races - Hispanic (% change since 2000)
Races - Native Hawaiian and Other Pacific Islander alone (%)
Races - Native Hawaiian and Other Pacific Islander alone (% change since 2000)
Races - Two or more races(%)
Races - Two or more races(% change since 2000)
Races - Other race alone (%)
Races - Other race alone (% change since 2000)
Racial diversity
Place of birth - Born in state of residence (%)
Place of birth - Born in state of residence (%) - White
Place of birth - Born in state of residence (%) - Black or African American
Place of birth - Born in state of residence (%) - Asian
Place of birth - Born in state of residence (%) - Hispanic or Latino
Place of birth - Born in state of residence (%) - American Indian and Alaska Native
Place of birth - Born in state of residence (%) - Multirace
Place of birth - Born in state of residence (%) - Other Race
Place of birth - Born in other state (%)
Place of birth - Born in other state (%) - White
Place of birth - Born in other state (%) - Black or African American
Place of birth - Born in other state (%) - Asian
Place of birth - Born in other state (%) - Hispanic or Latino
Place of birth - Born in other state (%) - American Indian and Alaska Native
Place of birth - Born in other state (%) - Multirace
Place of birth - Born in other state (%) - Other Race
Place of birth - Native, outside of US (%)
Place of birth - Native, outside of US (%) - White
Place of birth - Native, outside of US (%) - Black or African American
Place of birth - Native, outside of US (%) - Asian
Place of birth - Native, outside of US (%) - Hispanic or Latino
Place of birth - Native, outside of US (%) - American Indian and Alaska Native
Place of birth - Native, outside of US (%) - Multirace
Place of birth - Native, outside of US (%) - Other Race
Place of birth - Foreign born (%)
Place of birth - Foreign born (%) - White
Place of birth - Foreign born (%) - Black or African American
Place of birth - Foreign born (%) - Asian
Place of birth - Foreign born (%) - Hispanic or Latino
Place of birth - Foreign born (%) - American Indian and Alaska Native
Place of birth - Foreign born (%) - Multirace
Place of birth - Foreign born (%) - Other Race
Residents speaking English at home (%)
Residents speaking English at home - Born in the United States (%)
Residents speaking English at home - Native, born elsewhere (%)
Residents speaking English at home - Foreign born (%)
Residents speaking Spanish at home (%)
Residents speaking Spanish at home - Born in the United States (%)
Residents speaking Spanish at home - Native, born elsewhere (%)
Residents speaking Spanish at home - Foreign born (%)
Residents speaking other language at home (%)
Residents speaking other language at home - Born in the United States (%)
Residents speaking other language at home - Native, born elsewhere (%)
Residents speaking other language at home - Foreign born (%)
Marital status - Never married (%)
Marital status - Now married (%)
Marital status - Separated (%)
Marital status - Widowed (%)
Marital status - Divorced (%)
Ancestries Reported - Arab (%)
Ancestries Reported - Czech (%)
Ancestries Reported - Danish (%)
Ancestries Reported - Dutch (%)
Ancestries Reported - English (%)
Ancestries Reported - French (%)
Ancestries Reported - French Canadian (%)
Ancestries Reported - German (%)
Ancestries Reported - Greek (%)
Ancestries Reported - Hungarian (%)
Ancestries Reported - Irish (%)
Ancestries Reported - Italian (%)
Ancestries Reported - Lithuanian (%)
Ancestries Reported - Norwegian (%)
Ancestries Reported - Polish (%)
Ancestries Reported - Portuguese (%)
Ancestries Reported - Russian (%)
Ancestries Reported - Scotch-Irish (%)
Ancestries Reported - Scottish (%)
Ancestries Reported - Slovak (%)
Ancestries Reported - Subsaharan African (%)
Ancestries Reported - Swedish (%)
Ancestries Reported - Swiss (%)
Ancestries Reported - Ukrainian (%)
Ancestries Reported - United States (%)
Ancestries Reported - Welsh (%)
Ancestries Reported - West Indian (%)
Ancestries Reported - Other (%)
Geographical mobility - Same house 1 year ago (%)
Geographical mobility - Same house 1 year ago (%) - White
Geographical mobility - Same house 1 year ago (%) - Black or African American
Geographical mobility - Same house 1 year ago (%) - Asian
Geographical mobility - Same house 1 year ago (%) - Hispanic or Latino
Geographical mobility - Same house 1 year ago (%) - American Indian and Alaska Native
Geographical mobility - Same house 1 year ago (%) - Multirace
Geographical mobility - Same house 1 year ago (%) - Other Race
Geographical mobility - Moved within same county (%)
Geographical mobility - Moved within same county (%) - White
Geographical mobility - Moved within same county (%) - Black or African American
Geographical mobility - Moved within same county (%) - Asian
Geographical mobility - Moved within same county (%) - Hispanic or Latino
Geographical mobility - Moved within same county (%) - American Indian and Alaska Native
Geographical mobility - Moved within same county (%) - Multirace
Geographical mobility - Moved within same county (%) - Other Race
Geographical mobility - Moved from different county within same state (%)
Geographical mobility - Moved from different county within same state (%) - White
Geographical mobility - Moved from different county within same state (%) - Black or African American
Geographical mobility - Moved from different county within same state (%) - Asian
Geographical mobility - Moved from different county within same state (%) - Hispanic or Latino
Geographical mobility - Moved from different county within same state (%) - American Indian and Alaska Native
Geographical mobility - Moved from different county within same state (%) - Multirace
Geographical mobility - Moved from different county within same state (%) - Other Race
Geographical mobility - Moved from different state (%)
Geographical mobility - Moved from different state (%) - White
Geographical mobility - Moved from different state (%) - Black or African American
Geographical mobility - Moved from different state (%) - Asian
Geographical mobility - Moved from different state (%) - Hispanic or Latino
Geographical mobility - Moved from different state (%) - American Indian and Alaska Native
Geographical mobility - Moved from different state (%) - Multirace
Geographical mobility - Moved from different state (%) - Other Race
Geographical mobility - Moved from abroad (%)
Geographical mobility - Moved from abroad (%) - White
Geographical mobility - Moved from abroad (%) - Black or African American
Geographical mobility - Moved from abroad (%) - Asian
Geographical mobility - Moved from abroad (%) - Hispanic or Latino
Geographical mobility - Moved from abroad (%) - American Indian and Alaska Native
Geographical mobility - Moved from abroad (%) - Multirace
Geographical mobility - Moved from abroad (%) - Other Race
Place of birth for the foreign-born population - Ireland (%)
Place of birth for the foreign-born population - Denmark (%)
Place of birth for the foreign-born population - Norway (%)
Place of birth for the foreign-born population - Sweden (%)
Place of birth for the foreign-born population - United Kingdom (%)
Place of birth for the foreign-born population - England (%)
Place of birth for the foreign-born population - Scotland (%)
Place of birth for the foreign-born population - Other Northern Europe (%)
Place of birth for the foreign-born population - Austria (%)
Place of birth for the foreign-born population - Belgium (%)
Place of birth for the foreign-born population - France (%)
Place of birth for the foreign-born population - Germany (%)
Place of birth for the foreign-born population - Netherlands (%)
Place of birth for the foreign-born population - Switzerland (%)
Place of birth for the foreign-born population - Other Western Europe (%)
Place of birth for the foreign-born population - Greece (%)
Place of birth for the foreign-born population - Italy (%)
Place of birth for the foreign-born population - Portugal (%)
Place of birth for the foreign-born population - Spain (%)
Place of birth for the foreign-born population - Other Southern Europe (%)
Place of birth for the foreign-born population - Albania (%)
Place of birth for the foreign-born population - Belarus (%)
Place of birth for the foreign-born population - Bosnia and Herzegovina (%)
Place of birth for the foreign-born population - Bulgaria (%)
Place of birth for the foreign-born population - Croatia (%)
Place of birth for the foreign-born population - Czechoslovakia (%)
Place of birth for the foreign-born population - Hungary (%)
Place of birth for the foreign-born population - Latvia (%)
Place of birth for the foreign-born population - Lithuania (%)
Place of birth for the foreign-born population - North Macedonia (Macedonia) (%)
Place of birth for the foreign-born population - Moldova (%)
Place of birth for the foreign-born population - Poland (%)
Place of birth for the foreign-born population - Romania (%)
Place of birth for the foreign-born population - Russia (%)
Place of birth for the foreign-born population - Serbia (%)
Place of birth for the foreign-born population - Ukraine (%)
Place of birth for the foreign-born population - Other Eastern Europe (%)
Place of birth for the foreign-born population - China (%)
Place of birth for the foreign-born population - Hong Kong (%)
Place of birth for the foreign-born population - Taiwan (%)
Place of birth for the foreign-born population - Japan (%)
Place of birth for the foreign-born population - Korea (%)
Place of birth for the foreign-born population - Other Eastern Asia (%)
Place of birth for the foreign-born population - Afghanistan (%)
Place of birth for the foreign-born population - Bangladesh (%)
Place of birth for the foreign-born population - India (%)
Place of birth for the foreign-born population - Iran (%)
Place of birth for the foreign-born population - Kazakhstan (%)
Place of birth for the foreign-born population - Nepal (%)
Place of birth for the foreign-born population - Pakistan (%)
Place of birth for the foreign-born population - Sri Lanka (%)
Place of birth for the foreign-born population - Uzbekistan (%)
Place of birth for the foreign-born population - Other South Central Asia (%)
Place of birth for the foreign-born population - Burma (%)
Place of birth for the foreign-born population - Cambodia (%)
Place of birth for the foreign-born population - Indonesia (%)
Place of birth for the foreign-born population - Laos (%)
Place of birth for the foreign-born population - Malaysia (%)
Place of birth for the foreign-born population - Philippines (%)
Place of birth for the foreign-born population - Singapore (%)
Place of birth for the foreign-born population - Thailand (%)
Place of birth for the foreign-born population - Vietnam (%)
Place of birth for the foreign-born population - Other South Eastern Asia (%)
Place of birth for the foreign-born population - Armenia (%)
Place of birth for the foreign-born population - Iraq (%)
Place of birth for the foreign-born population - Israel (%)
Place of birth for the foreign-born population - Jordan (%)
Place of birth for the foreign-born population - Kuwait (%)
Place of birth for the foreign-born population - Lebanon (%)
Place of birth for the foreign-born population - Saudi Arabia (%)
Place of birth for the foreign-born population - Syria (%)
Place of birth for the foreign-born population - Turkey (%)
Place of birth for the foreign-born population - Yemen (%)
Place of birth for the foreign-born population - Other Western Asia (%)
Place of birth for the foreign-born population - Eritrea (%)
Place of birth for the foreign-born population - Ethiopia (%)
Place of birth for the foreign-born population - Kenya (%)
Place of birth for the foreign-born population - Somalia (%)
Place of birth for the foreign-born population - Uganda (%)
Place of birth for the foreign-born population - Zimbabwe (%)
Place of birth for the foreign-born population - Other Eastern Africa (%)
Place of birth for the foreign-born population - Cameroon (%)
Place of birth for the foreign-born population - Congo (%)
Place of birth for the foreign-born population - Democratic Republic of Congo (Zaire) (%)
Place of birth for the foreign-born population - Other Middle Africa (%)
Place of birth for the foreign-born population - Egypt (%)
Place of birth for the foreign-born population - Morocco (%)
Place of birth for the foreign-born population - Sudan (%)
Place of birth for the foreign-born population - Other Northern Africa (%)
Place of birth for the foreign-born population - South Africa (%)
Place of birth for the foreign-born population - Other Southern Africa (%)
Place of birth for the foreign-born population - Cabo Verde (%)
Place of birth for the foreign-born population - Ghana (%)
Place of birth for the foreign-born population - Liberia (%)
Place of birth for the foreign-born population - Nigeria (%)
Place of birth for the foreign-born population - Senegal (%)
Place of birth for the foreign-born population - Sierra Leone (%)
Place of birth for the foreign-born population - Other Western Africa (%)
Place of birth for the foreign-born population - Australia (%)
Place of birth for the foreign-born population - New Zealand (%)
Place of birth for the foreign-born population - Fiji (%)
Place of birth for the foreign-born population - Micronesia (%)
Place of birth for the foreign-born population - Bahamas (%)
Place of birth for the foreign-born population - Barbados (%)
Place of birth for the foreign-born population - Cuba (%)
Place of birth for the foreign-born population - Dominica (%)
Place of birth for the foreign-born population - Dominican Republic (%)
Place of birth for the foreign-born population - Grenada (%)
Place of birth for the foreign-born population - Haiti (%)
Place of birth for the foreign-born population - Jamaica (%)
Place of birth for the foreign-born population - St. Vincent and the Grenadines (%)
Place of birth for the foreign-born population - Trinidad and Tobago (%)
Place of birth for the foreign-born population - West Indies (%)
Place of birth for the foreign-born population - Other Caribbean (%)
Place of birth for the foreign-born population - Belize (%)
Place of birth for the foreign-born population - Costa Rica (%)
Place of birth for the foreign-born population - El Salvador (%)
Place of birth for the foreign-born population - Guatemala (%)
Place of birth for the foreign-born population - Honduras (%)
Place of birth for the foreign-born population - Mexico (%)
Place of birth for the foreign-born population - Nicaragua (%)
Place of birth for the foreign-born population - Panama (%)
Place of birth for the foreign-born population - Other Central America (%)
Place of birth for the foreign-born population - Argentina (%)
Place of birth for the foreign-born population - Bolivia (%)
Place of birth for the foreign-born population - Brazil (%)
Place of birth for the foreign-born population - Chile (%)
Place of birth for the foreign-born population - Colombia (%)
Place of birth for the foreign-born population - Ecuador (%)
Place of birth for the foreign-born population - Guyana (%)
Place of birth for the foreign-born population - Peru (%)
Place of birth for the foreign-born population - Uruguay (%)
Place of birth for the foreign-born population - Venezuela (%)
Place of birth for the foreign-born population - Other South America (%)
Place of birth for the foreign-born population - Canada (%)
Place of birth for the foreign-born population - Other Northern America (%)
Place of birth for the foreign-born population - Other (%)
Latest news about races in Citrus, CA collected exclusively by city-data.com from local newspapers, TV, and radio stations
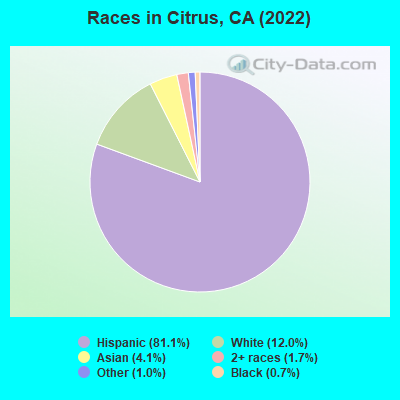
According to 2022 data, the most numerous races in Citrus, CA are Hispanic (7,915 residents), White alone (1,317 residents), and Asian alone (772 residents). 37.2% of Citrus residents speak English at home. 32.1% of Citrus, CA residents are foreign-born (25.0% born in Latin America, 6.2% born in Asia), which is 19.0% greater than the foreign-born rate of 26.0% across the entire state of California.
Race distribution in Citrus
2000 2022
15,816,790 46.7% White alone 10,966,556 32.4% Hispanic 3,648,860 10.8% Asian alone 2,181,926 6.4% Black alone 903,115 2.7% Two or more races 178,984 0.5% American Indian alone 103,736 0.3% Native Hawaiian and Other 71,681 0.2% Other race alone
15,732,184 40.3% Hispanic 13,160,426 33.7% White alone 5,957,867 15.3% Asian alone 2,025,218 5.2% Black alone 1,663,222 4.3% Two or more races 251,618 0.6% Other race alone 135,777 0.3% Native Hawaiian and Other 103,030 0.3% American Indian alone
Income and house value in Citrus Median household income in 2022 $75,239 White non-Hispanic householders$62,493 Black householders$195,092 American Indian and Alaska Native householders$146,630 Asian householders$119,249 Some other race householders$57,874 Two or more races householders$114,658 Hispanic or Latino race householdersMedian 2022 house value $553,571 White Non-Hispanic householders$371,807 Black or African American householders$532,695 American Indian or Alaska Native householders $567,968 Asian householders$543,493 Some other race householders$604,321 Two or more races householders$539,174 Hispanic or Latino householders
Median age by race in Citrus
42.3 Median age for White residents43.6 40.8 26.9 Median age for Black or African American residents35.8 2.4 31.9 Median age for American Indian / Alaska Native residents43.9 Median age for Asian residents44.6 38.8 31.4 Median age for Other race residents30.0 32.9 40.5 Median age for Two or more races residents40.0 54.8 53.7 Median age for White alone residents50.9 56.5 33.3 Median age for Hispanic or Latino residents34.3 32.4
Owner/renter occupied households by race in Citrus
House owners and renters - White residents 959 73.3% Owner occupied349 26.7% Renter occupiedHouse owners and renters - Black or African American residents 17 100.0% Owner occupiedHouse owners and renters - American Indian / Alaska Native residents 27 43.9% Owner occupied35 56.1% Renter occupiedHouse owners and renters - Asian residents 196 77.3% Owner occupied58 22.7% Renter occupiedHouse owners and renters - Other race residents 362 57.5% Owner occupied268 42.5% Renter occupiedHouse owners and renters - Two or more races residents 465 91.7% Owner occupied42 8.3% Renter occupiedHouse owners and renters - White alone residents 360 69.7% Owner occupied156 30.3% Renter occupiedHouse owners and renters - Hispanic or Latino residents 1,232 69.2% Owner occupied548 30.8% Renter occupied
Language usage in Citrus
English speakers - Total 37.2% of residents of Citrus speak English at home.
54.0% of residents speak Spanish at home 3,586 69.3% Speak English very well1,589 30.7% Speak English less than very well8.4% of residents speak other language at home 538 67.3% Speak English very well262 32.8% Speak English less than very well
English speakers - Born in the United States 74.8% of residents of Citrus speak English at home.
18.9% of residents speak Spanish at home 99 87.6% Speak English very well14 12.4% Speak English less than very well6.5% of residents speak other language at home 39 100.0% Speak English very well
English speakers - Native, born elsewhere 42.7% of residents of Citrus speak English at home.
51.7% of residents speak Spanish at home 74 100.0% Speak English very well5.6% of residents speak other language at home 8 100.0% Speak English very well
English speakers - Foreign-born 7.8% of residents of Citrus speak English at home.
70.9% of residents speak Spanish at home 889 39.4% Speak English very well1,366 60.6% Speak English less than very well19.9% of residents speak other language at home 386 61.1% Speak English very well246 38.9% Speak English less than very well
White (Caucasian) - Speak only English Native:
60.9% (2,156)Foreign-born:
8.5% (64)
White (Caucasian) - Speak another language Native:
32.5% (1,151)Foreign-born:
88.7% (670)
American Indian / Alaska Native - Speak another language Native:
40.5% (71)Foreign-born:
99.6% (27)
Asian - Speak only English Native:
54.1% (111)Foreign-born:
4.3% (25)
Asian - Speak another language Native:
45.7% (93)Foreign-born:
95.0% (548)
Other race - Speak only English Native:
37.9% (635)Foreign-born:
13.1% (183)
Other race - Speak another language Native:
63.1% (1,058)Foreign-born:
88.9% (1,246)
Two or more races - Speak another language Native:
100.0% (993)Foreign-born:
100.0% (791)
White alone - Speak only English Native:
91.1% (1,109)Foreign-born:
28.9% (21)
White alone - Speak another language Native:
9.0% (110)Foreign-born:
70.9% (51)
Hispanic or Latino - Speak only English Native:
43.2% (2,210)Foreign-born:
9.0% (218)
Hispanic or Latino - Speak another language Native:
57.0% (2,918)Foreign-born:
91.7% (2,205)
Foreign-born residents in Citrus 3,252 residents are foreign born (25.0% Latin America , 6.2% Asia ).
This city:
32.1%California:
100.0%
Marital status for residents in Citrus Marital status - White (Caucasian) population 15 years and over
Males 43.2% Never married43.7% Now married0.7% Separated2.3% Widowed10.2% DivorcedFemales 40.4% Never married35.0% Now married3.4% Separated13.7% Widowed7.5% DivorcedWomen who gave birth in the past 12 months Now married:
34.4% (9)Unmarried:
65.6% (16)
Women who did not give birth in the past 12 months Now married:
30.2% (314)Unmarried:
69.8% (727)
Marital status - Black or African American population 15 years and over
Males 10.7% Never married53.6% Now married0.0% Separated17.9% Widowed17.9% DivorcedFemales 43.8% Never married56.3% Now married0.0% Separated0.0% Widowed0.0% DivorcedWomen who did not give birth in the past 12 months Now married:
0.0% (0)Unmarried:
100.0% (6)
Marital status - American Indian / Alaska Native population 15 years and over
Males 0.0% Never married17.2% Now married0.0% Separated82.8% Widowed0.0% DivorcedFemales 51.1% Never married0.0% Now married34.4% Separated14.4% Widowed0.0% DivorcedWomen who did not give birth in the past 12 months Now married:
40.3% (45)Unmarried:
59.7% (67)
Marital status - Asian population 15 years and over
Males 20.8% Never married65.1% Now married0.0% Separated14.1% Widowed0.0% DivorcedFemales 32.6% Never married52.5% Now married2.5% Separated2.5% Widowed9.9% DivorcedWomen who gave birth in the past 12 months Now married:
0.0% (0)Unmarried:
100.0% (8)
Women who did not give birth in the past 12 months Now married:
45.3% (90)Unmarried:
54.7% (109)
Marital status - Other race population 15 years and over
Males 56.7% Never married36.4% Now married0.9% Separated1.3% Widowed4.7% DivorcedFemales 53.6% Never married33.1% Now married7.4% Separated1.7% Widowed4.2% DivorcedWomen who gave birth in the past 12 months Now married:
44.8% (42)Unmarried:
55.2% (52)
Women who did not give birth in the past 12 months Now married:
35.3% (292)Unmarried:
64.7% (535)
Marital status - Two or more races population 15 years and over
Males 70.8% Never married18.9% Now married0.0% Separated0.0% Widowed10.3% DivorcedFemales 29.6% Never married42.2% Now married0.0% Separated28.1% Widowed0.0% DivorcedWomen who did not give birth in the past 12 months Now married:
60.5% (144)Unmarried:
39.5% (94)
Marital status - White alone, not Hispanic / Latino population 15 years and over
Males 33.0% Never married48.0% Now married1.1% Separated3.4% Widowed14.5% DivorcedFemales 24.9% Never married37.6% Now married3.1% Separated24.9% Widowed9.5% DivorcedWomen who gave birth in the past 12 months Now married:
100.0% (10)Unmarried:
0.0% (0)
Women who did not give birth in the past 12 months Now married:
38.1% (67)Unmarried:
61.9% (109)
Marital status - Hispanic or Latino population 15 years and over
Males 52.9% Never married37.8% Now married0.6% Separated2.3% Widowed6.4% DivorcedFemales 49.1% Never married32.6% Now married5.7% Separated7.3% Widowed5.3% DivorcedWomen who gave birth in the past 12 months Now married:
36.1% (39)Unmarried:
63.9% (69)
Women who did not give birth in the past 12 months Now married:
32.2% (672)Unmarried:
67.8% (1,414)
Ancestries in Citrus
102 1.5% English101 1.5% American86 1.3% Italian80 1.2% German59 0.9% Irish28 0.4% Polish26 0.4% Iranian23 0.3% British West Indian22 0.3% European21 0.3% Armenian9 0.1% Scotch-Irish7 0.1% French Canadian5 0.07% Hungarian4 0.06% Canadian3 0.04% Scottish
Geographical mobility in Citrus Same house 1 year ago 4,334 95.6% White (Caucasian)84 90.7% Black or African American264 100.0% American Indian / Alaska Native711 87.6% Asian27 100.0% Native Hawaiian / Pacific Islander3,092 96.8% Other race1,583 100.0% Two or more races1,244 92.8% White alone, not Hispanic / Latino7,602 96.8% Hispanic or LatinoMoved within same county 137 3.0% White / Caucasian5 0.7% Asian135 4.2% Other race41 3.1% White alone, not Hispanic / Latino256 3.3% Hispanic or LatinoMoved within same state 39 0.9% White / Caucasian11 11.4% Black or African American28 3.4% Asian33 2.5% White alone, not Hispanic / Latino17 0.2% Hispanic or LatinoMoved from different state 36 0.8% White / Caucasian70 8.7% Asian22 1.6% White alone, not Hispanic / Latino18 0.2% Hispanic or LatinoMoved from abroad 19 0.4% White8 0.6% White alone, not Hispanic / Latino19 0.2% Hispanic or Latino
Children Nativity (place of birth) in Citrus
Children under 6 years - Living with two parents Both parents native 143 100.0% NativeBoth parents foreign-born 90 100.0% NativeOne native, one foreign-born parent 64 100.0% NativeChildren under 6 years - Living with one parent Native parent 339 99.9% Native0 0.1% Foreign-bornForeign-born parent 40 78.9% Native11 21.1% Foreign-bornChildren 6 to 17 years - Living with two parents Both parents native 270 100.0% NativeBoth parents foreign-born 419 96.1% Native17 3.9% Foreign-bornOne native, one foreign-born parent 75 92.8% Native6 7.2% Foreign-bornChildren 6 to 17 years - Living with one parent Native parent 340 100.0% NativeForeign-born parent 215 59.4% Native147 40.6% Foreign-born
Grandparents responsible for own grandchildren in Citrus
Grandparents (30 to 59 years) White / Caucasian 13 15.7% Responsible for grandchildren69 84.3% Not responsible for grandchildrenBlack or African American 17 100.0% Not responsible for grandchildrenAmerican Indian / Alaska Native 33 100.0% Not responsible for grandchildrenAsian 20 100.0% Not responsible for grandchildrenOther race 70 100.0% Not responsible for grandchildrenTwo or more races 17 100.0% Responsible for grandchildrenWhite alone, not Hispanic / Latino 6 100.0% Not responsible for grandchildrenHispanic or Latino 26 12.7% Responsible for grandchildren182 87.3% Not responsible for grandchildrenGrandparents (60 years and over) White / Caucasian 84 100.0% Not responsible for grandchildrenAsian 33 100.0% Not responsible for grandchildrenOther race 18 29.8% Responsible for grandchildren43 70.2% Not responsible for grandchildrenTwo or more races 196 100.0% Not responsible for grandchildrenWhite alone, not Hispanic / Latino 21 100.0% Not responsible for grandchildrenHispanic or Latino 16 8.9% Responsible for grandchildren162 91.1% Not responsible for grandchildren