Races in Citrus Springs, Florida (FL) Detailed Stats
Data:
Races - White alone (%)
Races - White alone (% change since 2000)
Races - Black alone (%)
Races - Black alone (% change since 2000)
Races - American Indian alone (%)
Races - American Indian alone (% change since 2000)
Races - Asian alone (%)
Races - Asian alone (% change since 2000)
Races - Hispanic (%)
Races - Hispanic (% change since 2000)
Races - Native Hawaiian and Other Pacific Islander alone (%)
Races - Native Hawaiian and Other Pacific Islander alone (% change since 2000)
Races - Two or more races(%)
Races - Two or more races(% change since 2000)
Races - Other race alone (%)
Races - Other race alone (% change since 2000)
Racial diversity
Place of birth - Born in state of residence (%)
Place of birth - Born in state of residence (%) - White
Place of birth - Born in state of residence (%) - Black or African American
Place of birth - Born in state of residence (%) - Asian
Place of birth - Born in state of residence (%) - Hispanic or Latino
Place of birth - Born in state of residence (%) - American Indian and Alaska Native
Place of birth - Born in state of residence (%) - Multirace
Place of birth - Born in state of residence (%) - Other Race
Place of birth - Born in other state (%)
Place of birth - Born in other state (%) - White
Place of birth - Born in other state (%) - Black or African American
Place of birth - Born in other state (%) - Asian
Place of birth - Born in other state (%) - Hispanic or Latino
Place of birth - Born in other state (%) - American Indian and Alaska Native
Place of birth - Born in other state (%) - Multirace
Place of birth - Born in other state (%) - Other Race
Place of birth - Native, outside of US (%)
Place of birth - Native, outside of US (%) - White
Place of birth - Native, outside of US (%) - Black or African American
Place of birth - Native, outside of US (%) - Asian
Place of birth - Native, outside of US (%) - Hispanic or Latino
Place of birth - Native, outside of US (%) - American Indian and Alaska Native
Place of birth - Native, outside of US (%) - Multirace
Place of birth - Native, outside of US (%) - Other Race
Place of birth - Foreign born (%)
Place of birth - Foreign born (%) - White
Place of birth - Foreign born (%) - Black or African American
Place of birth - Foreign born (%) - Asian
Place of birth - Foreign born (%) - Hispanic or Latino
Place of birth - Foreign born (%) - American Indian and Alaska Native
Place of birth - Foreign born (%) - Multirace
Place of birth - Foreign born (%) - Other Race
Residents speaking English at home (%)
Residents speaking English at home - Born in the United States (%)
Residents speaking English at home - Native, born elsewhere (%)
Residents speaking English at home - Foreign born (%)
Residents speaking Spanish at home (%)
Residents speaking Spanish at home - Born in the United States (%)
Residents speaking Spanish at home - Native, born elsewhere (%)
Residents speaking Spanish at home - Foreign born (%)
Residents speaking other language at home (%)
Residents speaking other language at home - Born in the United States (%)
Residents speaking other language at home - Native, born elsewhere (%)
Residents speaking other language at home - Foreign born (%)
Marital status - Never married (%)
Marital status - Now married (%)
Marital status - Separated (%)
Marital status - Widowed (%)
Marital status - Divorced (%)
Ancestries Reported - Arab (%)
Ancestries Reported - Czech (%)
Ancestries Reported - Danish (%)
Ancestries Reported - Dutch (%)
Ancestries Reported - English (%)
Ancestries Reported - French (%)
Ancestries Reported - French Canadian (%)
Ancestries Reported - German (%)
Ancestries Reported - Greek (%)
Ancestries Reported - Hungarian (%)
Ancestries Reported - Irish (%)
Ancestries Reported - Italian (%)
Ancestries Reported - Lithuanian (%)
Ancestries Reported - Norwegian (%)
Ancestries Reported - Polish (%)
Ancestries Reported - Portuguese (%)
Ancestries Reported - Russian (%)
Ancestries Reported - Scotch-Irish (%)
Ancestries Reported - Scottish (%)
Ancestries Reported - Slovak (%)
Ancestries Reported - Subsaharan African (%)
Ancestries Reported - Swedish (%)
Ancestries Reported - Swiss (%)
Ancestries Reported - Ukrainian (%)
Ancestries Reported - United States (%)
Ancestries Reported - Welsh (%)
Ancestries Reported - West Indian (%)
Ancestries Reported - Other (%)
Geographical mobility - Same house 1 year ago (%)
Geographical mobility - Same house 1 year ago (%) - White
Geographical mobility - Same house 1 year ago (%) - Black or African American
Geographical mobility - Same house 1 year ago (%) - Asian
Geographical mobility - Same house 1 year ago (%) - Hispanic or Latino
Geographical mobility - Same house 1 year ago (%) - American Indian and Alaska Native
Geographical mobility - Same house 1 year ago (%) - Multirace
Geographical mobility - Same house 1 year ago (%) - Other Race
Geographical mobility - Moved within same county (%)
Geographical mobility - Moved within same county (%) - White
Geographical mobility - Moved within same county (%) - Black or African American
Geographical mobility - Moved within same county (%) - Asian
Geographical mobility - Moved within same county (%) - Hispanic or Latino
Geographical mobility - Moved within same county (%) - American Indian and Alaska Native
Geographical mobility - Moved within same county (%) - Multirace
Geographical mobility - Moved within same county (%) - Other Race
Geographical mobility - Moved from different county within same state (%)
Geographical mobility - Moved from different county within same state (%) - White
Geographical mobility - Moved from different county within same state (%) - Black or African American
Geographical mobility - Moved from different county within same state (%) - Asian
Geographical mobility - Moved from different county within same state (%) - Hispanic or Latino
Geographical mobility - Moved from different county within same state (%) - American Indian and Alaska Native
Geographical mobility - Moved from different county within same state (%) - Multirace
Geographical mobility - Moved from different county within same state (%) - Other Race
Geographical mobility - Moved from different state (%)
Geographical mobility - Moved from different state (%) - White
Geographical mobility - Moved from different state (%) - Black or African American
Geographical mobility - Moved from different state (%) - Asian
Geographical mobility - Moved from different state (%) - Hispanic or Latino
Geographical mobility - Moved from different state (%) - American Indian and Alaska Native
Geographical mobility - Moved from different state (%) - Multirace
Geographical mobility - Moved from different state (%) - Other Race
Geographical mobility - Moved from abroad (%)
Geographical mobility - Moved from abroad (%) - White
Geographical mobility - Moved from abroad (%) - Black or African American
Geographical mobility - Moved from abroad (%) - Asian
Geographical mobility - Moved from abroad (%) - Hispanic or Latino
Geographical mobility - Moved from abroad (%) - American Indian and Alaska Native
Geographical mobility - Moved from abroad (%) - Multirace
Geographical mobility - Moved from abroad (%) - Other Race
Place of birth for the foreign-born population - Ireland (%)
Place of birth for the foreign-born population - Denmark (%)
Place of birth for the foreign-born population - Norway (%)
Place of birth for the foreign-born population - Sweden (%)
Place of birth for the foreign-born population - United Kingdom (%)
Place of birth for the foreign-born population - England (%)
Place of birth for the foreign-born population - Scotland (%)
Place of birth for the foreign-born population - Other Northern Europe (%)
Place of birth for the foreign-born population - Austria (%)
Place of birth for the foreign-born population - Belgium (%)
Place of birth for the foreign-born population - France (%)
Place of birth for the foreign-born population - Germany (%)
Place of birth for the foreign-born population - Netherlands (%)
Place of birth for the foreign-born population - Switzerland (%)
Place of birth for the foreign-born population - Other Western Europe (%)
Place of birth for the foreign-born population - Greece (%)
Place of birth for the foreign-born population - Italy (%)
Place of birth for the foreign-born population - Portugal (%)
Place of birth for the foreign-born population - Spain (%)
Place of birth for the foreign-born population - Other Southern Europe (%)
Place of birth for the foreign-born population - Albania (%)
Place of birth for the foreign-born population - Belarus (%)
Place of birth for the foreign-born population - Bosnia and Herzegovina (%)
Place of birth for the foreign-born population - Bulgaria (%)
Place of birth for the foreign-born population - Croatia (%)
Place of birth for the foreign-born population - Czechoslovakia (%)
Place of birth for the foreign-born population - Hungary (%)
Place of birth for the foreign-born population - Latvia (%)
Place of birth for the foreign-born population - Lithuania (%)
Place of birth for the foreign-born population - North Macedonia (Macedonia) (%)
Place of birth for the foreign-born population - Moldova (%)
Place of birth for the foreign-born population - Poland (%)
Place of birth for the foreign-born population - Romania (%)
Place of birth for the foreign-born population - Russia (%)
Place of birth for the foreign-born population - Serbia (%)
Place of birth for the foreign-born population - Ukraine (%)
Place of birth for the foreign-born population - Other Eastern Europe (%)
Place of birth for the foreign-born population - China (%)
Place of birth for the foreign-born population - Hong Kong (%)
Place of birth for the foreign-born population - Taiwan (%)
Place of birth for the foreign-born population - Japan (%)
Place of birth for the foreign-born population - Korea (%)
Place of birth for the foreign-born population - Other Eastern Asia (%)
Place of birth for the foreign-born population - Afghanistan (%)
Place of birth for the foreign-born population - Bangladesh (%)
Place of birth for the foreign-born population - India (%)
Place of birth for the foreign-born population - Iran (%)
Place of birth for the foreign-born population - Kazakhstan (%)
Place of birth for the foreign-born population - Nepal (%)
Place of birth for the foreign-born population - Pakistan (%)
Place of birth for the foreign-born population - Sri Lanka (%)
Place of birth for the foreign-born population - Uzbekistan (%)
Place of birth for the foreign-born population - Other South Central Asia (%)
Place of birth for the foreign-born population - Burma (%)
Place of birth for the foreign-born population - Cambodia (%)
Place of birth for the foreign-born population - Indonesia (%)
Place of birth for the foreign-born population - Laos (%)
Place of birth for the foreign-born population - Malaysia (%)
Place of birth for the foreign-born population - Philippines (%)
Place of birth for the foreign-born population - Singapore (%)
Place of birth for the foreign-born population - Thailand (%)
Place of birth for the foreign-born population - Vietnam (%)
Place of birth for the foreign-born population - Other South Eastern Asia (%)
Place of birth for the foreign-born population - Armenia (%)
Place of birth for the foreign-born population - Iraq (%)
Place of birth for the foreign-born population - Israel (%)
Place of birth for the foreign-born population - Jordan (%)
Place of birth for the foreign-born population - Kuwait (%)
Place of birth for the foreign-born population - Lebanon (%)
Place of birth for the foreign-born population - Saudi Arabia (%)
Place of birth for the foreign-born population - Syria (%)
Place of birth for the foreign-born population - Turkey (%)
Place of birth for the foreign-born population - Yemen (%)
Place of birth for the foreign-born population - Other Western Asia (%)
Place of birth for the foreign-born population - Eritrea (%)
Place of birth for the foreign-born population - Ethiopia (%)
Place of birth for the foreign-born population - Kenya (%)
Place of birth for the foreign-born population - Somalia (%)
Place of birth for the foreign-born population - Uganda (%)
Place of birth for the foreign-born population - Zimbabwe (%)
Place of birth for the foreign-born population - Other Eastern Africa (%)
Place of birth for the foreign-born population - Cameroon (%)
Place of birth for the foreign-born population - Congo (%)
Place of birth for the foreign-born population - Democratic Republic of Congo (Zaire) (%)
Place of birth for the foreign-born population - Other Middle Africa (%)
Place of birth for the foreign-born population - Egypt (%)
Place of birth for the foreign-born population - Morocco (%)
Place of birth for the foreign-born population - Sudan (%)
Place of birth for the foreign-born population - Other Northern Africa (%)
Place of birth for the foreign-born population - South Africa (%)
Place of birth for the foreign-born population - Other Southern Africa (%)
Place of birth for the foreign-born population - Cabo Verde (%)
Place of birth for the foreign-born population - Ghana (%)
Place of birth for the foreign-born population - Liberia (%)
Place of birth for the foreign-born population - Nigeria (%)
Place of birth for the foreign-born population - Senegal (%)
Place of birth for the foreign-born population - Sierra Leone (%)
Place of birth for the foreign-born population - Other Western Africa (%)
Place of birth for the foreign-born population - Australia (%)
Place of birth for the foreign-born population - New Zealand (%)
Place of birth for the foreign-born population - Fiji (%)
Place of birth for the foreign-born population - Micronesia (%)
Place of birth for the foreign-born population - Bahamas (%)
Place of birth for the foreign-born population - Barbados (%)
Place of birth for the foreign-born population - Cuba (%)
Place of birth for the foreign-born population - Dominica (%)
Place of birth for the foreign-born population - Dominican Republic (%)
Place of birth for the foreign-born population - Grenada (%)
Place of birth for the foreign-born population - Haiti (%)
Place of birth for the foreign-born population - Jamaica (%)
Place of birth for the foreign-born population - St. Vincent and the Grenadines (%)
Place of birth for the foreign-born population - Trinidad and Tobago (%)
Place of birth for the foreign-born population - West Indies (%)
Place of birth for the foreign-born population - Other Caribbean (%)
Place of birth for the foreign-born population - Belize (%)
Place of birth for the foreign-born population - Costa Rica (%)
Place of birth for the foreign-born population - El Salvador (%)
Place of birth for the foreign-born population - Guatemala (%)
Place of birth for the foreign-born population - Honduras (%)
Place of birth for the foreign-born population - Mexico (%)
Place of birth for the foreign-born population - Nicaragua (%)
Place of birth for the foreign-born population - Panama (%)
Place of birth for the foreign-born population - Other Central America (%)
Place of birth for the foreign-born population - Argentina (%)
Place of birth for the foreign-born population - Bolivia (%)
Place of birth for the foreign-born population - Brazil (%)
Place of birth for the foreign-born population - Chile (%)
Place of birth for the foreign-born population - Colombia (%)
Place of birth for the foreign-born population - Ecuador (%)
Place of birth for the foreign-born population - Guyana (%)
Place of birth for the foreign-born population - Peru (%)
Place of birth for the foreign-born population - Uruguay (%)
Place of birth for the foreign-born population - Venezuela (%)
Place of birth for the foreign-born population - Other South America (%)
Place of birth for the foreign-born population - Canada (%)
Place of birth for the foreign-born population - Other Northern America (%)
Place of birth for the foreign-born population - Other (%)
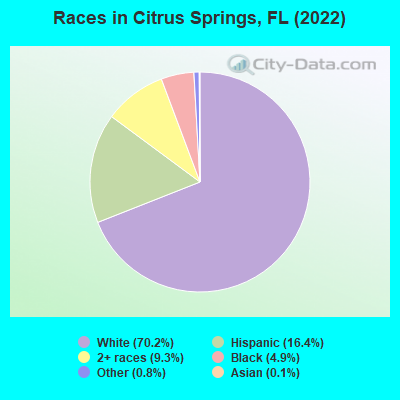
According to 2022 data, the most numerous races in Citrus Springs, FL are White alone (8,136 residents), Hispanic (1,905 residents), and Black alone (569 residents). 89.2% of Citrus Springs residents speak English at home. 5.9% of Citrus Springs, FL residents are foreign-born (3.9% born in Latin America, 0.7% born in Europe), which is 254.0% less than the foreign-born rate of 21.0% across the entire state of Florida.
Race distribution in Citrus Springs
2000 2022
10,458,509 65.4% White alone 2,682,715 16.8% Hispanic 2,264,268 14.2% Black alone 261,693 1.6% Asian alone 236,954 1.5% Two or more races 42,358 0.3% American Indian alone 28,994 0.2% Other race alone 6,887 0.04% Native Hawaiian and Other
11,309,403 50.8% White alone 6,025,039 27.1% Hispanic 3,241,015 14.6% Black alone 861,630 3.9% Two or more races 623,692 2.8% Asian alone 152,054 0.7% Other race alone 22,504 0.1% American Indian alone 9,486 0.04% Native Hawaiian and Other
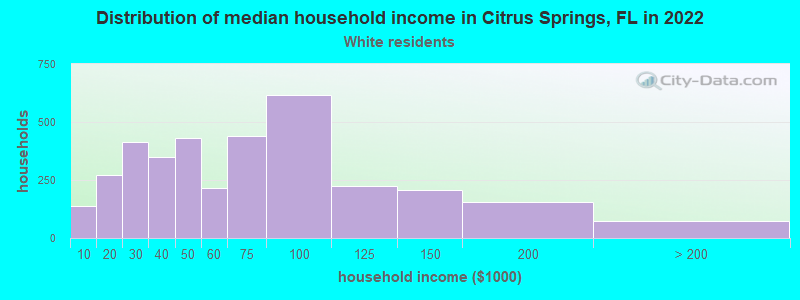
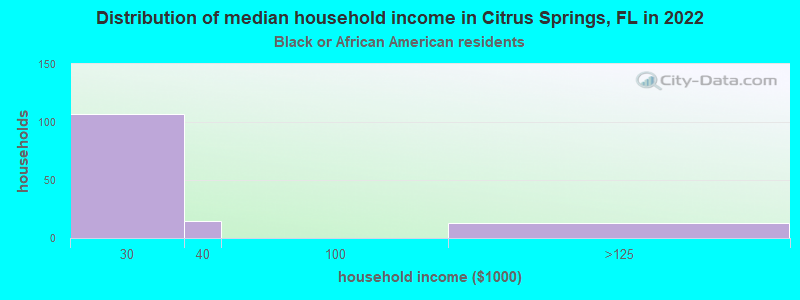
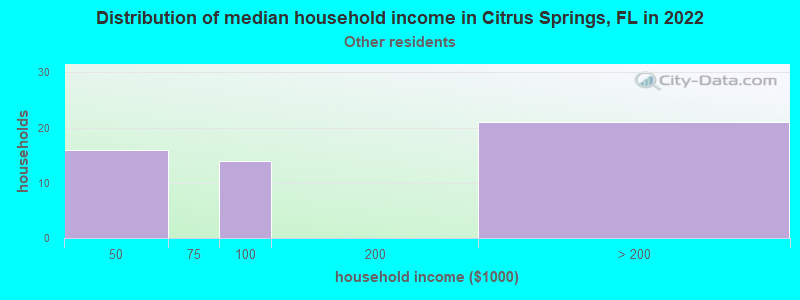
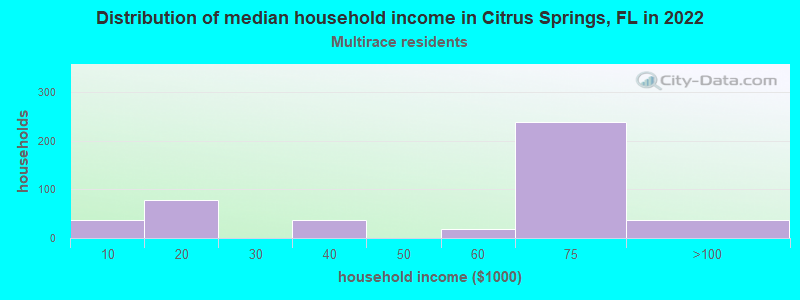
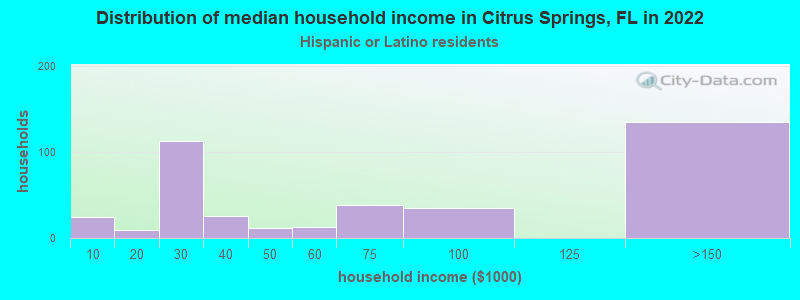
Income and house value in Citrus Springs Median household income in 2022 $59,696 White non-Hispanic householders$24,768 Black householders$52,812 Two or more races householders$52,332 Hispanic or Latino race householdersMedian 2022 house value $242,263 White Non-Hispanic householders$356,406 Black or African American householders$268,220 Some other race householders$421,298 Two or more races householders$263,894 Hispanic or Latino householders
Median age by race in Citrus Springs
46.3 Median age for White residents45.5 48.2 17.3 Median age for Black or African American residents11.8 52.1 -598,566,307.6 Median age for American Indian / Alaska Native residents-611,418,047.3 -594,925,633.7 -676,691,728.6 Median age for Asian residents-728,522,336.0 -667,770,418.8 -679,849,340.2 Median age for Native Hawaiian / Pacific Islander residents-666,666,666.0 -666,666,666.0 55.3 Median age for Other race residents54.0 63.7 24.3 Median age for Two or more races residents19.1 27.4 47.6 Median age for White alone residents45.7 49.5 39.8 Median age for Hispanic or Latino residents39.8 46.1
Owner/renter occupied households by race in Citrus Springs
House owners and renters - White residents 3,337 92.2% Owner occupied283 7.8% Renter occupiedHouse owners and renters - Black or African American residents 27 19.0% Owner occupied115 81.0% Renter occupiedHouse owners and renters - Other race residents 53 100.0% Owner occupiedHouse owners and renters - Two or more races residents 352 91.3% Owner occupied33 8.7% Renter occupiedHouse owners and renters - White alone residents 3,088 91.5% Owner occupied285 8.5% Renter occupiedHouse owners and renters - Hispanic or Latino residents 309 89.3% Owner occupied37 10.7% Renter occupied
Language usage in Citrus Springs
English speakers - Total 89.2% of residents of Citrus Springs speak English at home.
10.3% of residents speak Spanish at home 816 71.8% Speak English very well321 28.2% Speak English less than very well0.9% of residents speak other language at home 77 74.0% Speak English very well27 26.0% Speak English less than very well
English speakers - Born in the United States 95.9% of residents of Citrus Springs speak English at home.
4.1% of residents speak Spanish at home 223 86.4% Speak English very well35 13.6% Speak English less than very well0.4% of residents speak other language at home 23 100.0% Speak English less than very well
English speakers - Native, born elsewhere 3.5% of residents of Citrus Springs speak English at home.
50.8% of residents speak Spanish at home 163 66.3% Speak English very well83 33.7% Speak English less than very well4.3% of residents speak other language at home 21 100.0% Speak English very well
English speakers - Foreign-born 53.1% of residents of Citrus Springs speak English at home.
35.4% of residents speak Spanish at home 80 40.6% Speak English very well117 59.4% Speak English less than very well12.7% of residents speak other language at home 61 85.9% Speak English very well10 14.1% Speak English less than very well
White (Caucasian) - Speak only English Native:
92.3% (7,855)Foreign-born:
51.8% (64)
White (Caucasian) - Speak another language Native:
5.8% (492)Foreign-born:
38.5% (47)
Black or African American - Speak another language Native:
9.3% (58)Foreign-born:
100.0% (31)
Other race - Speak another language Native:
39.6% (81)Foreign-born:
100.0% (216)
Two or more races - Speak only English Native:
84.7% (1,103)Foreign-born:
100.0% (256)
Two or more races - Speak another language Native:
15.2% (198)Foreign-born:
20.1% (51)
White alone - Speak only English Native:
98.8% (7,604)Foreign-born:
87.3% (65)
White alone - Speak another language Native:
1.2% (91)Foreign-born:
54.6% (41)
Hispanic or Latino - Speak another language Native:
51.2% (917)Foreign-born:
100.0% (198)
Foreign-born residents in Citrus Springs 688 residents are foreign born (3.9% Latin America , 0.7% Europe ).
This city:
5.9%Florida:
21.1%
Marital status for residents in Citrus Springs Marital status - White (Caucasian) population 15 years and over
Males 26.6% Never married56.3% Now married0.9% Separated1.7% Widowed14.6% DivorcedFemales 19.5% Never married54.7% Now married2.4% Separated14.0% Widowed9.5% DivorcedWomen who gave birth in the past 12 months Now married:
74.4% (89)Unmarried:
25.6% (31)
Women who did not give birth in the past 12 months Now married:
44.5% (709)Unmarried:
55.5% (885)
Marital status - Black or African American population 15 years and over
Males 41.0% Never married22.2% Now married0.0% Separated0.0% Widowed36.8% DivorcedFemales 79.1% Never married20.9% Now married0.0% Separated0.0% Widowed0.0% DivorcedWomen who did not give birth in the past 12 months Now married:
0.0% (0)Unmarried:
100.0% (191)
Marital status - Other race population 15 years and over
Males 0.0% Never married92.0% Now married0.0% Separated0.0% Widowed8.0% DivorcedFemales 0.0% Never married44.3% Now married0.0% Separated25.7% Widowed30.0% DivorcedWomen who did not give birth in the past 12 months Now married:
100.0% (11)Unmarried:
0.0% (0)
Marital status - Two or more races population 15 years and over
Males 30.4% Never married58.6% Now married0.0% Separated0.0% Widowed11.1% DivorcedFemales 56.2% Never married31.1% Now married3.0% Separated0.0% Widowed9.7% DivorcedWomen who did not give birth in the past 12 months Now married:
35.1% (326)Unmarried:
64.9% (601)
Marital status - White alone, not Hispanic / Latino population 15 years and over
Males 28.6% Never married53.0% Now married1.0% Separated1.8% Widowed15.7% DivorcedFemales 17.2% Never married54.1% Now married2.6% Separated15.4% Widowed10.6% DivorcedWomen who gave birth in the past 12 months Now married:
74.4% (90)Unmarried:
25.6% (31)
Women who did not give birth in the past 12 months Now married:
44.9% (599)Unmarried:
55.1% (735)
Marital status - Hispanic or Latino population 15 years and over
Males 15.6% Never married76.7% Now married0.0% Separated0.0% Widowed7.8% DivorcedFemales 31.3% Never married56.7% Now married3.5% Separated1.4% Widowed7.1% DivorcedWomen who did not give birth in the past 12 months Now married:
49.2% (185)Unmarried:
50.8% (191)
Ancestries in Citrus Springs
1,322 21.7% American729 12.0% German623 10.2% Guyanese531 8.7% English393 6.5% Italian225 3.7% Irish150 2.5% South African101 1.7% European76 1.2% Polish68 1.1% French61 1.0% Czech58 1.0% Welsh49 0.8% Scandinavian48 0.8% French Canadian43 0.7% Portuguese36 0.6% Greek34 0.6% British21 0.3% Scotch-Irish20 0.3% Dutch19 0.3% Norwegian18 0.3% Celtic18 0.3% Latvian18 0.3% Ukrainian16 0.3% Eastern European15 0.2% African14 0.2% Belgian12 0.2% Finnish10 0.2% Scottish1 0.02% Canadian
Children Nativity (place of birth) in Citrus Springs
Children under 6 years - Living with two parents Both parents native 394 100.0% NativeOne native, one foreign-born parent 31 100.0% NativeChildren under 6 years - Living with one parent Native parent 224 100.0% NativeChildren 6 to 17 years - Living with two parents Both parents native 752 100.0% NativeBoth parents foreign-born 41 51.7% Native39 48.3% Foreign-bornOne native, one foreign-born parent 57 100.0% NativeChildren 6 to 17 years - Living with one parent Native parent 715 100.0% Native
Grandparents responsible for own grandchildren in Citrus Springs
Grandparents (30 to 59 years) White / Caucasian 71 72.1% Responsible for grandchildren27 27.9% Not responsible for grandchildrenOther race 59 100.0% Not responsible for grandchildrenHispanic or Latino 40 33.9% Responsible for grandchildren77 66.1% Not responsible for grandchildrenGrandparents (60 years and over) White / Caucasian 27 24.0% Responsible for grandchildren86 76.0% Not responsible for grandchildrenHispanic or Latino 60 75.7% Responsible for grandchildren19 24.3% Not responsible for grandchildren