Races in Clermont, Florida (FL) Detailed Stats
Data:
Races - White alone (%)
Races - White alone (% change since 2000)
Races - Black alone (%)
Races - Black alone (% change since 2000)
Races - American Indian alone (%)
Races - American Indian alone (% change since 2000)
Races - Asian alone (%)
Races - Asian alone (% change since 2000)
Races - Hispanic (%)
Races - Hispanic (% change since 2000)
Races - Native Hawaiian and Other Pacific Islander alone (%)
Races - Native Hawaiian and Other Pacific Islander alone (% change since 2000)
Races - Two or more races(%)
Races - Two or more races(% change since 2000)
Races - Other race alone (%)
Races - Other race alone (% change since 2000)
Racial diversity
Place of birth - Born in state of residence (%)
Place of birth - Born in state of residence (%) - White
Place of birth - Born in state of residence (%) - Black or African American
Place of birth - Born in state of residence (%) - Asian
Place of birth - Born in state of residence (%) - Hispanic or Latino
Place of birth - Born in state of residence (%) - American Indian and Alaska Native
Place of birth - Born in state of residence (%) - Multirace
Place of birth - Born in state of residence (%) - Other Race
Place of birth - Born in other state (%)
Place of birth - Born in other state (%) - White
Place of birth - Born in other state (%) - Black or African American
Place of birth - Born in other state (%) - Asian
Place of birth - Born in other state (%) - Hispanic or Latino
Place of birth - Born in other state (%) - American Indian and Alaska Native
Place of birth - Born in other state (%) - Multirace
Place of birth - Born in other state (%) - Other Race
Place of birth - Native, outside of US (%)
Place of birth - Native, outside of US (%) - White
Place of birth - Native, outside of US (%) - Black or African American
Place of birth - Native, outside of US (%) - Asian
Place of birth - Native, outside of US (%) - Hispanic or Latino
Place of birth - Native, outside of US (%) - American Indian and Alaska Native
Place of birth - Native, outside of US (%) - Multirace
Place of birth - Native, outside of US (%) - Other Race
Place of birth - Foreign born (%)
Place of birth - Foreign born (%) - White
Place of birth - Foreign born (%) - Black or African American
Place of birth - Foreign born (%) - Asian
Place of birth - Foreign born (%) - Hispanic or Latino
Place of birth - Foreign born (%) - American Indian and Alaska Native
Place of birth - Foreign born (%) - Multirace
Place of birth - Foreign born (%) - Other Race
Residents speaking English at home (%)
Residents speaking English at home - Born in the United States (%)
Residents speaking English at home - Native, born elsewhere (%)
Residents speaking English at home - Foreign born (%)
Residents speaking Spanish at home (%)
Residents speaking Spanish at home - Born in the United States (%)
Residents speaking Spanish at home - Native, born elsewhere (%)
Residents speaking Spanish at home - Foreign born (%)
Residents speaking other language at home (%)
Residents speaking other language at home - Born in the United States (%)
Residents speaking other language at home - Native, born elsewhere (%)
Residents speaking other language at home - Foreign born (%)
Marital status - Never married (%)
Marital status - Now married (%)
Marital status - Separated (%)
Marital status - Widowed (%)
Marital status - Divorced (%)
Ancestries Reported - Arab (%)
Ancestries Reported - Czech (%)
Ancestries Reported - Danish (%)
Ancestries Reported - Dutch (%)
Ancestries Reported - English (%)
Ancestries Reported - French (%)
Ancestries Reported - French Canadian (%)
Ancestries Reported - German (%)
Ancestries Reported - Greek (%)
Ancestries Reported - Hungarian (%)
Ancestries Reported - Irish (%)
Ancestries Reported - Italian (%)
Ancestries Reported - Lithuanian (%)
Ancestries Reported - Norwegian (%)
Ancestries Reported - Polish (%)
Ancestries Reported - Portuguese (%)
Ancestries Reported - Russian (%)
Ancestries Reported - Scotch-Irish (%)
Ancestries Reported - Scottish (%)
Ancestries Reported - Slovak (%)
Ancestries Reported - Subsaharan African (%)
Ancestries Reported - Swedish (%)
Ancestries Reported - Swiss (%)
Ancestries Reported - Ukrainian (%)
Ancestries Reported - United States (%)
Ancestries Reported - Welsh (%)
Ancestries Reported - West Indian (%)
Ancestries Reported - Other (%)
Geographical mobility - Same house 1 year ago (%)
Geographical mobility - Same house 1 year ago (%) - White
Geographical mobility - Same house 1 year ago (%) - Black or African American
Geographical mobility - Same house 1 year ago (%) - Asian
Geographical mobility - Same house 1 year ago (%) - Hispanic or Latino
Geographical mobility - Same house 1 year ago (%) - American Indian and Alaska Native
Geographical mobility - Same house 1 year ago (%) - Multirace
Geographical mobility - Same house 1 year ago (%) - Other Race
Geographical mobility - Moved within same county (%)
Geographical mobility - Moved within same county (%) - White
Geographical mobility - Moved within same county (%) - Black or African American
Geographical mobility - Moved within same county (%) - Asian
Geographical mobility - Moved within same county (%) - Hispanic or Latino
Geographical mobility - Moved within same county (%) - American Indian and Alaska Native
Geographical mobility - Moved within same county (%) - Multirace
Geographical mobility - Moved within same county (%) - Other Race
Geographical mobility - Moved from different county within same state (%)
Geographical mobility - Moved from different county within same state (%) - White
Geographical mobility - Moved from different county within same state (%) - Black or African American
Geographical mobility - Moved from different county within same state (%) - Asian
Geographical mobility - Moved from different county within same state (%) - Hispanic or Latino
Geographical mobility - Moved from different county within same state (%) - American Indian and Alaska Native
Geographical mobility - Moved from different county within same state (%) - Multirace
Geographical mobility - Moved from different county within same state (%) - Other Race
Geographical mobility - Moved from different state (%)
Geographical mobility - Moved from different state (%) - White
Geographical mobility - Moved from different state (%) - Black or African American
Geographical mobility - Moved from different state (%) - Asian
Geographical mobility - Moved from different state (%) - Hispanic or Latino
Geographical mobility - Moved from different state (%) - American Indian and Alaska Native
Geographical mobility - Moved from different state (%) - Multirace
Geographical mobility - Moved from different state (%) - Other Race
Geographical mobility - Moved from abroad (%)
Geographical mobility - Moved from abroad (%) - White
Geographical mobility - Moved from abroad (%) - Black or African American
Geographical mobility - Moved from abroad (%) - Asian
Geographical mobility - Moved from abroad (%) - Hispanic or Latino
Geographical mobility - Moved from abroad (%) - American Indian and Alaska Native
Geographical mobility - Moved from abroad (%) - Multirace
Geographical mobility - Moved from abroad (%) - Other Race
Place of birth for the foreign-born population - Ireland (%)
Place of birth for the foreign-born population - Denmark (%)
Place of birth for the foreign-born population - Norway (%)
Place of birth for the foreign-born population - Sweden (%)
Place of birth for the foreign-born population - United Kingdom (%)
Place of birth for the foreign-born population - England (%)
Place of birth for the foreign-born population - Scotland (%)
Place of birth for the foreign-born population - Other Northern Europe (%)
Place of birth for the foreign-born population - Austria (%)
Place of birth for the foreign-born population - Belgium (%)
Place of birth for the foreign-born population - France (%)
Place of birth for the foreign-born population - Germany (%)
Place of birth for the foreign-born population - Netherlands (%)
Place of birth for the foreign-born population - Switzerland (%)
Place of birth for the foreign-born population - Other Western Europe (%)
Place of birth for the foreign-born population - Greece (%)
Place of birth for the foreign-born population - Italy (%)
Place of birth for the foreign-born population - Portugal (%)
Place of birth for the foreign-born population - Spain (%)
Place of birth for the foreign-born population - Other Southern Europe (%)
Place of birth for the foreign-born population - Albania (%)
Place of birth for the foreign-born population - Belarus (%)
Place of birth for the foreign-born population - Bosnia and Herzegovina (%)
Place of birth for the foreign-born population - Bulgaria (%)
Place of birth for the foreign-born population - Croatia (%)
Place of birth for the foreign-born population - Czechoslovakia (%)
Place of birth for the foreign-born population - Hungary (%)
Place of birth for the foreign-born population - Latvia (%)
Place of birth for the foreign-born population - Lithuania (%)
Place of birth for the foreign-born population - North Macedonia (Macedonia) (%)
Place of birth for the foreign-born population - Moldova (%)
Place of birth for the foreign-born population - Poland (%)
Place of birth for the foreign-born population - Romania (%)
Place of birth for the foreign-born population - Russia (%)
Place of birth for the foreign-born population - Serbia (%)
Place of birth for the foreign-born population - Ukraine (%)
Place of birth for the foreign-born population - Other Eastern Europe (%)
Place of birth for the foreign-born population - China (%)
Place of birth for the foreign-born population - Hong Kong (%)
Place of birth for the foreign-born population - Taiwan (%)
Place of birth for the foreign-born population - Japan (%)
Place of birth for the foreign-born population - Korea (%)
Place of birth for the foreign-born population - Other Eastern Asia (%)
Place of birth for the foreign-born population - Afghanistan (%)
Place of birth for the foreign-born population - Bangladesh (%)
Place of birth for the foreign-born population - India (%)
Place of birth for the foreign-born population - Iran (%)
Place of birth for the foreign-born population - Kazakhstan (%)
Place of birth for the foreign-born population - Nepal (%)
Place of birth for the foreign-born population - Pakistan (%)
Place of birth for the foreign-born population - Sri Lanka (%)
Place of birth for the foreign-born population - Uzbekistan (%)
Place of birth for the foreign-born population - Other South Central Asia (%)
Place of birth for the foreign-born population - Burma (%)
Place of birth for the foreign-born population - Cambodia (%)
Place of birth for the foreign-born population - Indonesia (%)
Place of birth for the foreign-born population - Laos (%)
Place of birth for the foreign-born population - Malaysia (%)
Place of birth for the foreign-born population - Philippines (%)
Place of birth for the foreign-born population - Singapore (%)
Place of birth for the foreign-born population - Thailand (%)
Place of birth for the foreign-born population - Vietnam (%)
Place of birth for the foreign-born population - Other South Eastern Asia (%)
Place of birth for the foreign-born population - Armenia (%)
Place of birth for the foreign-born population - Iraq (%)
Place of birth for the foreign-born population - Israel (%)
Place of birth for the foreign-born population - Jordan (%)
Place of birth for the foreign-born population - Kuwait (%)
Place of birth for the foreign-born population - Lebanon (%)
Place of birth for the foreign-born population - Saudi Arabia (%)
Place of birth for the foreign-born population - Syria (%)
Place of birth for the foreign-born population - Turkey (%)
Place of birth for the foreign-born population - Yemen (%)
Place of birth for the foreign-born population - Other Western Asia (%)
Place of birth for the foreign-born population - Eritrea (%)
Place of birth for the foreign-born population - Ethiopia (%)
Place of birth for the foreign-born population - Kenya (%)
Place of birth for the foreign-born population - Somalia (%)
Place of birth for the foreign-born population - Uganda (%)
Place of birth for the foreign-born population - Zimbabwe (%)
Place of birth for the foreign-born population - Other Eastern Africa (%)
Place of birth for the foreign-born population - Cameroon (%)
Place of birth for the foreign-born population - Congo (%)
Place of birth for the foreign-born population - Democratic Republic of Congo (Zaire) (%)
Place of birth for the foreign-born population - Other Middle Africa (%)
Place of birth for the foreign-born population - Egypt (%)
Place of birth for the foreign-born population - Morocco (%)
Place of birth for the foreign-born population - Sudan (%)
Place of birth for the foreign-born population - Other Northern Africa (%)
Place of birth for the foreign-born population - South Africa (%)
Place of birth for the foreign-born population - Other Southern Africa (%)
Place of birth for the foreign-born population - Cabo Verde (%)
Place of birth for the foreign-born population - Ghana (%)
Place of birth for the foreign-born population - Liberia (%)
Place of birth for the foreign-born population - Nigeria (%)
Place of birth for the foreign-born population - Senegal (%)
Place of birth for the foreign-born population - Sierra Leone (%)
Place of birth for the foreign-born population - Other Western Africa (%)
Place of birth for the foreign-born population - Australia (%)
Place of birth for the foreign-born population - New Zealand (%)
Place of birth for the foreign-born population - Fiji (%)
Place of birth for the foreign-born population - Micronesia (%)
Place of birth for the foreign-born population - Bahamas (%)
Place of birth for the foreign-born population - Barbados (%)
Place of birth for the foreign-born population - Cuba (%)
Place of birth for the foreign-born population - Dominica (%)
Place of birth for the foreign-born population - Dominican Republic (%)
Place of birth for the foreign-born population - Grenada (%)
Place of birth for the foreign-born population - Haiti (%)
Place of birth for the foreign-born population - Jamaica (%)
Place of birth for the foreign-born population - St. Vincent and the Grenadines (%)
Place of birth for the foreign-born population - Trinidad and Tobago (%)
Place of birth for the foreign-born population - West Indies (%)
Place of birth for the foreign-born population - Other Caribbean (%)
Place of birth for the foreign-born population - Belize (%)
Place of birth for the foreign-born population - Costa Rica (%)
Place of birth for the foreign-born population - El Salvador (%)
Place of birth for the foreign-born population - Guatemala (%)
Place of birth for the foreign-born population - Honduras (%)
Place of birth for the foreign-born population - Mexico (%)
Place of birth for the foreign-born population - Nicaragua (%)
Place of birth for the foreign-born population - Panama (%)
Place of birth for the foreign-born population - Other Central America (%)
Place of birth for the foreign-born population - Argentina (%)
Place of birth for the foreign-born population - Bolivia (%)
Place of birth for the foreign-born population - Brazil (%)
Place of birth for the foreign-born population - Chile (%)
Place of birth for the foreign-born population - Colombia (%)
Place of birth for the foreign-born population - Ecuador (%)
Place of birth for the foreign-born population - Guyana (%)
Place of birth for the foreign-born population - Peru (%)
Place of birth for the foreign-born population - Uruguay (%)
Place of birth for the foreign-born population - Venezuela (%)
Place of birth for the foreign-born population - Other South America (%)
Place of birth for the foreign-born population - Canada (%)
Place of birth for the foreign-born population - Other Northern America (%)
Place of birth for the foreign-born population - Other (%)
Latest news about races in Clermont, FL collected exclusively by city-data.com from local newspapers, TV, and radio stations
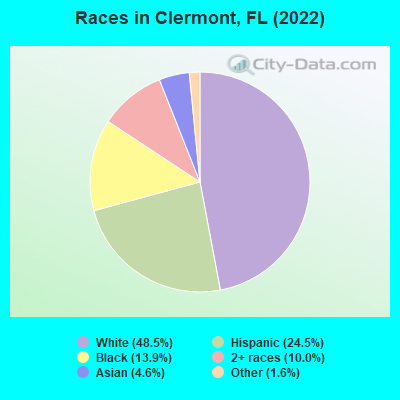
According to 2022 data, the most numerous races in Clermont, FL are White alone (22,240 residents), Hispanic (11,245 residents), and Black alone (6,354 residents). 78.7% of Clermont residents speak English at home. 17.7% of Clermont, FL residents are foreign-born (12.7% born in Latin America, 2.4% born in Europe), which is 18.5% less than the foreign-born rate of 21.0% across the entire state of Florida.
Race distribution in Clermont
2000 2022
10,458,509 65.4% White alone 2,682,715 16.8% Hispanic 2,264,268 14.2% Black alone 261,693 1.6% Asian alone 236,954 1.5% Two or more races 42,358 0.3% American Indian alone 28,994 0.2% Other race alone 6,887 0.04% Native Hawaiian and Other
11,309,403 50.8% White alone 6,025,039 27.1% Hispanic 3,241,015 14.6% Black alone 861,630 3.9% Two or more races 623,692 2.8% Asian alone 152,054 0.7% Other race alone 22,504 0.1% American Indian alone 9,486 0.04% Native Hawaiian and Other
Income and house value in Clermont Median household income in 2022 $78,873 White non-Hispanic householders$70,465 Black householders$76,374 Asian householders$72,799 Some other race householders$82,784 Two or more races householders$76,620 Hispanic or Latino race householdersMedian 2022 house value $434,558 White Non-Hispanic householders$211,979 Black or African American householders$274,111 American Indian or Alaska Native householders$584,772 Some other race householders$554,071 Two or more races householders$347,208 Hispanic or Latino householders
Median age by race in Clermont
48.8 Median age for White residents49.1 48.5 42.4 Median age for Black or African American residents43.3 43.0 -654,353,561.4 Median age for American Indian / Alaska Native residents-665,012,406.3 -591,194,968.0 43.6 Median age for Asian residents50.2 22.3 -679,849,340.2 Median age for Native Hawaiian / Pacific Islander residents-858,307,848.3 -443,298,968.6 34.3 Median age for Other race residents35.6 32.1 33.4 Median age for Two or more races residents31.7 33.0 49.8 Median age for White alone residents50.7 47.7 41.9 Median age for Hispanic or Latino residents41.6 43.6
Owner/renter occupied households by race in Clermont
House owners and renters - White residents 8,179 76.4% Owner occupied2,531 23.6% Renter occupiedHouse owners and renters - Black or African American residents 1,000 40.4% Owner occupied1,475 59.6% Renter occupiedHouse owners and renters - American Indian / Alaska Native residents 40 100.0% Owner occupiedHouse owners and renters - Asian residents 648 88.5% Owner occupied84 11.5% Renter occupiedHouse owners and renters - Other race residents 314 48.8% Owner occupied330 51.2% Renter occupiedHouse owners and renters - Two or more races residents 2,149 62.6% Owner occupied1,286 37.4% Renter occupiedHouse owners and renters - White alone residents 7,595 78.2% Owner occupied2,122 21.8% Renter occupiedHouse owners and renters - Hispanic or Latino residents 2,436 61.2% Owner occupied1,545 38.8% Renter occupied
Language usage in Clermont
English speakers - Total 78.7% of residents of Clermont speak English at home.
16.2% of residents speak Spanish at home 5,122 71.4% Speak English very well2,047 28.6% Speak English less than very well5.5% of residents speak other language at home 1,976 80.8% Speak English very well471 19.2% Speak English less than very well
English speakers - Born in the United States 91.6% of residents of Clermont speak English at home.
7.4% of residents speak Spanish at home 1,496 96.9% Speak English very well48 3.1% Speak English less than very well1.3% of residents speak other language at home 263 100.0% Speak English very well
English speakers - Native, born elsewhere 32.1% of residents of Clermont speak English at home.
65.5% of residents speak Spanish at home 987 73.0% Speak English very well365 27.0% Speak English less than very well3.2% of residents speak other language at home 66 100.0% Speak English very well
English speakers - Foreign-born 33.5% of residents of Clermont speak English at home.
43.6% of residents speak Spanish at home 1,874 56.4% Speak English very well1,446 43.6% Speak English less than very well22.0% of residents speak other language at home 1,212 72.3% Speak English very well464 27.7% Speak English less than very well
White (Caucasian) - Speak only English Native:
93.8% (20,617)Foreign-born:
52.8% (793)
White (Caucasian) - Speak another language Native:
6.0% (1,326)Foreign-born:
75.4% (1,133)
Black or African American - Speak only English Native:
99.2% (5,636)Foreign-born:
80.3% (525)
Black or African American - Speak another language Native:
1.2% (65)Foreign-born:
18.5% (121)
Asian - Speak only English Native:
95.5% (629)Foreign-born:
36.0% (494)
Asian - Speak another language Native:
4.8% (31)Foreign-born:
59.0% (811)
Other race - Speak only English Native:
53.9% (679)Foreign-born:
3.2% (27)
Other race - Speak another language Native:
48.0% (604)Foreign-born:
98.3% (848)
Two or more races - Speak only English Native:
69.5% (5,664)Foreign-born:
21.5% (757)
Two or more races - Speak another language Native:
31.2% (2,544)Foreign-born:
68.6% (2,415)
White alone - Speak only English Native:
98.5% (20,050)Foreign-born:
51.7% (538)
White alone - Speak another language Native:
1.4% (293)Foreign-born:
39.6% (412)
Hispanic or Latino - Speak only English Native:
45.1% (2,893)Foreign-born:
15.8% (681)
Hispanic or Latino - Speak another language Native:
53.9% (3,456)Foreign-born:
81.3% (3,504)
Foreign-born residents in Clermont 8,129 residents are foreign born (12.7% Latin America , 2.4% Europe ).
This city:
17.7%Florida:
21.1%
Marital status for residents in Clermont Marital status - White (Caucasian) population 15 years and over
Males 19.3% Never married66.8% Now married0.0% Separated5.2% Widowed8.7% DivorcedFemales 23.1% Never married51.3% Now married0.6% Separated12.9% Widowed12.1% DivorcedWomen who gave birth in the past 12 months Now married:
60.4% (153)Unmarried:
39.6% (100)
Women who did not give birth in the past 12 months Now married:
51.6% (2,378)Unmarried:
48.4% (2,230)
Marital status - Black or African American population 15 years and over
Males 51.3% Never married37.9% Now married0.2% Separated5.1% Widowed5.5% DivorcedFemales 33.2% Never married44.0% Now married0.0% Separated5.9% Widowed16.9% DivorcedWomen who did not give birth in the past 12 months Now married:
37.6% (556)Unmarried:
62.4% (922)
Marital status - American Indian / Alaska Native population 15 years and over
Males 0.0% Never married100.0% Now married0.0% Separated0.0% Widowed0.0% DivorcedFemales 0.0% Never married100.0% Now married0.0% Separated0.0% Widowed0.0% DivorcedWomen who did not give birth in the past 12 months Now married:
100.0% (29)Unmarried:
0.0% (0)
Marital status - Asian population 15 years and over
Males 32.7% Never married65.9% Now married0.0% Separated0.0% Widowed1.4% DivorcedFemales 45.1% Never married42.3% Now married0.0% Separated4.3% Widowed8.3% DivorcedWomen who did not give birth in the past 12 months Now married:
25.9% (139)Unmarried:
74.1% (399)
Marital status - Other race population 15 years and over
Males 42.1% Never married53.8% Now married0.0% Separated1.9% Widowed2.2% DivorcedFemales 9.2% Never married65.3% Now married0.0% Separated10.8% Widowed14.7% DivorcedWomen who gave birth in the past 12 months Now married:
100.0% (75)Unmarried:
0.0% (0)
Women who did not give birth in the past 12 months Now married:
59.3% (276)Unmarried:
40.7% (189)
Marital status - Two or more races population 15 years and over
Males 41.1% Never married47.9% Now married6.4% Separated1.1% Widowed3.5% DivorcedFemales 44.6% Never married43.1% Now married1.8% Separated4.0% Widowed6.4% DivorcedWomen who did not give birth in the past 12 months Now married:
21.4% (515)Unmarried:
78.6% (1,892)
Marital status - White alone, not Hispanic / Latino population 15 years and over
Males 19.5% Never married66.2% Now married0.0% Separated4.6% Widowed9.7% DivorcedFemales 23.1% Never married49.7% Now married0.5% Separated14.3% Widowed12.4% DivorcedWomen who gave birth in the past 12 months Now married:
60.1% (143)Unmarried:
39.9% (95)
Women who did not give birth in the past 12 months Now married:
46.5% (1,900)Unmarried:
53.5% (2,185)
Marital status - Hispanic or Latino population 15 years and over
Males 23.8% Never married63.3% Now married4.1% Separated5.7% Widowed3.1% DivorcedFemales 26.4% Never married57.4% Now married0.4% Separated6.2% Widowed9.7% DivorcedWomen who gave birth in the past 12 months Now married:
80.9% (62)Unmarried:
19.1% (15)
Women who did not give birth in the past 12 months Now married:
54.2% (1,212)Unmarried:
45.8% (1,023)
Ancestries in Clermont
7,256 26.5% American1,705 6.2% Guyanese1,587 5.8% German1,206 4.4% Irish1,202 4.4% English825 3.0% Italian373 1.4% European324 1.2% Polish263 1.0% Dutch241 0.9% Jamaican218 0.8% French Canadian170 0.6% Romanian152 0.6% British147 0.5% Scottish146 0.5% British West Indian119 0.4% French113 0.4% Scotch-Irish91 0.3% Hungarian88 0.3% Barbadian82 0.3% African72 0.3% Trinidadian and Tobagonian61 0.2% Nigerian57 0.2% Swedish55 0.2% Egyptian53 0.2% Russian49 0.2% Ukrainian47 0.2% Norwegian45 0.2% Slovak42 0.2% Portuguese40 0.1% Cape Verdean39 0.1% Latvian35 0.1% Yugoslavian31 0.1% Danish24 0.09% Serbian15 0.05% Lebanese12 0.04% Palestinian12 0.04% Welsh12 0.04% Slovene9 0.03% Armenian9 0.03% West Indian
Geographical mobility in Clermont Same house 1 year ago 20,669 83.2% White (Caucasian)5,942 91.8% Black or African American14 34.4% American Indian / Alaska Native1,801 93.1% Asian1,704 72.1% Other race11,885 98.4% Two or more races19,112 86.5% White alone, not Hispanic / Latino9,241 82.1% Hispanic or LatinoMoved within same county 965 3.9% White / Caucasian279 4.3% Black or African American21 51.5% American Indian / Alaska Native27 1.4% Asian132 5.6% Other race283 2.3% Two or more races814 3.7% White alone, not Hispanic / Latino480 4.3% Hispanic or LatinoMoved within same state 2,049 8.2% White / Caucasian239 3.7% Black or African American51 2.6% Asian315 13.3% Other race85 0.7% Two or more races1,400 6.3% White alone, not Hispanic / Latino692 6.2% Hispanic or LatinoMoved from different state 868 3.5% White / Caucasian70 3.6% Asian78 3.3% Other race14 0.1% Two or more races676 3.1% White alone, not Hispanic / Latino418 3.7% Hispanic or LatinoMoved from abroad 73 3.1% Other race62 0.5% Two or more races148 1.3% Hispanic or Latino
Children Nativity (place of birth) in Clermont
Children under 6 years - Living with two parents Both parents native 841 100.0% NativeBoth parents foreign-born 198 100.0% NativeOne native, one foreign-born parent 605 100.0% NativeChildren under 6 years - Living with one parent Native parent 327 100.0% NativeForeign-born parent 127 100.0% NativeChildren 6 to 17 years - Living with two parents Both parents native 3,722 100.0% NativeBoth parents foreign-born 556 60.1% Native369 39.9% Foreign-bornOne native, one foreign-born parent 410 91.7% Native37 8.3% Foreign-bornChildren 6 to 17 years - Living with one parent Native parent 2,229 100.0% NativeForeign-born parent 268 46.1% Native314 53.9% Foreign-born
Grandparents responsible for own grandchildren in Clermont
Grandparents (30 to 59 years) White / Caucasian 69 100.0% Not responsible for grandchildrenBlack or African American 51 100.0% Not responsible for grandchildrenAsian 9 100.0% Not responsible for grandchildrenTwo or more races 18 100.0% Not responsible for grandchildrenWhite alone, not Hispanic / Latino 79 100.0% Not responsible for grandchildren
Grandparents (60 years and over) White / Caucasian 13 3.0% Responsible for grandchildren421 97.0% Not responsible for grandchildrenBlack or African American 21 100.0% Not responsible for grandchildrenTwo or more races 794 100.0% Not responsible for grandchildrenWhite alone, not Hispanic / Latino 15 3.6% Responsible for grandchildren385 96.4% Not responsible for grandchildren