Races in Collierville, Tennessee (TN) Detailed Stats
Data:
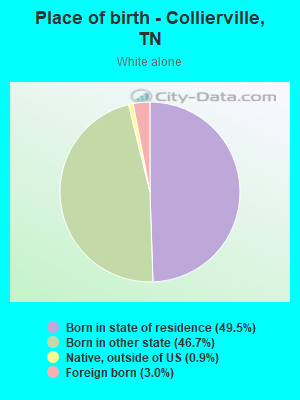
Races - White alone (%)
Races - White alone (% change since 2000)
Races - Black alone (%)
Races - Black alone (% change since 2000)
Races - American Indian alone (%)
Races - American Indian alone (% change since 2000)
Races - Asian alone (%)
Races - Asian alone (% change since 2000)
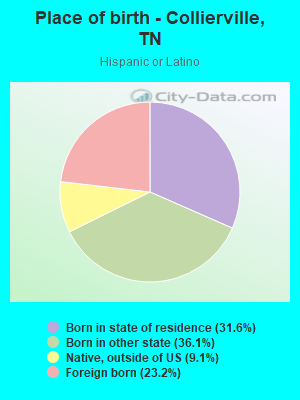
Races - Hispanic (%)
Races - Hispanic (% change since 2000)
Races - Native Hawaiian and Other Pacific Islander alone (%)
Races - Native Hawaiian and Other Pacific Islander alone (% change since 2000)
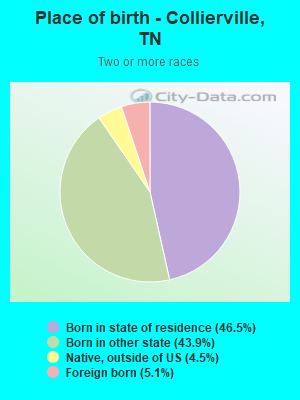
Races - Two or more races(%)
Races - Two or more races(% change since 2000)
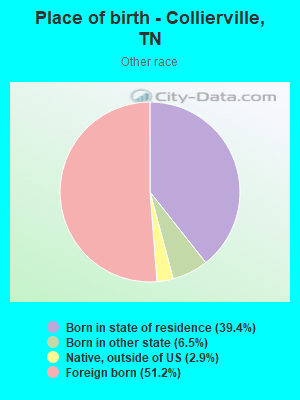
Races - Other race alone (%)
Races - Other race alone (% change since 2000)
Racial diversity
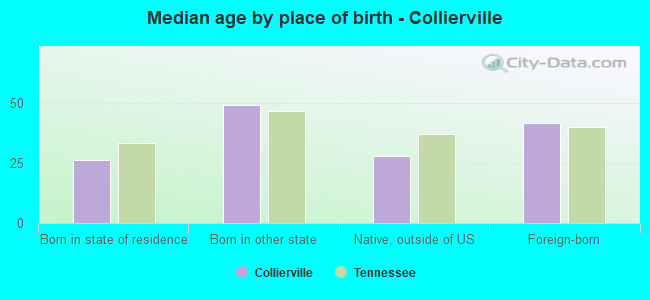
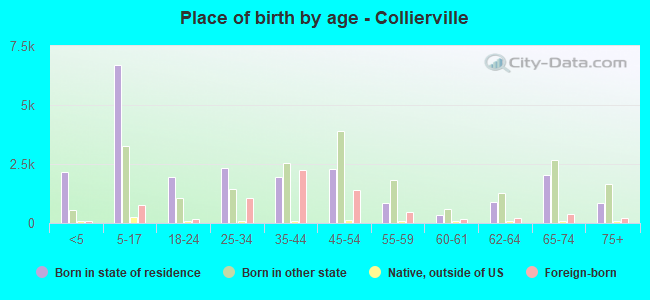
Place of birth - Born in state of residence (%)
Place of birth - Born in state of residence (%) - White
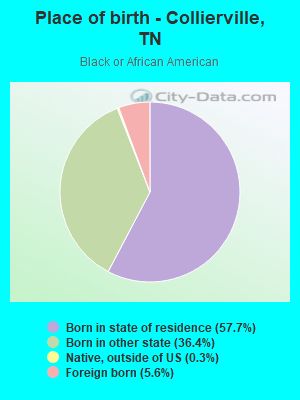
Place of birth - Born in state of residence (%) - Black or African American
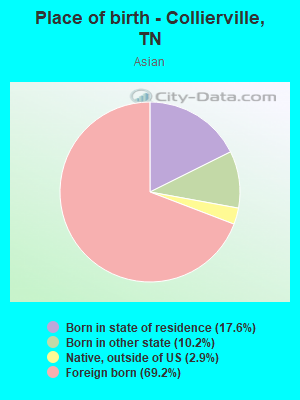
Place of birth - Born in state of residence (%) - Asian
Place of birth - Born in state of residence (%) - Hispanic or Latino
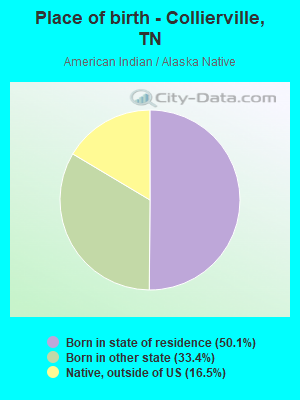
Place of birth - Born in state of residence (%) - American Indian and Alaska Native
Place of birth - Born in state of residence (%) - Multirace
Place of birth - Born in state of residence (%) - Other Race
Place of birth - Born in other state (%)
Place of birth - Born in other state (%) - White
Place of birth - Born in other state (%) - Black or African American
Place of birth - Born in other state (%) - Asian
Place of birth - Born in other state (%) - Hispanic or Latino
Place of birth - Born in other state (%) - American Indian and Alaska Native
Place of birth - Born in other state (%) - Multirace
Place of birth - Born in other state (%) - Other Race
Place of birth - Native, outside of US (%)
Place of birth - Native, outside of US (%) - White
Place of birth - Native, outside of US (%) - Black or African American
Place of birth - Native, outside of US (%) - Asian
Place of birth - Native, outside of US (%) - Hispanic or Latino
Place of birth - Native, outside of US (%) - American Indian and Alaska Native
Place of birth - Native, outside of US (%) - Multirace
Place of birth - Native, outside of US (%) - Other Race
Place of birth - Foreign born (%)
Place of birth - Foreign born (%) - White
Place of birth - Foreign born (%) - Black or African American
Place of birth - Foreign born (%) - Asian
Place of birth - Foreign born (%) - Hispanic or Latino
Place of birth - Foreign born (%) - American Indian and Alaska Native
Place of birth - Foreign born (%) - Multirace
Place of birth - Foreign born (%) - Other Race
Residents speaking English at home (%)
Residents speaking English at home - Born in the United States (%)
Residents speaking English at home - Native, born elsewhere (%)
Residents speaking English at home - Foreign born (%)
Residents speaking Spanish at home (%)
Residents speaking Spanish at home - Born in the United States (%)
Residents speaking Spanish at home - Native, born elsewhere (%)
Residents speaking Spanish at home - Foreign born (%)
Residents speaking other language at home (%)
Residents speaking other language at home - Born in the United States (%)
Residents speaking other language at home - Native, born elsewhere (%)
Residents speaking other language at home - Foreign born (%)
Marital status - Never married (%)
Marital status - Now married (%)
Marital status - Separated (%)
Marital status - Widowed (%)
Marital status - Divorced (%)
Ancestries Reported - Arab (%)
Ancestries Reported - Czech (%)
Ancestries Reported - Danish (%)
Ancestries Reported - Dutch (%)
Ancestries Reported - English (%)
Ancestries Reported - French (%)
Ancestries Reported - French Canadian (%)
Ancestries Reported - German (%)
Ancestries Reported - Greek (%)
Ancestries Reported - Hungarian (%)
Ancestries Reported - Irish (%)
Ancestries Reported - Italian (%)
Ancestries Reported - Lithuanian (%)
Ancestries Reported - Norwegian (%)
Ancestries Reported - Polish (%)
Ancestries Reported - Portuguese (%)
Ancestries Reported - Russian (%)
Ancestries Reported - Scotch-Irish (%)
Ancestries Reported - Scottish (%)
Ancestries Reported - Slovak (%)
Ancestries Reported - Subsaharan African (%)
Ancestries Reported - Swedish (%)
Ancestries Reported - Swiss (%)
Ancestries Reported - Ukrainian (%)
Ancestries Reported - United States (%)
Ancestries Reported - Welsh (%)
Ancestries Reported - West Indian (%)
Ancestries Reported - Other (%)
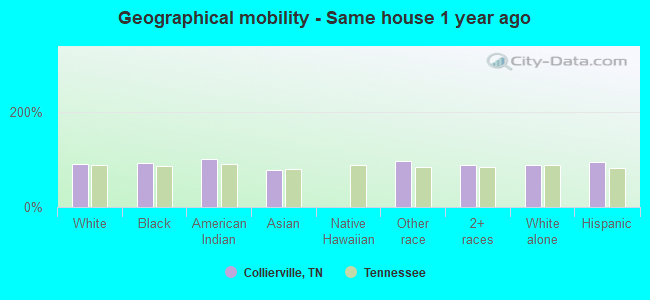
Geographical mobility - Same house 1 year ago (%)
Geographical mobility - Same house 1 year ago (%) - White
Geographical mobility - Same house 1 year ago (%) - Black or African American
Geographical mobility - Same house 1 year ago (%) - Asian
Geographical mobility - Same house 1 year ago (%) - Hispanic or Latino
Geographical mobility - Same house 1 year ago (%) - American Indian and Alaska Native
Geographical mobility - Same house 1 year ago (%) - Multirace
Geographical mobility - Same house 1 year ago (%) - Other Race
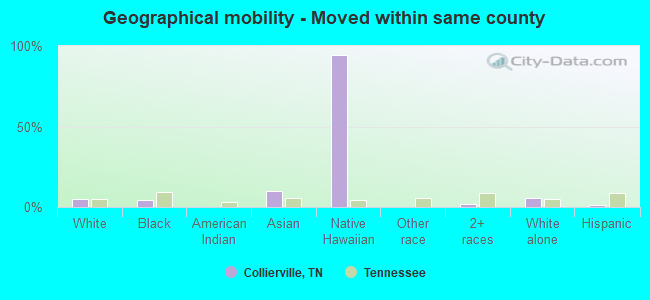
Geographical mobility - Moved within same county (%)
Geographical mobility - Moved within same county (%) - White
Geographical mobility - Moved within same county (%) - Black or African American
Geographical mobility - Moved within same county (%) - Asian
Geographical mobility - Moved within same county (%) - Hispanic or Latino
Geographical mobility - Moved within same county (%) - American Indian and Alaska Native
Geographical mobility - Moved within same county (%) - Multirace
Geographical mobility - Moved within same county (%) - Other Race
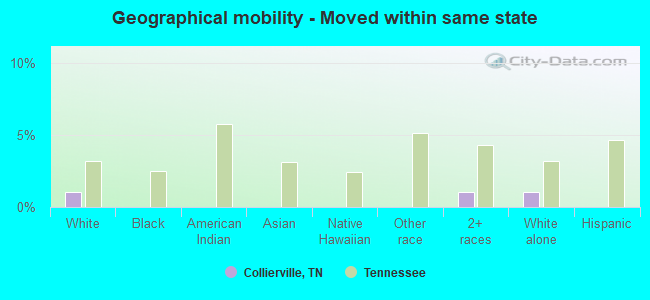
Geographical mobility - Moved from different county within same state (%)
Geographical mobility - Moved from different county within same state (%) - White
Geographical mobility - Moved from different county within same state (%) - Black or African American
Geographical mobility - Moved from different county within same state (%) - Asian
Geographical mobility - Moved from different county within same state (%) - Hispanic or Latino
Geographical mobility - Moved from different county within same state (%) - American Indian and Alaska Native
Geographical mobility - Moved from different county within same state (%) - Multirace
Geographical mobility - Moved from different county within same state (%) - Other Race
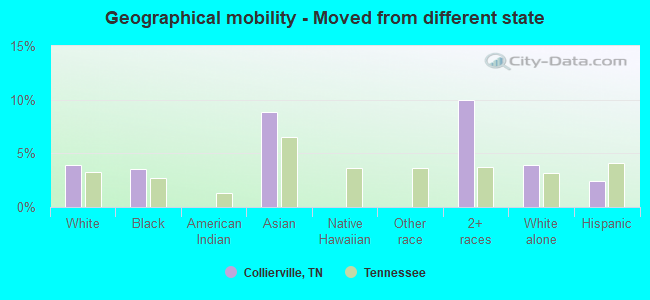
Geographical mobility - Moved from different state (%)
Geographical mobility - Moved from different state (%) - White
Geographical mobility - Moved from different state (%) - Black or African American
Geographical mobility - Moved from different state (%) - Asian
Geographical mobility - Moved from different state (%) - Hispanic or Latino
Geographical mobility - Moved from different state (%) - American Indian and Alaska Native
Geographical mobility - Moved from different state (%) - Multirace
Geographical mobility - Moved from different state (%) - Other Race
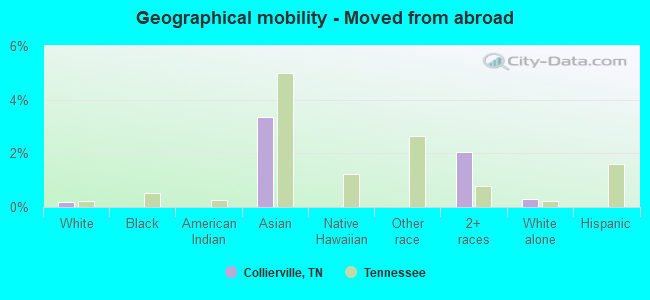
Geographical mobility - Moved from abroad (%)
Geographical mobility - Moved from abroad (%) - White
Geographical mobility - Moved from abroad (%) - Black or African American
Geographical mobility - Moved from abroad (%) - Asian
Geographical mobility - Moved from abroad (%) - Hispanic or Latino
Geographical mobility - Moved from abroad (%) - American Indian and Alaska Native
Geographical mobility - Moved from abroad (%) - Multirace
Geographical mobility - Moved from abroad (%) - Other Race
Place of birth for the foreign-born population - Ireland (%)
Place of birth for the foreign-born population - Denmark (%)
Place of birth for the foreign-born population - Norway (%)
Place of birth for the foreign-born population - Sweden (%)
Place of birth for the foreign-born population - United Kingdom (%)
Place of birth for the foreign-born population - England (%)
Place of birth for the foreign-born population - Scotland (%)
Place of birth for the foreign-born population - Other Northern Europe (%)
Place of birth for the foreign-born population - Austria (%)
Place of birth for the foreign-born population - Belgium (%)
Place of birth for the foreign-born population - France (%)
Place of birth for the foreign-born population - Germany (%)
Place of birth for the foreign-born population - Netherlands (%)
Place of birth for the foreign-born population - Switzerland (%)
Place of birth for the foreign-born population - Other Western Europe (%)
Place of birth for the foreign-born population - Greece (%)
Place of birth for the foreign-born population - Italy (%)
Place of birth for the foreign-born population - Portugal (%)
Place of birth for the foreign-born population - Spain (%)
Place of birth for the foreign-born population - Other Southern Europe (%)
Place of birth for the foreign-born population - Albania (%)
Place of birth for the foreign-born population - Belarus (%)
Place of birth for the foreign-born population - Bosnia and Herzegovina (%)
Place of birth for the foreign-born population - Bulgaria (%)
Place of birth for the foreign-born population - Croatia (%)
Place of birth for the foreign-born population - Czechoslovakia (%)
Place of birth for the foreign-born population - Hungary (%)
Place of birth for the foreign-born population - Latvia (%)
Place of birth for the foreign-born population - Lithuania (%)
Place of birth for the foreign-born population - North Macedonia (Macedonia) (%)
Place of birth for the foreign-born population - Moldova (%)
Place of birth for the foreign-born population - Poland (%)
Place of birth for the foreign-born population - Romania (%)
Place of birth for the foreign-born population - Russia (%)
Place of birth for the foreign-born population - Serbia (%)
Place of birth for the foreign-born population - Ukraine (%)
Place of birth for the foreign-born population - Other Eastern Europe (%)
Place of birth for the foreign-born population - China (%)
Place of birth for the foreign-born population - Hong Kong (%)
Place of birth for the foreign-born population - Taiwan (%)
Place of birth for the foreign-born population - Japan (%)
Place of birth for the foreign-born population - Korea (%)
Place of birth for the foreign-born population - Other Eastern Asia (%)
Place of birth for the foreign-born population - Afghanistan (%)
Place of birth for the foreign-born population - Bangladesh (%)
Place of birth for the foreign-born population - India (%)
Place of birth for the foreign-born population - Iran (%)
Place of birth for the foreign-born population - Kazakhstan (%)
Place of birth for the foreign-born population - Nepal (%)
Place of birth for the foreign-born population - Pakistan (%)
Place of birth for the foreign-born population - Sri Lanka (%)
Place of birth for the foreign-born population - Uzbekistan (%)
Place of birth for the foreign-born population - Other South Central Asia (%)
Place of birth for the foreign-born population - Burma (%)
Place of birth for the foreign-born population - Cambodia (%)
Place of birth for the foreign-born population - Indonesia (%)
Place of birth for the foreign-born population - Laos (%)
Place of birth for the foreign-born population - Malaysia (%)
Place of birth for the foreign-born population - Philippines (%)
Place of birth for the foreign-born population - Singapore (%)
Place of birth for the foreign-born population - Thailand (%)
Place of birth for the foreign-born population - Vietnam (%)
Place of birth for the foreign-born population - Other South Eastern Asia (%)
Place of birth for the foreign-born population - Armenia (%)
Place of birth for the foreign-born population - Iraq (%)
Place of birth for the foreign-born population - Israel (%)
Place of birth for the foreign-born population - Jordan (%)
Place of birth for the foreign-born population - Kuwait (%)
Place of birth for the foreign-born population - Lebanon (%)
Place of birth for the foreign-born population - Saudi Arabia (%)
Place of birth for the foreign-born population - Syria (%)
Place of birth for the foreign-born population - Turkey (%)
Place of birth for the foreign-born population - Yemen (%)
Place of birth for the foreign-born population - Other Western Asia (%)
Place of birth for the foreign-born population - Eritrea (%)
Place of birth for the foreign-born population - Ethiopia (%)
Place of birth for the foreign-born population - Kenya (%)
Place of birth for the foreign-born population - Somalia (%)
Place of birth for the foreign-born population - Uganda (%)
Place of birth for the foreign-born population - Zimbabwe (%)
Place of birth for the foreign-born population - Other Eastern Africa (%)
Place of birth for the foreign-born population - Cameroon (%)
Place of birth for the foreign-born population - Congo (%)
Place of birth for the foreign-born population - Democratic Republic of Congo (Zaire) (%)
Place of birth for the foreign-born population - Other Middle Africa (%)
Place of birth for the foreign-born population - Egypt (%)
Place of birth for the foreign-born population - Morocco (%)
Place of birth for the foreign-born population - Sudan (%)
Place of birth for the foreign-born population - Other Northern Africa (%)
Place of birth for the foreign-born population - South Africa (%)
Place of birth for the foreign-born population - Other Southern Africa (%)
Place of birth for the foreign-born population - Cabo Verde (%)
Place of birth for the foreign-born population - Ghana (%)
Place of birth for the foreign-born population - Liberia (%)
Place of birth for the foreign-born population - Nigeria (%)
Place of birth for the foreign-born population - Senegal (%)
Place of birth for the foreign-born population - Sierra Leone (%)
Place of birth for the foreign-born population - Other Western Africa (%)
Place of birth for the foreign-born population - Australia (%)
Place of birth for the foreign-born population - New Zealand (%)
Place of birth for the foreign-born population - Fiji (%)
Place of birth for the foreign-born population - Micronesia (%)
Place of birth for the foreign-born population - Bahamas (%)
Place of birth for the foreign-born population - Barbados (%)
Place of birth for the foreign-born population - Cuba (%)
Place of birth for the foreign-born population - Dominica (%)
Place of birth for the foreign-born population - Dominican Republic (%)
Place of birth for the foreign-born population - Grenada (%)
Place of birth for the foreign-born population - Haiti (%)
Place of birth for the foreign-born population - Jamaica (%)
Place of birth for the foreign-born population - St. Vincent and the Grenadines (%)
Place of birth for the foreign-born population - Trinidad and Tobago (%)
Place of birth for the foreign-born population - West Indies (%)
Place of birth for the foreign-born population - Other Caribbean (%)
Place of birth for the foreign-born population - Belize (%)
Place of birth for the foreign-born population - Costa Rica (%)
Place of birth for the foreign-born population - El Salvador (%)
Place of birth for the foreign-born population - Guatemala (%)
Place of birth for the foreign-born population - Honduras (%)
Place of birth for the foreign-born population - Mexico (%)
Place of birth for the foreign-born population - Nicaragua (%)
Place of birth for the foreign-born population - Panama (%)
Place of birth for the foreign-born population - Other Central America (%)
Place of birth for the foreign-born population - Argentina (%)
Place of birth for the foreign-born population - Bolivia (%)
Place of birth for the foreign-born population - Brazil (%)
Place of birth for the foreign-born population - Chile (%)
Place of birth for the foreign-born population - Colombia (%)
Place of birth for the foreign-born population - Ecuador (%)
Place of birth for the foreign-born population - Guyana (%)
Place of birth for the foreign-born population - Peru (%)
Place of birth for the foreign-born population - Uruguay (%)
Place of birth for the foreign-born population - Venezuela (%)
Place of birth for the foreign-born population - Other South America (%)
Place of birth for the foreign-born population - Canada (%)
Place of birth for the foreign-born population - Other Northern America (%)
Place of birth for the foreign-born population - Other (%)
Latest news about races in Collierville, TN collected exclusively by city-data.com from local newspapers, TV, and radio stations
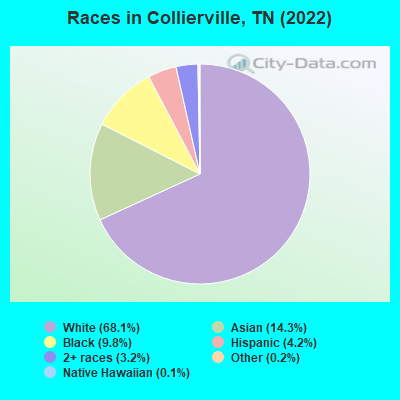
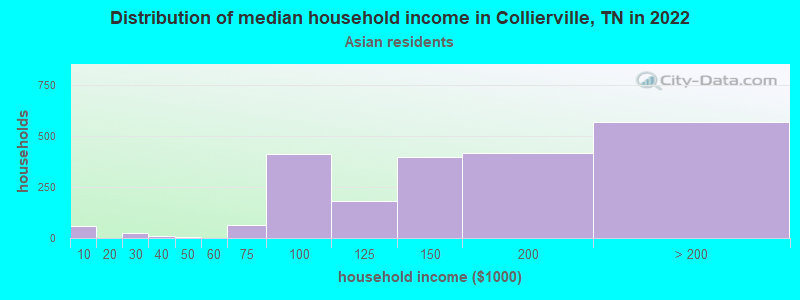
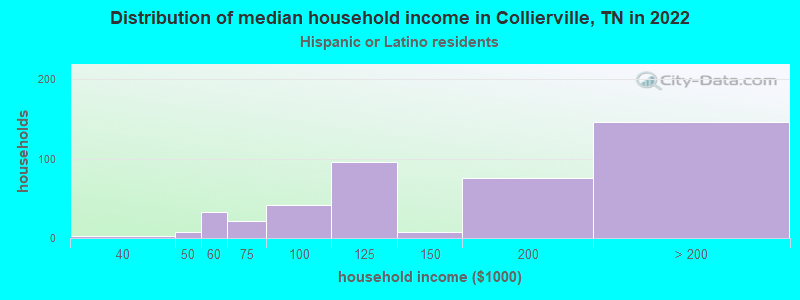
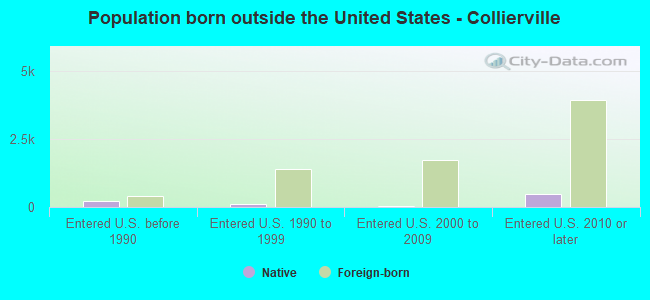
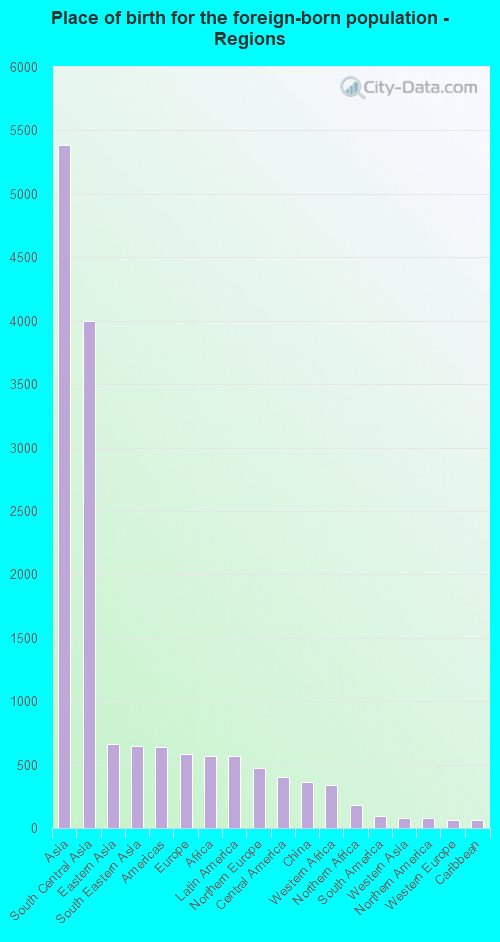
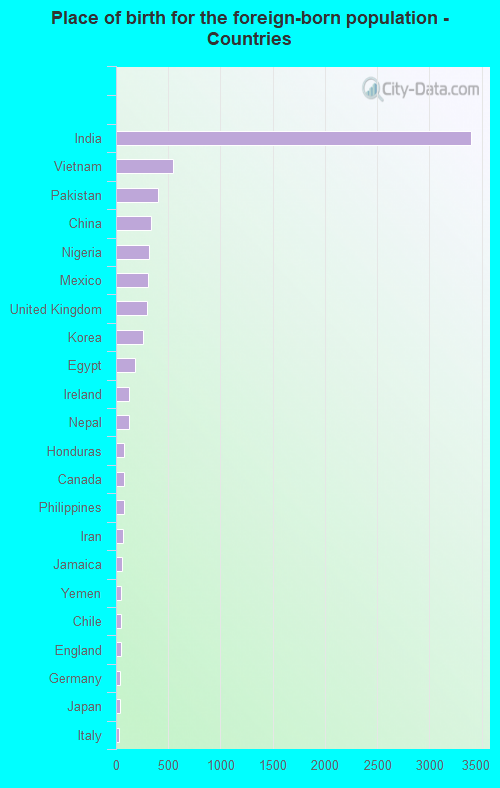
According to 2022 data, the most numerous races in Collierville, TN are White alone (34,447 residents), Black alone (4,953 residents), and Hispanic (2,133 residents). 84.6% of Collierville residents speak English at home. 14.2% of Collierville, TN residents are foreign-born (10.1% born in Asia), which is 64.7% greater than the foreign-born rate of 5.0% across the entire state of Tennessee.
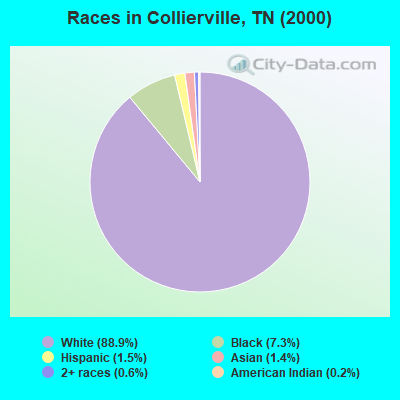
Race distribution in Collierville
2000 2022
4,505,930 79.2% White alone 928,204 16.3% Black alone 123,838 2.2% Hispanic 54,824 1.0% Two or more races 56,077 1.0% Asian alone 13,820 0.2% American Indian alone 4,780 0.08% Other race alone 1,810 0.03% Native Hawaiian and Other
5,070,026 71.9% White alone 1,089,738 15.5% Black alone 442,629 6.3% Hispanic 279,381 4.0% Two or more races 131,817 1.9% Asian alone 26,972 0.4% Other race alone 6,387 0.09% American Indian alone 4,389 0.06% Native Hawaiian and Other
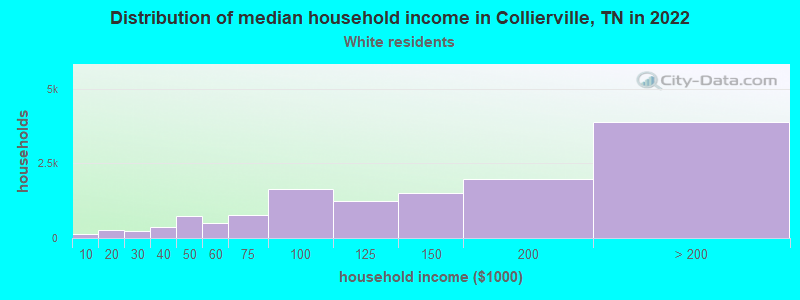
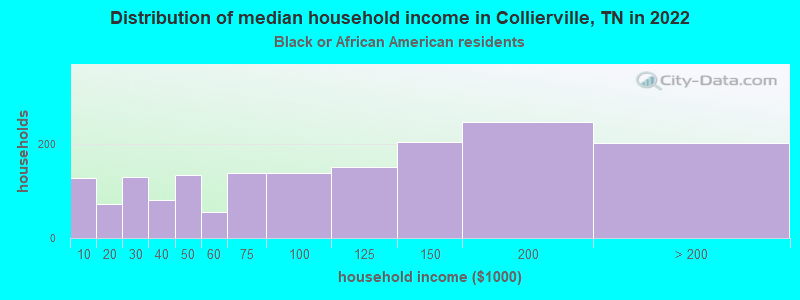
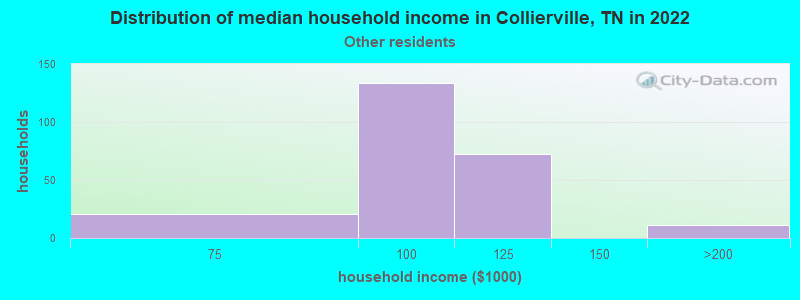
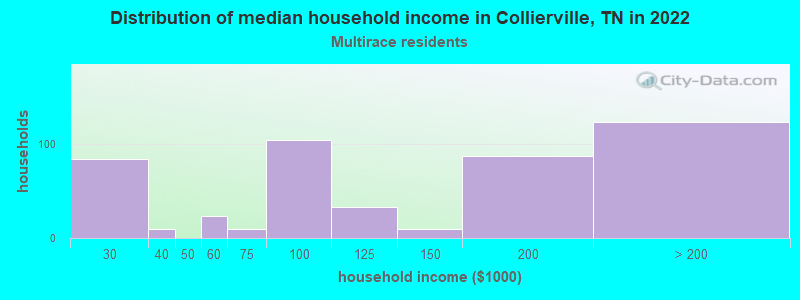
Income and house value in Collierville Median household income in 2022 $134,802 White non-Hispanic householders$104,140 Black householders$135,434 Asian householders$120,022 Some other race householders$115,577 Two or more races householders$125,723 Hispanic or Latino race householdersMedian 2022 house value $502,345 White Non-Hispanic householders$221,000 Black or African American householders$561,644 American Indian or Alaska Native householders $410,131 Asian householders$537,611 Two or more races householders$727,786 Hispanic or Latino householders
Median age by race in Collierville
44.8 Median age for White residents42.1 46.0 40.8 Median age for Black or African American residents47.5 39.4 29.3 Median age for American Indian / Alaska Native residents-1,325,757,574.4 35.5 37.0 Median age for Asian residents37.6 33.7 17.7 Median age for Native Hawaiian / Pacific Islander residents-951,707,890.7 -671,105,192.4 11.7 Median age for Other race residents27.0 9.3 19.7 Median age for Two or more races residents22.2 18.3 44.6 Median age for White alone residents41.8 45.6 14.9 Median age for Hispanic or Latino residents29.1 11.2
Owner/renter occupied households by race in Collierville
House owners and renters - White residents 11,223 85.6% Owner occupied1,884 14.4% Renter occupiedHouse owners and renters - Black or African American residents 1,255 76.5% Owner occupied386 23.5% Renter occupiedHouse owners and renters - American Indian / Alaska Native residents 1 100.0% Owner occupiedHouse owners and renters - Asian residents 1,367 63.0% Owner occupied803 37.0% Renter occupiedHouse owners and renters - Native Hawaiian / Pacific Islander residents 18 100.0% Renter occupiedHouse owners and renters - Other race residents 110 43.5% Owner occupied143 56.5% Renter occupiedHouse owners and renters - Two or more races residents 342 78.3% Owner occupied95 21.7% Renter occupiedHouse owners and renters - White alone residents 11,257 85.5% Owner occupied1,913 14.5% Renter occupiedHouse owners and renters - Hispanic or Latino residents 235 64.6% Owner occupied129 35.4% Renter occupied
Language usage in Collierville
English speakers - Total 84.6% of residents of Collierville speak English at home.
1.7% of residents speak Spanish at home 608 75.8% Speak English very well194 24.2% Speak English less than very well13.5% of residents speak other language at home 5,264 81.7% Speak English very well1,177 18.3% Speak English less than very well
English speakers - Born in the United States 96.1% of residents of Collierville speak English at home.
0.9% of residents speak Spanish at home 159 83.7% Speak English very well31 16.3% Speak English less than very well2.2% of residents speak other language at home 442 97.6% Speak English very well11 2.4% Speak English less than very well
English speakers - Native, born elsewhere 74.7% of residents of Collierville speak English at home.
13.1% of residents speak Spanish at home 77 88.5% Speak English very well10 11.5% Speak English less than very well18.2% of residents speak other language at home 63 52.1% Speak English very well58 47.9% Speak English less than very well
English speakers - Foreign-born 22.3% of residents of Collierville speak English at home.
3.9% of residents speak Spanish at home 145 51.6% Speak English very well136 48.4% Speak English less than very well69.7% of residents speak other language at home 3,902 78.2% Speak English very well1,085 21.8% Speak English less than very well
White (Caucasian) - Speak only English Native:
99.3% (31,618)Foreign-born:
63.9% (626)
White (Caucasian) - Speak another language Native:
1.3% (420)Foreign-born:
32.7% (320)
Black or African American - Speak only English Native:
97.9% (4,358)Foreign-born:
22.4% (63)
Black or African American - Speak another language Native:
2.1% (94)Foreign-born:
72.8% (204)
Asian - Speak only English Native:
42.4% (771)Foreign-born:
17.3% (852)
Asian - Speak another language Native:
52.3% (951)Foreign-born:
82.6% (4,066)
Other race - Speak only English Native:
27.9% (82)Foreign-born:
5.7% (27)
Other race - Speak another language Native:
72.1% (211)Foreign-born:
94.3% (448)
Two or more races - Speak only English Native:
94.9% (1,680)Foreign-born:
85.1% (94)
Two or more races - Speak another language Native:
5.7% (101)Foreign-born:
50.2% (55)
White alone - Speak only English Native:
98.3% (31,287)Foreign-born:
48.7% (501)
White alone - Speak another language Native:
1.7% (548)Foreign-born:
42.3% (435)
Hispanic or Latino - Speak only English Native:
81.1% (995)Foreign-born:
45.5% (220)
Hispanic or Latino - Speak another language Native:
23.9% (293)Foreign-born:
58.1% (281)
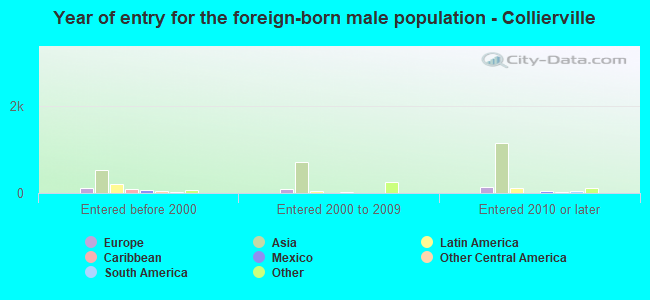
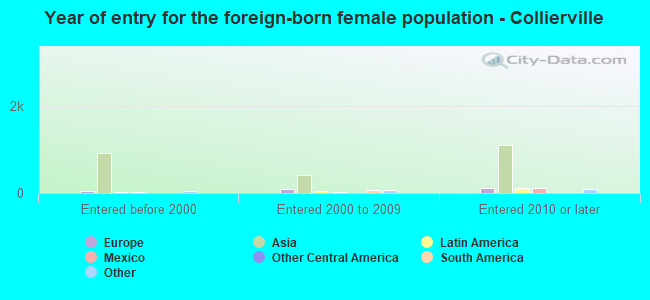
Foreign-born residents in Collierville 7,175 residents are foreign born (10.1% Asia ).
This city:
14.2%Tennessee:
5.4%
Marital status for residents in Collierville Marital status - White (Caucasian) population 15 years and over
Males 23.9% Never married65.9% Now married1.4% Separated1.9% Widowed6.9% DivorcedFemales 19.5% Never married59.5% Now married0.7% Separated9.3% Widowed10.9% DivorcedWomen who gave birth in the past 12 months Now married:
95.8% (232)Unmarried:
4.2% (10)
Women who did not give birth in the past 12 months Now married:
54.9% (3,910)Unmarried:
45.1% (3,219)
Marital status - Black or African American population 15 years and over
Males 31.6% Never married59.0% Now married1.0% Separated2.1% Widowed6.3% DivorcedFemales 47.7% Never married39.4% Now married3.3% Separated5.6% Widowed4.0% DivorcedWomen who gave birth in the past 12 months Now married:
73.5% (25)Unmarried:
26.5% (9)
Women who did not give birth in the past 12 months Now married:
33.5% (515)Unmarried:
66.5% (1,023)
Marital status - Asian population 15 years and over
Males 15.4% Never married81.8% Now married0.5% Separated0.5% Widowed1.8% DivorcedFemales 10.7% Never married82.2% Now married0.4% Separated4.0% Widowed2.7% DivorcedWomen who gave birth in the past 12 months Now married:
100.0% (42)Unmarried:
0.0% (0)
Women who did not give birth in the past 12 months Now married:
83.5% (1,776)Unmarried:
16.5% (350)
Marital status - Native Hawaiian / Pacific Islander population 15 years and over
Males 0.0% Never married100.0% Now married0.0% Separated0.0% Widowed0.0% DivorcedFemales 0.0% Never married100.0% Now married0.0% Separated0.0% Widowed0.0% DivorcedWomen who did not give birth in the past 12 months Now married:
100.0% (12)Unmarried:
0.0% (0)
Marital status - Other race population 15 years and over
Males 7.3% Never married92.7% Now married0.0% Separated0.0% Widowed0.0% DivorcedFemales 9.2% Never married90.8% Now married0.0% Separated0.0% Widowed0.0% DivorcedWomen who did not give birth in the past 12 months Now married:
90.1% (202)Unmarried:
9.9% (22)
Marital status - Two or more races population 15 years and over
Males 50.5% Never married46.1% Now married0.0% Separated0.0% Widowed3.4% DivorcedFemales 32.4% Never married40.5% Now married0.0% Separated13.9% Widowed13.1% DivorcedWomen who gave birth in the past 12 months Now married:
100.0% (10)Unmarried:
0.0% (0)
Women who did not give birth in the past 12 months Now married:
40.1% (156)Unmarried:
59.9% (233)
Marital status - White alone, not Hispanic / Latino population 15 years and over
Males 23.7% Never married66.5% Now married1.2% Separated1.6% Widowed7.1% DivorcedFemales 19.4% Never married59.4% Now married0.7% Separated9.4% Widowed11.1% DivorcedWomen who gave birth in the past 12 months Now married:
95.6% (232)Unmarried:
4.4% (11)
Women who did not give birth in the past 12 months Now married:
54.6% (3,969)Unmarried:
45.4% (3,304)
Marital status - Hispanic or Latino population 15 years and over
Males 28.9% Never married56.7% Now married5.5% Separated7.7% Widowed1.2% DivorcedFemales 30.0% Never married61.7% Now married0.0% Separated0.7% Widowed7.6% DivorcedWomen who gave birth in the past 12 months Now married:
100.0% (11)Unmarried:
0.0% (0)
Women who did not give birth in the past 12 months Now married:
64.0% (233)Unmarried:
36.0% (131)
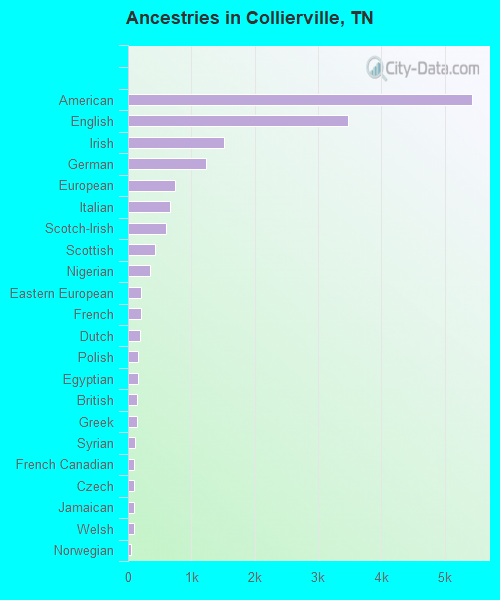
Ancestries in Collierville
5,429 17.8% American3,477 11.4% English1,519 5.0% Irish1,226 4.0% German741 2.4% European670 2.2% Italian607 2.0% Scotch-Irish420 1.4% Scottish345 1.1% Nigerian211 0.7% Eastern European210 0.7% French182 0.6% Dutch164 0.5% Polish155 0.5% Egyptian148 0.5% British137 0.4% Greek114 0.4% Syrian95 0.3% French Canadian93 0.3% Czech91 0.3% Jamaican91 0.3% Welsh54 0.2% Norwegian40 0.1% Swedish37 0.1% Hungarian36 0.1% Canadian29 0.10% Swiss28 0.09% Belgian28 0.09% Moroccan27 0.09% Kenyan19 0.06% Lithuanian15 0.05% Portuguese14 0.05% African11 0.04% Scandinavian8 0.03% Latvian6 0.02% Danish3 0.01% Finnish
Geographical mobility in Collierville Same house 1 year ago 30,543 89.5% White (Caucasian)4,537 92.6% Black or African American41 100.0% American Indian / Alaska Native5,477 76.5% Asian954 96.3% Other race1,939 86.6% Two or more races30,623 89.4% White alone, not Hispanic / Latino2,012 95.1% Hispanic or LatinoMoved within same county 1,767 5.2% White / Caucasian206 4.2% Black or African American699 9.8% Asian37 94.6% Native Hawaiian / Pacific Islander43 1.9% Two or more races1,808 5.3% White alone, not Hispanic / Latino30 1.4% Hispanic or LatinoMoved within same state 347 1.0% White / Caucasian24 1.1% Two or more races354 1.0% White alone, not Hispanic / LatinoMoved from different state 1,335 3.9% White / Caucasian172 3.5% Black or African American631 8.8% Asian224 10.0% Two or more races1,340 3.9% White alone, not Hispanic / Latino52 2.4% Hispanic or LatinoMoved from abroad 69 0.2% White240 3.3% Asian46 2.1% Two or more races107 0.3% White alone, not Hispanic / Latino
Children Nativity (place of birth) in Collierville
Children under 6 years - Living with two parents Both parents native 2,001 100.0% NativeBoth parents foreign-born 573 83.3% Native115 16.7% Foreign-bornOne native, one foreign-born parent 172 100.0% NativeChildren under 6 years - Living with one parent Native parent 388 100.0% NativeChildren 6 to 17 years - Living with two parents Both parents native 5,682 100.0% NativeBoth parents foreign-born 1,136 54.8% Native938 45.2% Foreign-bornOne native, one foreign-born parent 527 100.0% NativeChildren 6 to 17 years - Living with one parent Native parent 1,321 100.0% NativeForeign-born parent 160 48.3% Native171 51.7% Foreign-born
Grandparents responsible for own grandchildren in Collierville
Grandparents (30 to 59 years) White / Caucasian 18 28.5% Responsible for grandchildren44 71.5% Not responsible for grandchildrenBlack or African American 4 39.1% Responsible for grandchildren6 60.9% Not responsible for grandchildrenAsian 5 100.0% Not responsible for grandchildrenOther race 45 100.0% Not responsible for grandchildrenWhite alone, not Hispanic / Latino 16 31.3% Responsible for grandchildren36 68.7% Not responsible for grandchildrenHispanic or Latino 53 100.0% Not responsible for grandchildrenGrandparents (60 years and over) White / Caucasian 199 59.3% Responsible for grandchildren136 40.7% Not responsible for grandchildrenBlack or African American 51 64.0% Responsible for grandchildren29 36.0% Not responsible for grandchildrenAsian 127 100.0% Not responsible for grandchildrenWhite alone, not Hispanic / Latino 203 60.8% Responsible for grandchildren131 39.2% Not responsible for grandchildrenHispanic or Latino 65 100.0% Not responsible for grandchildren