Races in Columbia, Maryland (MD) Detailed Stats
Data:
Races - White alone (%)
Races - White alone (% change since 2000)
Races - Black alone (%)
Races - Black alone (% change since 2000)
Races - American Indian alone (%)
Races - American Indian alone (% change since 2000)
Races - Asian alone (%)
Races - Asian alone (% change since 2000)
Races - Hispanic (%)
Races - Hispanic (% change since 2000)
Races - Native Hawaiian and Other Pacific Islander alone (%)
Races - Native Hawaiian and Other Pacific Islander alone (% change since 2000)
Races - Two or more races(%)
Races - Two or more races(% change since 2000)
Races - Other race alone (%)
Races - Other race alone (% change since 2000)
Racial diversity
Place of birth - Born in state of residence (%)
Place of birth - Born in state of residence (%) - White
Place of birth - Born in state of residence (%) - Black or African American
Place of birth - Born in state of residence (%) - Asian
Place of birth - Born in state of residence (%) - Hispanic or Latino
Place of birth - Born in state of residence (%) - American Indian and Alaska Native
Place of birth - Born in state of residence (%) - Multirace
Place of birth - Born in state of residence (%) - Other Race
Place of birth - Born in other state (%)
Place of birth - Born in other state (%) - White
Place of birth - Born in other state (%) - Black or African American
Place of birth - Born in other state (%) - Asian
Place of birth - Born in other state (%) - Hispanic or Latino
Place of birth - Born in other state (%) - American Indian and Alaska Native
Place of birth - Born in other state (%) - Multirace
Place of birth - Born in other state (%) - Other Race
Place of birth - Native, outside of US (%)
Place of birth - Native, outside of US (%) - White
Place of birth - Native, outside of US (%) - Black or African American
Place of birth - Native, outside of US (%) - Asian
Place of birth - Native, outside of US (%) - Hispanic or Latino
Place of birth - Native, outside of US (%) - American Indian and Alaska Native
Place of birth - Native, outside of US (%) - Multirace
Place of birth - Native, outside of US (%) - Other Race
Place of birth - Foreign born (%)
Place of birth - Foreign born (%) - White
Place of birth - Foreign born (%) - Black or African American
Place of birth - Foreign born (%) - Asian
Place of birth - Foreign born (%) - Hispanic or Latino
Place of birth - Foreign born (%) - American Indian and Alaska Native
Place of birth - Foreign born (%) - Multirace
Place of birth - Foreign born (%) - Other Race
Residents speaking English at home (%)
Residents speaking English at home - Born in the United States (%)
Residents speaking English at home - Native, born elsewhere (%)
Residents speaking English at home - Foreign born (%)
Residents speaking Spanish at home (%)
Residents speaking Spanish at home - Born in the United States (%)
Residents speaking Spanish at home - Native, born elsewhere (%)
Residents speaking Spanish at home - Foreign born (%)
Residents speaking other language at home (%)
Residents speaking other language at home - Born in the United States (%)
Residents speaking other language at home - Native, born elsewhere (%)
Residents speaking other language at home - Foreign born (%)
Marital status - Never married (%)
Marital status - Now married (%)
Marital status - Separated (%)
Marital status - Widowed (%)
Marital status - Divorced (%)
Ancestries Reported - Arab (%)
Ancestries Reported - Czech (%)
Ancestries Reported - Danish (%)
Ancestries Reported - Dutch (%)
Ancestries Reported - English (%)
Ancestries Reported - French (%)
Ancestries Reported - French Canadian (%)
Ancestries Reported - German (%)
Ancestries Reported - Greek (%)
Ancestries Reported - Hungarian (%)
Ancestries Reported - Irish (%)
Ancestries Reported - Italian (%)
Ancestries Reported - Lithuanian (%)
Ancestries Reported - Norwegian (%)
Ancestries Reported - Polish (%)
Ancestries Reported - Portuguese (%)
Ancestries Reported - Russian (%)
Ancestries Reported - Scotch-Irish (%)
Ancestries Reported - Scottish (%)
Ancestries Reported - Slovak (%)
Ancestries Reported - Subsaharan African (%)
Ancestries Reported - Swedish (%)
Ancestries Reported - Swiss (%)
Ancestries Reported - Ukrainian (%)
Ancestries Reported - United States (%)
Ancestries Reported - Welsh (%)
Ancestries Reported - West Indian (%)
Ancestries Reported - Other (%)
Geographical mobility - Same house 1 year ago (%)
Geographical mobility - Same house 1 year ago (%) - White
Geographical mobility - Same house 1 year ago (%) - Black or African American
Geographical mobility - Same house 1 year ago (%) - Asian
Geographical mobility - Same house 1 year ago (%) - Hispanic or Latino
Geographical mobility - Same house 1 year ago (%) - American Indian and Alaska Native
Geographical mobility - Same house 1 year ago (%) - Multirace
Geographical mobility - Same house 1 year ago (%) - Other Race
Geographical mobility - Moved within same county (%)
Geographical mobility - Moved within same county (%) - White
Geographical mobility - Moved within same county (%) - Black or African American
Geographical mobility - Moved within same county (%) - Asian
Geographical mobility - Moved within same county (%) - Hispanic or Latino
Geographical mobility - Moved within same county (%) - American Indian and Alaska Native
Geographical mobility - Moved within same county (%) - Multirace
Geographical mobility - Moved within same county (%) - Other Race
Geographical mobility - Moved from different county within same state (%)
Geographical mobility - Moved from different county within same state (%) - White
Geographical mobility - Moved from different county within same state (%) - Black or African American
Geographical mobility - Moved from different county within same state (%) - Asian
Geographical mobility - Moved from different county within same state (%) - Hispanic or Latino
Geographical mobility - Moved from different county within same state (%) - American Indian and Alaska Native
Geographical mobility - Moved from different county within same state (%) - Multirace
Geographical mobility - Moved from different county within same state (%) - Other Race
Geographical mobility - Moved from different state (%)
Geographical mobility - Moved from different state (%) - White
Geographical mobility - Moved from different state (%) - Black or African American
Geographical mobility - Moved from different state (%) - Asian
Geographical mobility - Moved from different state (%) - Hispanic or Latino
Geographical mobility - Moved from different state (%) - American Indian and Alaska Native
Geographical mobility - Moved from different state (%) - Multirace
Geographical mobility - Moved from different state (%) - Other Race
Geographical mobility - Moved from abroad (%)
Geographical mobility - Moved from abroad (%) - White
Geographical mobility - Moved from abroad (%) - Black or African American
Geographical mobility - Moved from abroad (%) - Asian
Geographical mobility - Moved from abroad (%) - Hispanic or Latino
Geographical mobility - Moved from abroad (%) - American Indian and Alaska Native
Geographical mobility - Moved from abroad (%) - Multirace
Geographical mobility - Moved from abroad (%) - Other Race
Place of birth for the foreign-born population - Ireland (%)
Place of birth for the foreign-born population - Denmark (%)
Place of birth for the foreign-born population - Norway (%)
Place of birth for the foreign-born population - Sweden (%)
Place of birth for the foreign-born population - United Kingdom (%)
Place of birth for the foreign-born population - England (%)
Place of birth for the foreign-born population - Scotland (%)
Place of birth for the foreign-born population - Other Northern Europe (%)
Place of birth for the foreign-born population - Austria (%)
Place of birth for the foreign-born population - Belgium (%)
Place of birth for the foreign-born population - France (%)
Place of birth for the foreign-born population - Germany (%)
Place of birth for the foreign-born population - Netherlands (%)
Place of birth for the foreign-born population - Switzerland (%)
Place of birth for the foreign-born population - Other Western Europe (%)
Place of birth for the foreign-born population - Greece (%)
Place of birth for the foreign-born population - Italy (%)
Place of birth for the foreign-born population - Portugal (%)
Place of birth for the foreign-born population - Spain (%)
Place of birth for the foreign-born population - Other Southern Europe (%)
Place of birth for the foreign-born population - Albania (%)
Place of birth for the foreign-born population - Belarus (%)
Place of birth for the foreign-born population - Bosnia and Herzegovina (%)
Place of birth for the foreign-born population - Bulgaria (%)
Place of birth for the foreign-born population - Croatia (%)
Place of birth for the foreign-born population - Czechoslovakia (%)
Place of birth for the foreign-born population - Hungary (%)
Place of birth for the foreign-born population - Latvia (%)
Place of birth for the foreign-born population - Lithuania (%)
Place of birth for the foreign-born population - North Macedonia (Macedonia) (%)
Place of birth for the foreign-born population - Moldova (%)
Place of birth for the foreign-born population - Poland (%)
Place of birth for the foreign-born population - Romania (%)
Place of birth for the foreign-born population - Russia (%)
Place of birth for the foreign-born population - Serbia (%)
Place of birth for the foreign-born population - Ukraine (%)
Place of birth for the foreign-born population - Other Eastern Europe (%)
Place of birth for the foreign-born population - China (%)
Place of birth for the foreign-born population - Hong Kong (%)
Place of birth for the foreign-born population - Taiwan (%)
Place of birth for the foreign-born population - Japan (%)
Place of birth for the foreign-born population - Korea (%)
Place of birth for the foreign-born population - Other Eastern Asia (%)
Place of birth for the foreign-born population - Afghanistan (%)
Place of birth for the foreign-born population - Bangladesh (%)
Place of birth for the foreign-born population - India (%)
Place of birth for the foreign-born population - Iran (%)
Place of birth for the foreign-born population - Kazakhstan (%)
Place of birth for the foreign-born population - Nepal (%)
Place of birth for the foreign-born population - Pakistan (%)
Place of birth for the foreign-born population - Sri Lanka (%)
Place of birth for the foreign-born population - Uzbekistan (%)
Place of birth for the foreign-born population - Other South Central Asia (%)
Place of birth for the foreign-born population - Burma (%)
Place of birth for the foreign-born population - Cambodia (%)
Place of birth for the foreign-born population - Indonesia (%)
Place of birth for the foreign-born population - Laos (%)
Place of birth for the foreign-born population - Malaysia (%)
Place of birth for the foreign-born population - Philippines (%)
Place of birth for the foreign-born population - Singapore (%)
Place of birth for the foreign-born population - Thailand (%)
Place of birth for the foreign-born population - Vietnam (%)
Place of birth for the foreign-born population - Other South Eastern Asia (%)
Place of birth for the foreign-born population - Armenia (%)
Place of birth for the foreign-born population - Iraq (%)
Place of birth for the foreign-born population - Israel (%)
Place of birth for the foreign-born population - Jordan (%)
Place of birth for the foreign-born population - Kuwait (%)
Place of birth for the foreign-born population - Lebanon (%)
Place of birth for the foreign-born population - Saudi Arabia (%)
Place of birth for the foreign-born population - Syria (%)
Place of birth for the foreign-born population - Turkey (%)
Place of birth for the foreign-born population - Yemen (%)
Place of birth for the foreign-born population - Other Western Asia (%)
Place of birth for the foreign-born population - Eritrea (%)
Place of birth for the foreign-born population - Ethiopia (%)
Place of birth for the foreign-born population - Kenya (%)
Place of birth for the foreign-born population - Somalia (%)
Place of birth for the foreign-born population - Uganda (%)
Place of birth for the foreign-born population - Zimbabwe (%)
Place of birth for the foreign-born population - Other Eastern Africa (%)
Place of birth for the foreign-born population - Cameroon (%)
Place of birth for the foreign-born population - Congo (%)
Place of birth for the foreign-born population - Democratic Republic of Congo (Zaire) (%)
Place of birth for the foreign-born population - Other Middle Africa (%)
Place of birth for the foreign-born population - Egypt (%)
Place of birth for the foreign-born population - Morocco (%)
Place of birth for the foreign-born population - Sudan (%)
Place of birth for the foreign-born population - Other Northern Africa (%)
Place of birth for the foreign-born population - South Africa (%)
Place of birth for the foreign-born population - Other Southern Africa (%)
Place of birth for the foreign-born population - Cabo Verde (%)
Place of birth for the foreign-born population - Ghana (%)
Place of birth for the foreign-born population - Liberia (%)
Place of birth for the foreign-born population - Nigeria (%)
Place of birth for the foreign-born population - Senegal (%)
Place of birth for the foreign-born population - Sierra Leone (%)
Place of birth for the foreign-born population - Other Western Africa (%)
Place of birth for the foreign-born population - Australia (%)
Place of birth for the foreign-born population - New Zealand (%)
Place of birth for the foreign-born population - Fiji (%)
Place of birth for the foreign-born population - Micronesia (%)
Place of birth for the foreign-born population - Bahamas (%)
Place of birth for the foreign-born population - Barbados (%)
Place of birth for the foreign-born population - Cuba (%)
Place of birth for the foreign-born population - Dominica (%)
Place of birth for the foreign-born population - Dominican Republic (%)
Place of birth for the foreign-born population - Grenada (%)
Place of birth for the foreign-born population - Haiti (%)
Place of birth for the foreign-born population - Jamaica (%)
Place of birth for the foreign-born population - St. Vincent and the Grenadines (%)
Place of birth for the foreign-born population - Trinidad and Tobago (%)
Place of birth for the foreign-born population - West Indies (%)
Place of birth for the foreign-born population - Other Caribbean (%)
Place of birth for the foreign-born population - Belize (%)
Place of birth for the foreign-born population - Costa Rica (%)
Place of birth for the foreign-born population - El Salvador (%)
Place of birth for the foreign-born population - Guatemala (%)
Place of birth for the foreign-born population - Honduras (%)
Place of birth for the foreign-born population - Mexico (%)
Place of birth for the foreign-born population - Nicaragua (%)
Place of birth for the foreign-born population - Panama (%)
Place of birth for the foreign-born population - Other Central America (%)
Place of birth for the foreign-born population - Argentina (%)
Place of birth for the foreign-born population - Bolivia (%)
Place of birth for the foreign-born population - Brazil (%)
Place of birth for the foreign-born population - Chile (%)
Place of birth for the foreign-born population - Colombia (%)
Place of birth for the foreign-born population - Ecuador (%)
Place of birth for the foreign-born population - Guyana (%)
Place of birth for the foreign-born population - Peru (%)
Place of birth for the foreign-born population - Uruguay (%)
Place of birth for the foreign-born population - Venezuela (%)
Place of birth for the foreign-born population - Other South America (%)
Place of birth for the foreign-born population - Canada (%)
Place of birth for the foreign-born population - Other Northern America (%)
Place of birth for the foreign-born population - Other (%)
Latest news about races in Columbia, MD collected exclusively by city-data.com from local newspapers, TV, and radio stations
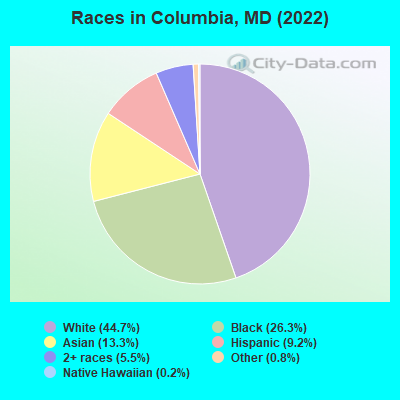
According to 2022 data, the most numerous races in Columbia, MD are White alone (45,446 residents), Black alone (26,768 residents), and Hispanic (9,319 residents). 72.8% of Columbia residents speak English at home. 21.9% of Columbia, MD residents are foreign-born (10.0% born in Asia, 4.6% born in Latin America, 3.8% born in Africa), which is 26.9% greater than the foreign-born rate of 16.0% across the entire state of Maryland.
Race distribution in Columbia
2000 2022
56,794 64.4% White alone 18,721 21.2% Black alone 6,422 7.3% Asian alone 3,636 4.1% Hispanic 2,135 2.4% Two or more races 298 0.3% Other race alone 208 0.2% American Indian alone 40 0.05% Native Hawaiian and Other
45,446 44.7% White alone 26,768 26.3% Black alone 13,514 13.3% Asian alone 9,319 9.2% Hispanic 5,587 5.5% Two or more races 847 0.8% Other race alone 200 0.2% Native Hawaiian and Other 53 0.05% American Indian alone
2000 2022
3,286,547 62.1% White alone 1,464,735 27.7% Black alone 227,916 4.3% Hispanic 209,738 4.0% Asian alone 82,946 1.6% Two or more races 13,312 0.3% American Indian alone 9,379 0.2% Other race alone 1,913 0.04% Native Hawaiian and Other
2,906,492 47.1% White alone 1,800,914 29.2% Black alone 705,842 11.4% Hispanic 401,818 6.5% Asian alone 291,317 4.7% Two or more races 46,930 0.8% Other race alone 8,930 0.1% American Indian alone 2,417 0.04% Native Hawaiian and Other
Income and house value in Columbia Median household income in 2022 $133,966 White non-Hispanic householders$93,414 Black householders$106,014 Asian householders$74,111 Some other race householders$103,315 Two or more races householders$96,444 Hispanic or Latino race householdersMedian 2022 house value $509,276 White Non-Hispanic householders$453,920 Black or African American householders$392,198 American Indian or Alaska Native householders $544,150 Asian householders$265,155 Some other race householders$467,205 Two or more races householders$445,616 Hispanic or Latino householders
Median age by race in Columbia
43.1 Median age for White residents40.8 48.5 41.3 Median age for Black or African American residents37.8 43.2 46.7 Median age for American Indian / Alaska Native residents-666,666,666.0 51.5 43.4 Median age for Asian residents44.2 42.4 66.2 Median age for Native Hawaiian / Pacific Islander residents67.2 -760,942,760.2 34.9 Median age for Other race residents34.6 36.4 23.4 Median age for Two or more races residents30.8 20.2 43.6 Median age for White alone residents41.5 48.4 34.1 Median age for Hispanic or Latino residents35.7 31.0
Owner/renter occupied households by race in Columbia
House owners and renters - White residents 15,218 68.1% Owner occupied7,119 31.9% Renter occupiedHouse owners and renters - Black or African American residents 5,344 50.3% Owner occupied5,288 49.7% Renter occupiedHouse owners and renters - American Indian / Alaska Native residents 123 79.2% Owner occupied32 20.8% Renter occupiedHouse owners and renters - Asian residents 2,281 57.3% Owner occupied1,699 42.7% Renter occupiedHouse owners and renters - Native Hawaiian / Pacific Islander residents 5 100.0% Owner occupiedHouse owners and renters - Other race residents 487 49.1% Owner occupied504 50.9% Renter occupiedHouse owners and renters - Two or more races residents 1,742 65.8% Owner occupied907 34.2% Renter occupiedHouse owners and renters - White alone residents 15,141 68.0% Owner occupied7,119 32.0% Renter occupiedHouse owners and renters - Hispanic or Latino residents 1,135 56.4% Owner occupied879 43.6% Renter occupied
Language usage in Columbia
English speakers - Total 72.8% of residents of Columbia speak English at home.
7.3% of residents speak Spanish at home 5,140 72.5% Speak English very well1,951 27.5% Speak English less than very well19.9% of residents speak other language at home 12,426 64.7% Speak English very well6,767 35.3% Speak English less than very well
English speakers - Born in the United States 90.8% of residents of Columbia speak English at home.
3.2% of residents speak Spanish at home 1,177 89.7% Speak English very well135 10.3% Speak English less than very well6.0% of residents speak other language at home 2,122 86.9% Speak English very well321 13.1% Speak English less than very well
English speakers - Native, born elsewhere 77.0% of residents of Columbia speak English at home.
20.0% of residents speak Spanish at home 121 36.3% Speak English very well212 63.7% Speak English less than very well3.0% of residents speak other language at home 50 100.0% Speak English very well
English speakers - Foreign-born 19.3% of residents of Columbia speak English at home.
15.4% of residents speak Spanish at home 1,867 54.6% Speak English very well1,552 45.4% Speak English less than very well65.4% of residents speak other language at home 8,579 59.1% Speak English very well5,934 40.9% Speak English less than very well
White (Caucasian) - Speak only English Native:
94.4% (38,281)Foreign-born:
24.2% (761)
White (Caucasian) - Speak another language Native:
5.6% (2,290)Foreign-born:
75.8% (2,386)
Black or African American - Speak only English Native:
95.0% (19,451)Foreign-born:
31.1% (1,737)
Black or African American - Speak another language Native:
5.0% (1,017)Foreign-born:
68.9% (3,857)
American Indian / Alaska Native - Speak only English Native:
50.4% (125)Foreign-born:
3.3% (3)
American Indian / Alaska Native - Speak another language Native:
56.2% (139)Foreign-born:
99.1% (89)
Asian - Speak only English Native:
72.5% (2,883)Foreign-born:
13.8% (1,250)
Asian - Speak another language Native:
27.5% (1,095)Foreign-born:
86.2% (7,814)
Other race - Speak only English Native:
37.1% (800)Foreign-born:
14.9% (309)
Other race - Speak another language Native:
62.9% (1,356)Foreign-born:
85.1% (1,767)
Two or more races - Speak only English Native:
61.6% (4,165)Foreign-born:
8.1% (178)
Two or more races - Speak another language Native:
38.4% (2,594)Foreign-born:
91.9% (2,027)
White alone - Speak only English Native:
94.5% (38,102)Foreign-born:
25.8% (761)
White alone - Speak another language Native:
5.5% (2,235)Foreign-born:
74.2% (2,194)
Hispanic or Latino - Speak only English Native:
29.0% (1,477)Foreign-born:
7.8% (280)
Hispanic or Latino - Speak another language Native:
71.0% (3,617)Foreign-born:
92.2% (3,308)
Foreign-born residents in Columbia 23,567 residents are foreign born (10.0% Asia , 4.6% Latin America , 3.8% Africa ).
This city:
21.9%Maryland:
15.7%
Marital status for residents in Columbia Marital status - White (Caucasian) population 15 years and over
Males 32.0% Never married56.6% Now married0.8% Separated1.1% Widowed9.5% DivorcedFemales 23.9% Never married57.9% Now married0.5% Separated8.8% Widowed8.9% DivorcedWomen who gave birth in the past 12 months Now married:
100.0% (341)Unmarried:
0.0% (0)
Women who did not give birth in the past 12 months Now married:
55.2% (5,115)Unmarried:
44.8% (4,154)
Marital status - Black or African American population 15 years and over
Males 40.9% Never married48.2% Now married0.0% Separated1.9% Widowed9.0% DivorcedFemales 33.0% Never married29.4% Now married4.3% Separated8.5% Widowed24.8% DivorcedWomen who gave birth in the past 12 months Now married:
26.3% (98)Unmarried:
73.7% (275)
Women who did not give birth in the past 12 months Now married:
25.4% (2,112)Unmarried:
74.6% (6,214)
Marital status - American Indian / Alaska Native population 15 years and over
Males 13.0% Never married54.5% Now married0.0% Separated0.0% Widowed32.5% DivorcedFemales 26.7% Never married38.7% Now married0.0% Separated12.7% Widowed22.0% DivorcedWomen who did not give birth in the past 12 months Now married:
20.7% (28)Unmarried:
79.3% (109)
Marital status - Asian population 15 years and over
Males 28.6% Never married67.4% Now married0.0% Separated1.2% Widowed2.7% DivorcedFemales 28.0% Never married57.0% Now married0.0% Separated10.9% Widowed4.1% DivorcedWomen who gave birth in the past 12 months Now married:
86.0% (157)Unmarried:
14.0% (26)
Women who did not give birth in the past 12 months Now married:
58.8% (2,059)Unmarried:
41.2% (1,443)
Marital status - Native Hawaiian / Pacific Islander population 15 years and over
Males 0.0% Never married100.0% Now married0.0% Separated0.0% Widowed0.0% DivorcedFemales 0.0% Never married70.6% Now married0.0% Separated0.0% Widowed29.4% DivorcedWomen who did not give birth in the past 12 months Now married:
0.0% (0)Unmarried:
100.0% (5)
Marital status - Other race population 15 years and over
Males 44.4% Never married48.7% Now married0.0% Separated0.0% Widowed7.0% DivorcedFemales 44.5% Never married40.6% Now married0.0% Separated1.9% Widowed12.9% DivorcedWomen who gave birth in the past 12 months Now married:
100.0% (37)Unmarried:
0.0% (0)
Women who did not give birth in the past 12 months Now married:
38.1% (505)Unmarried:
61.9% (821)
Marital status - Two or more races population 15 years and over
Males 31.9% Never married60.1% Now married0.0% Separated0.0% Widowed8.0% DivorcedFemales 38.1% Never married33.3% Now married1.6% Separated2.1% Widowed25.0% DivorcedWomen who gave birth in the past 12 months Now married:
100.0% (70)Unmarried:
0.0% (0)
Women who did not give birth in the past 12 months Now married:
29.3% (723)Unmarried:
70.7% (1,746)
Marital status - White alone, not Hispanic / Latino population 15 years and over
Males 31.1% Never married57.3% Now married0.8% Separated1.1% Widowed9.6% DivorcedFemales 24.0% Never married58.1% Now married0.5% Separated8.4% Widowed8.9% DivorcedWomen who gave birth in the past 12 months Now married:
100.0% (341)Unmarried:
0.0% (0)
Women who did not give birth in the past 12 months Now married:
55.2% (5,115)Unmarried:
44.8% (4,154)
Marital status - Hispanic or Latino population 15 years and over
Males 49.8% Never married31.2% Now married0.0% Separated0.0% Widowed18.9% DivorcedFemales 39.1% Never married38.2% Now married0.0% Separated2.4% Widowed20.4% DivorcedWomen who gave birth in the past 12 months Now married:
51.1% (50)Unmarried:
48.9% (48)
Women who did not give birth in the past 12 months Now married:
39.3% (1,108)Unmarried:
60.7% (1,708)
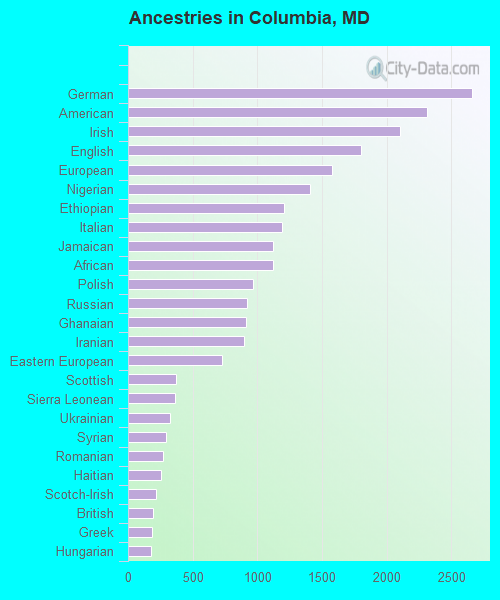
Ancestries in Columbia
2,660 4.3% German2,311 3.7% American2,105 3.4% Irish1,800 2.9% English1,582 2.6% European1,411 2.3% Nigerian1,207 2.0% Ethiopian1,193 1.9% Italian1,122 1.8% Jamaican1,119 1.8% African965 1.6% Polish924 1.5% Russian911 1.5% Ghanaian899 1.5% Iranian731 1.2% Eastern European369 0.6% Scottish363 0.6% Sierra Leonean322 0.5% Ukrainian291 0.5% Syrian269 0.4% Romanian255 0.4% Haitian219 0.4% Scotch-Irish196 0.3% British184 0.3% Greek180 0.3% Hungarian166 0.3% Canadian151 0.2% Egyptian135 0.2% Norwegian128 0.2% Cape Verdean122 0.2% Afghan121 0.2% Kenyan119 0.2% Brazilian115 0.2% Turkish108 0.2% Trinidadian and Tobagonian104 0.2% French Canadian103 0.2% French96 0.2% Swedish89 0.1% Northern European89 0.1% Arab87 0.1% Lithuanian86 0.1% Somali78 0.1% Slavic77 0.1% Guyanese61 0.10% Slovak57 0.09% Liberian54 0.09% Dutch52 0.08% Belgian46 0.07% Lebanese42 0.07% Assyrian41 0.07% Bahamian40 0.06% West Indian39 0.06% Portuguese39 0.06% Danish36 0.06% Scandinavian36 0.06% Macedonian32 0.05% Austrian31 0.05% Czechoslovakian29 0.05% Welsh28 0.05% German Russian28 0.05% British West Indian26 0.04% Pennsylvania German24 0.04% Swiss23 0.04% Moroccan21 0.03% Barbadian19 0.03% Croatian19 0.03% Carpatho Rusyn18 0.03% Maltese13 0.02% Finnish13 0.02% Yugoslavian11 0.02% Palestinian10 0.02% Czech10 0.02% Bulgarian8 0.01% Icelander7 0.01% Sudanese4 0.01% Armenian
Geographical mobility in Columbia Same house 1 year ago 39,054 85.3% White (Caucasian)25,078 93.7% Black or African American359 98.9% American Indian / Alaska Native12,647 87.8% Asian58 84.0% Native Hawaiian / Pacific Islander3,822 89.1% Other race7,659 73.7% Two or more races38,700 85.5% White alone, not Hispanic / Latino8,565 83.9% Hispanic or LatinoMoved within same county 3,568 7.8% White / Caucasian851 3.2% Black or African American318 2.2% Asian5 7.3% Native Hawaiian / Pacific Islander181 4.2% Other race995 9.6% Two or more races3,568 7.9% White alone, not Hispanic / Latino467 4.6% Hispanic or LatinoMoved within same state 1,060 2.3% White / Caucasian410 1.5% Black or African American273 1.9% Asian142 3.3% Other race937 9.0% Two or more races936 2.1% White alone, not Hispanic / Latino799 7.8% Hispanic or LatinoMoved from different state 1,800 3.9% White / Caucasian148 0.6% Black or African American982 6.8% Asian6 9.2% Native Hawaiian / Pacific Islander80 1.9% Other race772 7.4% Two or more races1,800 4.0% White alone, not Hispanic / Latino330 3.2% Hispanic or LatinoMoved from abroad 282 0.6% White281 1.0% Black or African American345 2.4% Asian182 4.2% Other race239 2.3% Two or more races282 0.6% White alone, not Hispanic / Latino233 2.3% Hispanic or Latino
Children Nativity (place of birth) in Columbia
Children under 6 years - Living with two parents Both parents native 2,934 100.0% NativeBoth parents foreign-born 1,051 88.8% Native132 11.2% Foreign-bornOne native, one foreign-born parent 1,123 100.0% NativeChildren under 6 years - Living with one parent Native parent 628 100.0% NativeForeign-born parent 98 100.0% NativeChildren 6 to 17 years - Living with two parents Both parents native 4,199 100.0% NativeBoth parents foreign-born 2,841 87.0% Native424 13.0% Foreign-bornOne native, one foreign-born parent 1,339 100.0% NativeChildren 6 to 17 years - Living with one parent Native parent 1,581 100.0% NativeForeign-born parent 1,478 58.8% Native1,037 41.2% Foreign-born
Place of birth for residents in Columbia 11,403 Asia5,517 Americas5,200 Latin America4,581 Eastern Asia4,494 South Central Asia4,374 Africa2,828 China2,633 Western Africa2,563 Central America2,252 Europe1,421 South Eastern Asia1,358 South America1,278 Caribbean1,084 Eastern Europe952 Eastern Africa905 Western Asia606 Western Europe519 Middle Africa472 Northern Europe316 Northern America197 Northern Africa88 Southern Europe39 Southern Africa20 Oceania20 Australia and New Zealand Subregion2,501 India2,219 China1,708 Korea1,035 El Salvador900 Nigeria876 Honduras703 Ethiopia686 Jamaica614 Philippines611 Pakistan603 Ghana593 Iran495 Sierra Leone463 Russia445 Bangladesh394 Mexico392 Colombia363 Taiwan331 Brazil322 Cameroon320 Haiti316 Canada315 Vietnam299 Germany297 United Kingdom245 Hong Kong242 Guatemala235 Kenya223 Syria213 Peru195 Belgium191 Israel190 Democratic Republic of Congo (Zaire)186 Poland183 Thailand143 Nepal133 Afghanistan125 Iraq121 Venezuela110 England108 Trinidad and Tobago108 Indonesia106 Egypt104 Turkey103 Guyana99 Burma (Myanmar)92 Ivory Coast89 Cuba89 Ukraine86 Togo84 Hungary84 Moldova83 Kuwait79 Romania78 Argentina70 Lebanon69 Senegal67 Spain65 Liberia52 Malaysia51 Ecuador47 Cambodia45 Sri Lanka43 North Macedonia (Macedonia)42 Switzerland39 South Africa33 United Arab Emirates30 Belarus28 France26 Georgia26 Sweden26 Bahamas24 Saudi Arabia24 Austria21 Jordan21 Ireland20 Australia19 Uzbekistan19 Bolivia18 Morocco17 Chile15 Netherlands14 Costa Rica12 Eritrea11 Denmark10 Bosnia and Herzegovina10 Portugal10 Greece9 Bulgaria8 Japan7 Algeria4 Norway1 Sudan1 Latvia
Grandparents responsible for own grandchildren in Columbia
Grandparents (30 to 59 years) White / Caucasian 20 28.3% Responsible for grandchildren51 71.7% Not responsible for grandchildrenBlack or African American 189 66.4% Responsible for grandchildren95 33.6% Not responsible for grandchildrenAsian 48 100.0% Not responsible for grandchildrenWhite alone, not Hispanic / Latino 21 42.9% Responsible for grandchildren27 57.1% Not responsible for grandchildrenHispanic or Latino 33 100.0% Not responsible for grandchildrenGrandparents (60 years and over) White / Caucasian 212 40.5% Responsible for grandchildren311 59.5% Not responsible for grandchildrenBlack or African American 35 11.6% Responsible for grandchildren269 88.4% Not responsible for grandchildrenAsian 466 100.0% Not responsible for grandchildrenWhite alone, not Hispanic / Latino 211 38.8% Responsible for grandchildren333 61.2% Not responsible for grandchildrenHispanic or Latino 22 100.0% Not responsible for grandchildren