Races in Columbus, Nebraska (NE) Detailed Stats
Data:
Races - White alone (%)
Races - White alone (% change since 2000)
Races - Black alone (%)
Races - Black alone (% change since 2000)
Races - American Indian alone (%)
Races - American Indian alone (% change since 2000)
Races - Asian alone (%)
Races - Asian alone (% change since 2000)
Races - Hispanic (%)
Races - Hispanic (% change since 2000)
Races - Native Hawaiian and Other Pacific Islander alone (%)
Races - Native Hawaiian and Other Pacific Islander alone (% change since 2000)
Races - Two or more races(%)
Races - Two or more races(% change since 2000)
Races - Other race alone (%)
Races - Other race alone (% change since 2000)
Racial diversity
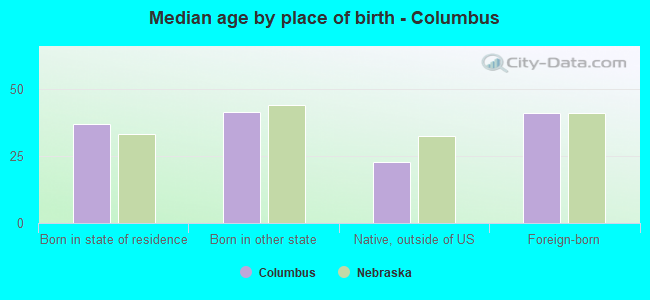
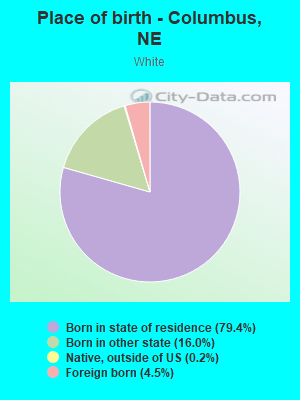
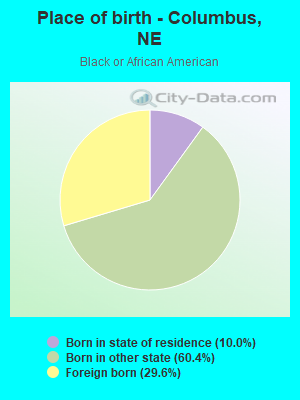
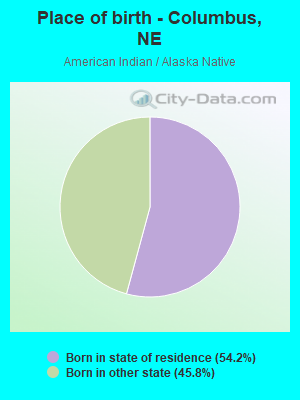
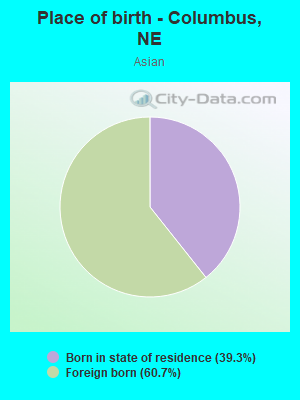
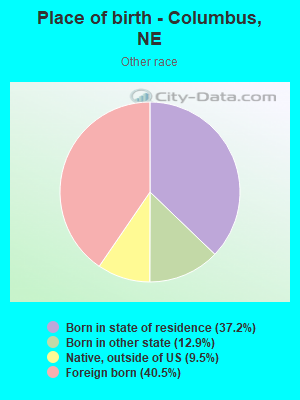
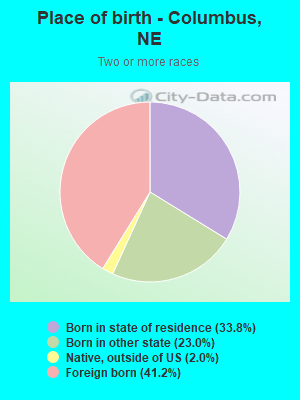
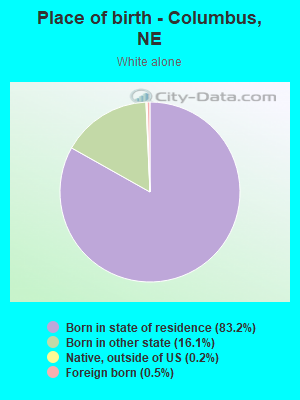
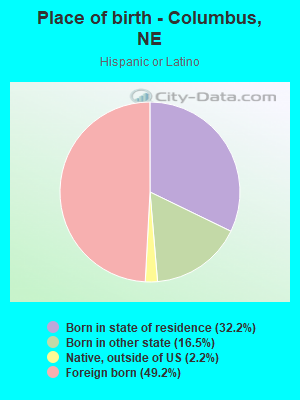
Place of birth - Born in state of residence (%)
Place of birth - Born in state of residence (%) - White
Place of birth - Born in state of residence (%) - Black or African American
Place of birth - Born in state of residence (%) - Asian
Place of birth - Born in state of residence (%) - Hispanic or Latino
Place of birth - Born in state of residence (%) - American Indian and Alaska Native
Place of birth - Born in state of residence (%) - Multirace
Place of birth - Born in state of residence (%) - Other Race
Place of birth - Born in other state (%)
Place of birth - Born in other state (%) - White
Place of birth - Born in other state (%) - Black or African American
Place of birth - Born in other state (%) - Asian
Place of birth - Born in other state (%) - Hispanic or Latino
Place of birth - Born in other state (%) - American Indian and Alaska Native
Place of birth - Born in other state (%) - Multirace
Place of birth - Born in other state (%) - Other Race
Place of birth - Native, outside of US (%)
Place of birth - Native, outside of US (%) - White
Place of birth - Native, outside of US (%) - Black or African American
Place of birth - Native, outside of US (%) - Asian
Place of birth - Native, outside of US (%) - Hispanic or Latino
Place of birth - Native, outside of US (%) - American Indian and Alaska Native
Place of birth - Native, outside of US (%) - Multirace
Place of birth - Native, outside of US (%) - Other Race
Place of birth - Foreign born (%)
Place of birth - Foreign born (%) - White
Place of birth - Foreign born (%) - Black or African American
Place of birth - Foreign born (%) - Asian
Place of birth - Foreign born (%) - Hispanic or Latino
Place of birth - Foreign born (%) - American Indian and Alaska Native
Place of birth - Foreign born (%) - Multirace
Place of birth - Foreign born (%) - Other Race
Residents speaking English at home (%)
Residents speaking English at home - Born in the United States (%)
Residents speaking English at home - Native, born elsewhere (%)
Residents speaking English at home - Foreign born (%)
Residents speaking Spanish at home (%)
Residents speaking Spanish at home - Born in the United States (%)
Residents speaking Spanish at home - Native, born elsewhere (%)
Residents speaking Spanish at home - Foreign born (%)
Residents speaking other language at home (%)
Residents speaking other language at home - Born in the United States (%)
Residents speaking other language at home - Native, born elsewhere (%)
Residents speaking other language at home - Foreign born (%)
Marital status - Never married (%)
Marital status - Now married (%)
Marital status - Separated (%)
Marital status - Widowed (%)
Marital status - Divorced (%)
Ancestries Reported - Arab (%)
Ancestries Reported - Czech (%)
Ancestries Reported - Danish (%)
Ancestries Reported - Dutch (%)
Ancestries Reported - English (%)
Ancestries Reported - French (%)
Ancestries Reported - French Canadian (%)
Ancestries Reported - German (%)
Ancestries Reported - Greek (%)
Ancestries Reported - Hungarian (%)
Ancestries Reported - Irish (%)
Ancestries Reported - Italian (%)
Ancestries Reported - Lithuanian (%)
Ancestries Reported - Norwegian (%)
Ancestries Reported - Polish (%)
Ancestries Reported - Portuguese (%)
Ancestries Reported - Russian (%)
Ancestries Reported - Scotch-Irish (%)
Ancestries Reported - Scottish (%)
Ancestries Reported - Slovak (%)
Ancestries Reported - Subsaharan African (%)
Ancestries Reported - Swedish (%)
Ancestries Reported - Swiss (%)
Ancestries Reported - Ukrainian (%)
Ancestries Reported - United States (%)
Ancestries Reported - Welsh (%)
Ancestries Reported - West Indian (%)
Ancestries Reported - Other (%)
Geographical mobility - Same house 1 year ago (%)
Geographical mobility - Same house 1 year ago (%) - White
Geographical mobility - Same house 1 year ago (%) - Black or African American
Geographical mobility - Same house 1 year ago (%) - Asian
Geographical mobility - Same house 1 year ago (%) - Hispanic or Latino
Geographical mobility - Same house 1 year ago (%) - American Indian and Alaska Native
Geographical mobility - Same house 1 year ago (%) - Multirace
Geographical mobility - Same house 1 year ago (%) - Other Race
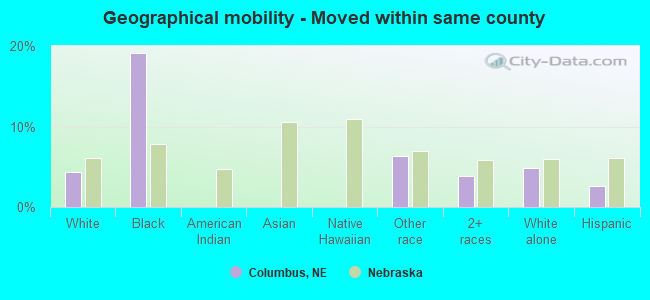
Geographical mobility - Moved within same county (%)
Geographical mobility - Moved within same county (%) - White
Geographical mobility - Moved within same county (%) - Black or African American
Geographical mobility - Moved within same county (%) - Asian
Geographical mobility - Moved within same county (%) - Hispanic or Latino
Geographical mobility - Moved within same county (%) - American Indian and Alaska Native
Geographical mobility - Moved within same county (%) - Multirace
Geographical mobility - Moved within same county (%) - Other Race
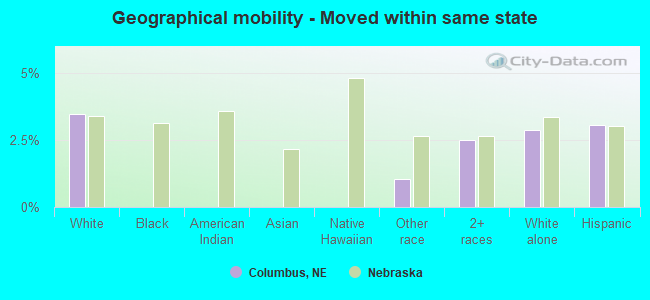
Geographical mobility - Moved from different county within same state (%)
Geographical mobility - Moved from different county within same state (%) - White
Geographical mobility - Moved from different county within same state (%) - Black or African American
Geographical mobility - Moved from different county within same state (%) - Asian
Geographical mobility - Moved from different county within same state (%) - Hispanic or Latino
Geographical mobility - Moved from different county within same state (%) - American Indian and Alaska Native
Geographical mobility - Moved from different county within same state (%) - Multirace
Geographical mobility - Moved from different county within same state (%) - Other Race
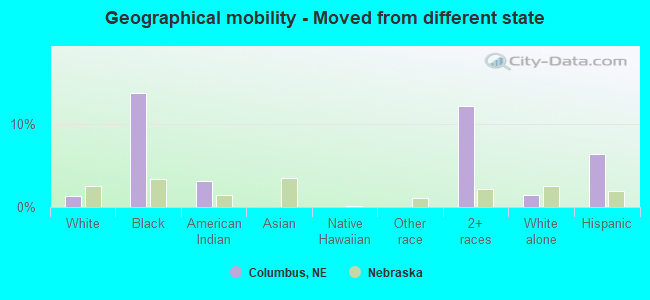
Geographical mobility - Moved from different state (%)
Geographical mobility - Moved from different state (%) - White
Geographical mobility - Moved from different state (%) - Black or African American
Geographical mobility - Moved from different state (%) - Asian
Geographical mobility - Moved from different state (%) - Hispanic or Latino
Geographical mobility - Moved from different state (%) - American Indian and Alaska Native
Geographical mobility - Moved from different state (%) - Multirace
Geographical mobility - Moved from different state (%) - Other Race
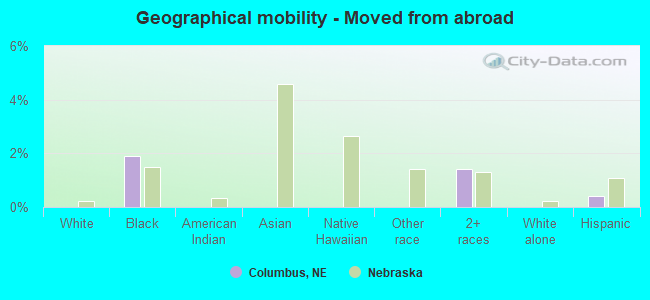
Geographical mobility - Moved from abroad (%)
Geographical mobility - Moved from abroad (%) - White
Geographical mobility - Moved from abroad (%) - Black or African American
Geographical mobility - Moved from abroad (%) - Asian
Geographical mobility - Moved from abroad (%) - Hispanic or Latino
Geographical mobility - Moved from abroad (%) - American Indian and Alaska Native
Geographical mobility - Moved from abroad (%) - Multirace
Geographical mobility - Moved from abroad (%) - Other Race
Place of birth for the foreign-born population - Ireland (%)
Place of birth for the foreign-born population - Denmark (%)
Place of birth for the foreign-born population - Norway (%)
Place of birth for the foreign-born population - Sweden (%)
Place of birth for the foreign-born population - United Kingdom (%)
Place of birth for the foreign-born population - England (%)
Place of birth for the foreign-born population - Scotland (%)
Place of birth for the foreign-born population - Other Northern Europe (%)
Place of birth for the foreign-born population - Austria (%)
Place of birth for the foreign-born population - Belgium (%)
Place of birth for the foreign-born population - France (%)
Place of birth for the foreign-born population - Germany (%)
Place of birth for the foreign-born population - Netherlands (%)
Place of birth for the foreign-born population - Switzerland (%)
Place of birth for the foreign-born population - Other Western Europe (%)
Place of birth for the foreign-born population - Greece (%)
Place of birth for the foreign-born population - Italy (%)
Place of birth for the foreign-born population - Portugal (%)
Place of birth for the foreign-born population - Spain (%)
Place of birth for the foreign-born population - Other Southern Europe (%)
Place of birth for the foreign-born population - Albania (%)
Place of birth for the foreign-born population - Belarus (%)
Place of birth for the foreign-born population - Bosnia and Herzegovina (%)
Place of birth for the foreign-born population - Bulgaria (%)
Place of birth for the foreign-born population - Croatia (%)
Place of birth for the foreign-born population - Czechoslovakia (%)
Place of birth for the foreign-born population - Hungary (%)
Place of birth for the foreign-born population - Latvia (%)
Place of birth for the foreign-born population - Lithuania (%)
Place of birth for the foreign-born population - North Macedonia (Macedonia) (%)
Place of birth for the foreign-born population - Moldova (%)
Place of birth for the foreign-born population - Poland (%)
Place of birth for the foreign-born population - Romania (%)
Place of birth for the foreign-born population - Russia (%)
Place of birth for the foreign-born population - Serbia (%)
Place of birth for the foreign-born population - Ukraine (%)
Place of birth for the foreign-born population - Other Eastern Europe (%)
Place of birth for the foreign-born population - China (%)
Place of birth for the foreign-born population - Hong Kong (%)
Place of birth for the foreign-born population - Taiwan (%)
Place of birth for the foreign-born population - Japan (%)
Place of birth for the foreign-born population - Korea (%)
Place of birth for the foreign-born population - Other Eastern Asia (%)
Place of birth for the foreign-born population - Afghanistan (%)
Place of birth for the foreign-born population - Bangladesh (%)
Place of birth for the foreign-born population - India (%)
Place of birth for the foreign-born population - Iran (%)
Place of birth for the foreign-born population - Kazakhstan (%)
Place of birth for the foreign-born population - Nepal (%)
Place of birth for the foreign-born population - Pakistan (%)
Place of birth for the foreign-born population - Sri Lanka (%)
Place of birth for the foreign-born population - Uzbekistan (%)
Place of birth for the foreign-born population - Other South Central Asia (%)
Place of birth for the foreign-born population - Burma (%)
Place of birth for the foreign-born population - Cambodia (%)
Place of birth for the foreign-born population - Indonesia (%)
Place of birth for the foreign-born population - Laos (%)
Place of birth for the foreign-born population - Malaysia (%)
Place of birth for the foreign-born population - Philippines (%)
Place of birth for the foreign-born population - Singapore (%)
Place of birth for the foreign-born population - Thailand (%)
Place of birth for the foreign-born population - Vietnam (%)
Place of birth for the foreign-born population - Other South Eastern Asia (%)
Place of birth for the foreign-born population - Armenia (%)
Place of birth for the foreign-born population - Iraq (%)
Place of birth for the foreign-born population - Israel (%)
Place of birth for the foreign-born population - Jordan (%)
Place of birth for the foreign-born population - Kuwait (%)
Place of birth for the foreign-born population - Lebanon (%)
Place of birth for the foreign-born population - Saudi Arabia (%)
Place of birth for the foreign-born population - Syria (%)
Place of birth for the foreign-born population - Turkey (%)
Place of birth for the foreign-born population - Yemen (%)
Place of birth for the foreign-born population - Other Western Asia (%)
Place of birth for the foreign-born population - Eritrea (%)
Place of birth for the foreign-born population - Ethiopia (%)
Place of birth for the foreign-born population - Kenya (%)
Place of birth for the foreign-born population - Somalia (%)
Place of birth for the foreign-born population - Uganda (%)
Place of birth for the foreign-born population - Zimbabwe (%)
Place of birth for the foreign-born population - Other Eastern Africa (%)
Place of birth for the foreign-born population - Cameroon (%)
Place of birth for the foreign-born population - Congo (%)
Place of birth for the foreign-born population - Democratic Republic of Congo (Zaire) (%)
Place of birth for the foreign-born population - Other Middle Africa (%)
Place of birth for the foreign-born population - Egypt (%)
Place of birth for the foreign-born population - Morocco (%)
Place of birth for the foreign-born population - Sudan (%)
Place of birth for the foreign-born population - Other Northern Africa (%)
Place of birth for the foreign-born population - South Africa (%)
Place of birth for the foreign-born population - Other Southern Africa (%)
Place of birth for the foreign-born population - Cabo Verde (%)
Place of birth for the foreign-born population - Ghana (%)
Place of birth for the foreign-born population - Liberia (%)
Place of birth for the foreign-born population - Nigeria (%)
Place of birth for the foreign-born population - Senegal (%)
Place of birth for the foreign-born population - Sierra Leone (%)
Place of birth for the foreign-born population - Other Western Africa (%)
Place of birth for the foreign-born population - Australia (%)
Place of birth for the foreign-born population - New Zealand (%)
Place of birth for the foreign-born population - Fiji (%)
Place of birth for the foreign-born population - Micronesia (%)
Place of birth for the foreign-born population - Bahamas (%)
Place of birth for the foreign-born population - Barbados (%)
Place of birth for the foreign-born population - Cuba (%)
Place of birth for the foreign-born population - Dominica (%)
Place of birth for the foreign-born population - Dominican Republic (%)
Place of birth for the foreign-born population - Grenada (%)
Place of birth for the foreign-born population - Haiti (%)
Place of birth for the foreign-born population - Jamaica (%)
Place of birth for the foreign-born population - St. Vincent and the Grenadines (%)
Place of birth for the foreign-born population - Trinidad and Tobago (%)
Place of birth for the foreign-born population - West Indies (%)
Place of birth for the foreign-born population - Other Caribbean (%)
Place of birth for the foreign-born population - Belize (%)
Place of birth for the foreign-born population - Costa Rica (%)
Place of birth for the foreign-born population - El Salvador (%)
Place of birth for the foreign-born population - Guatemala (%)
Place of birth for the foreign-born population - Honduras (%)
Place of birth for the foreign-born population - Mexico (%)
Place of birth for the foreign-born population - Nicaragua (%)
Place of birth for the foreign-born population - Panama (%)
Place of birth for the foreign-born population - Other Central America (%)
Place of birth for the foreign-born population - Argentina (%)
Place of birth for the foreign-born population - Bolivia (%)
Place of birth for the foreign-born population - Brazil (%)
Place of birth for the foreign-born population - Chile (%)
Place of birth for the foreign-born population - Colombia (%)
Place of birth for the foreign-born population - Ecuador (%)
Place of birth for the foreign-born population - Guyana (%)
Place of birth for the foreign-born population - Peru (%)
Place of birth for the foreign-born population - Uruguay (%)
Place of birth for the foreign-born population - Venezuela (%)
Place of birth for the foreign-born population - Other South America (%)
Place of birth for the foreign-born population - Canada (%)
Place of birth for the foreign-born population - Other Northern America (%)
Place of birth for the foreign-born population - Other (%)
Latest news about races in Columbus, NE collected exclusively by city-data.com from local newspapers, TV, and radio stations
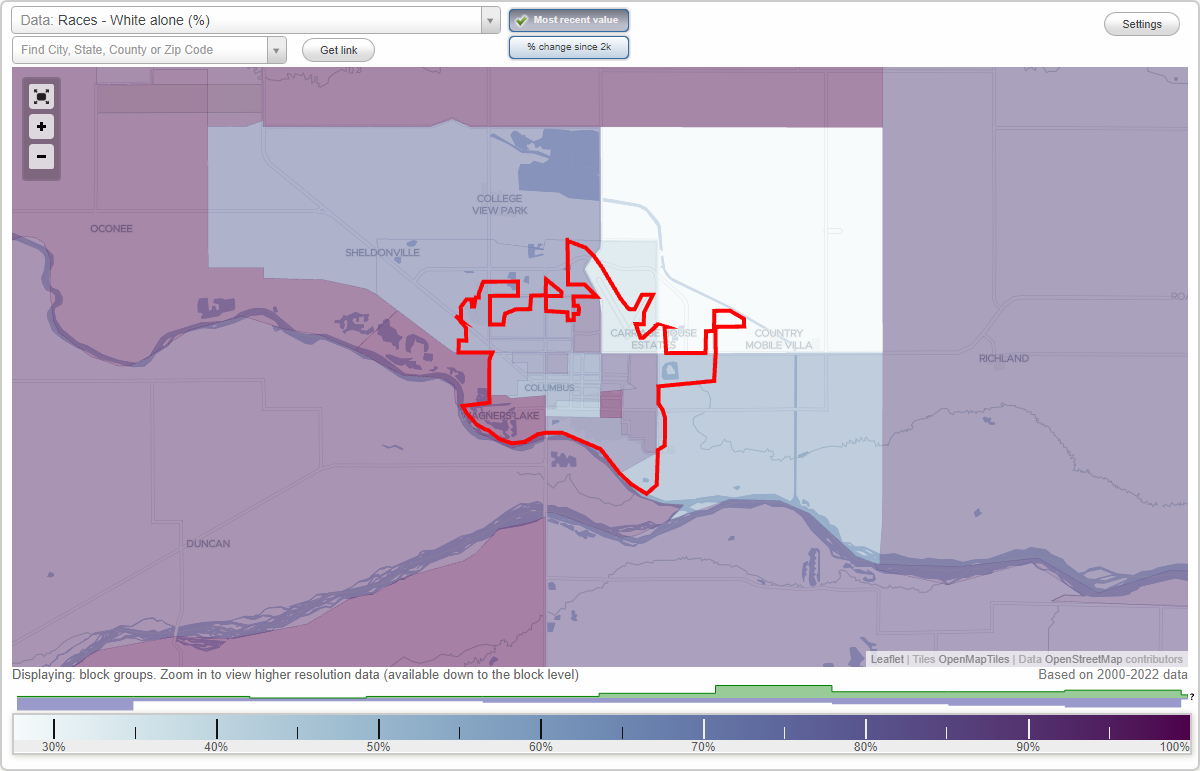
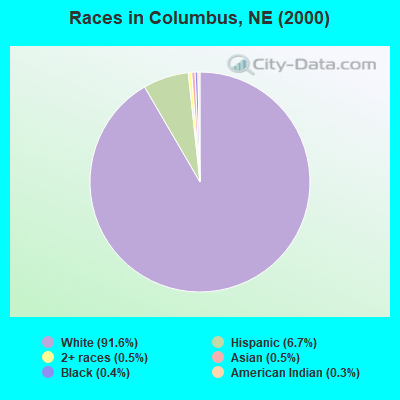
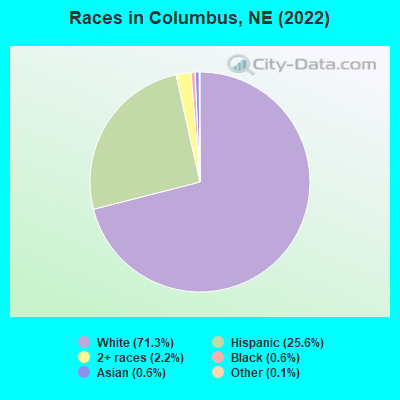
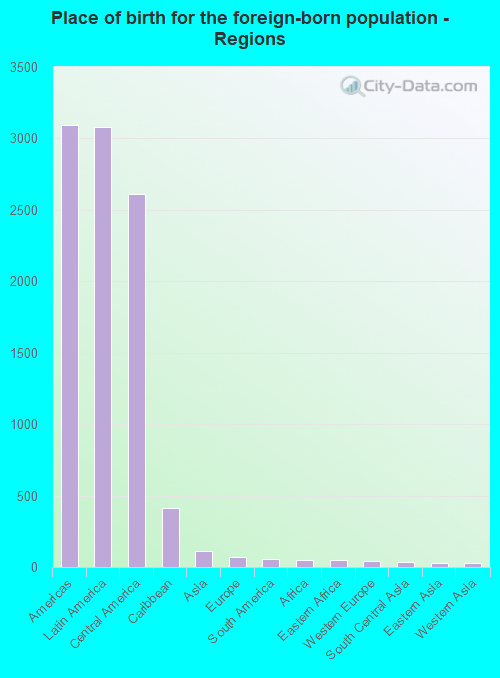
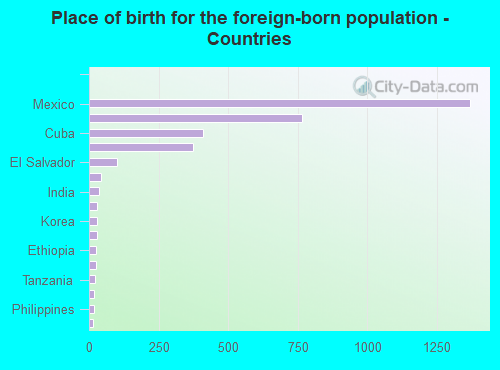
According to 2022 data, the most numerous races in Columbus, NE are White alone (17,212 residents), Hispanic (6,176 residents), and Black alone (146 residents). 79.5% of Columbus residents speak English at home. 13.8% of Columbus, NE residents are foreign-born (12.6% born in Latin America), which is 49.2% greater than the foreign-born rate of 7.0% across the entire state of Nebraska.
Race distribution in Columbus
2000 2022
1,494,494 87.3% White alone 94,425 5.5% Hispanic 67,537 3.9% Black alone 21,677 1.3% Asian alone 17,696 1.0% Two or more races 13,460 0.8% American Indian alone 1,327 0.08% Other race alone 647 0.04% Native Hawaiian and Other
1,492,005 75.8% White alone 241,898 12.3% Hispanic 89,520 4.5% Black alone 76,499 3.9% Two or more races 49,261 2.5% Asian alone 10,249 0.5% American Indian alone 7,425 0.4% Other race alone 1,066 0.05% Native Hawaiian and Other
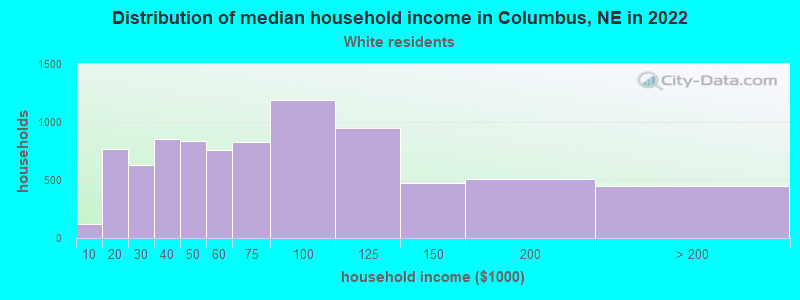
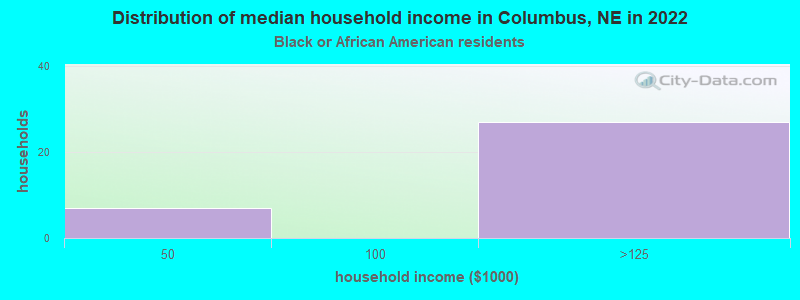
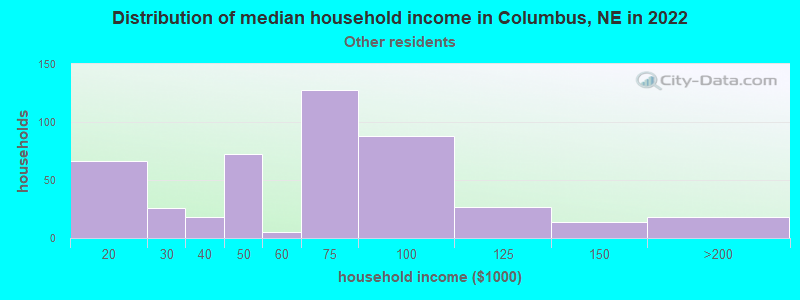
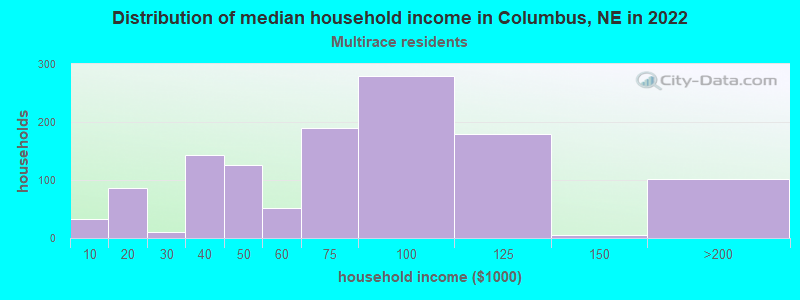
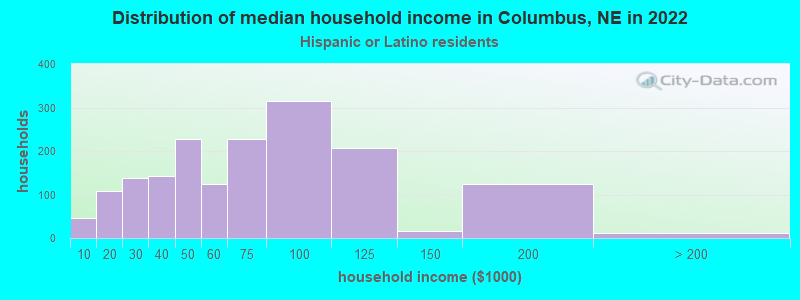
Income and house value in Columbus Median household income in 2022 $63,854 White non-Hispanic householders$117,516 Black householders$65,164 Some other race householders$74,167 Two or more races householders$61,218 Hispanic or Latino race householdersMedian 2022 house value $215,755 White Non-Hispanic householders$173,780 Black or African American householders $147,045 Asian householders$171,641 Some other race householders$272,167 Two or more races householders$152,659 Hispanic or Latino householders
Median age by race in Columbus
40.9 Median age for White residents40.5 41.5 27.5 Median age for Black or African American residents28.1 5.5 14.4 Median age for American Indian / Alaska Native residents-693,928,128.2 40.0 58.1 Median age for Asian residents-708,061,001.5 44.2 -699,999,999.3 Median age for Native Hawaiian / Pacific Islander residents-672,108,842.9 -689,223,057.0 29.4 Median age for Other race residents30.7 27.9 23.8 Median age for Two or more races residents21.3 24.4 43.7 Median age for White alone residents41.8 45.9 24.7 Median age for Hispanic or Latino residents24.9 24.4
Owner/renter occupied households by race in Columbus
House owners and renters - White residents 5,963 71.3% Owner occupied2,399 28.7% Renter occupiedHouse owners and renters - Black or African American residents 37 100.0% Renter occupiedHouse owners and renters - American Indian / Alaska Native residents 11 100.0% Owner occupiedHouse owners and renters - Other race residents 331 72.2% Owner occupied127 27.8% Renter occupiedHouse owners and renters - Two or more races residents 679 56.5% Owner occupied522 43.5% Renter occupiedHouse owners and renters - White alone residents 5,786 73.8% Owner occupied2,057 26.2% Renter occupiedHouse owners and renters - Hispanic or Latino residents 911 51.3% Owner occupied866 48.7% Renter occupied
Language usage in Columbus
English speakers - Total 79.5% of residents of Columbus speak English at home.
18.8% of residents speak Spanish at home 2,304 54.5% Speak English very well1,921 45.5% Speak English less than very well1.1% of residents speak other language at home 253 100.0% Speak English very well
English speakers - Born in the United States 83.9% of residents of Columbus speak English at home.
14.3% of residents speak Spanish at home 458 84.5% Speak English very well84 15.5% Speak English less than very well0.5% of residents speak other language at home 20 100.0% Speak English very well
English speakers - Native, born elsewhere 40.7% of residents of Columbus speak English at home.
59.8% of residents speak Spanish at home 92 71.9% Speak English very well36 28.1% Speak English less than very well
English speakers - Foreign-born 7.9% of residents of Columbus speak English at home.
87.6% of residents speak Spanish at home 1,082 38.9% Speak English very well1,699 61.1% Speak English less than very well5.9% of residents speak other language at home 186 100.0% Speak English very well
White (Caucasian) - Speak only English Native:
97.0% (16,182)Foreign-born:
11.1% (92)
White (Caucasian) - Speak another language Native:
2.8% (463)Foreign-born:
83.9% (699)
Black or African American - Speak only English Native:
81.0% (78)Foreign-born:
76.7% (33)
Black or African American - Speak another language Native:
22.1% (21)Foreign-born:
39.2% (17)
Other race - Speak only English Native:
38.8% (346)Foreign-born:
15.5% (110)
Other race - Speak another language Native:
58.5% (522)Foreign-born:
81.6% (579)
Two or more races - Speak only English Native:
54.9% (875)Foreign-born:
1.5% (23)
Two or more races - Speak another language Native:
44.2% (705)Foreign-born:
100.0% (1,595)
White alone - Speak only English Native:
99.3% (16,124)Foreign-born:
44.0% (38)
White alone - Speak another language Native:
0.7% (109)Foreign-born:
53.5% (47)
Hispanic or Latino - Speak only English Native:
33.6% (793)Foreign-born:
5.8% (175)
Hispanic or Latino - Speak another language Native:
59.3% (1,400)Foreign-born:
93.9% (2,805)
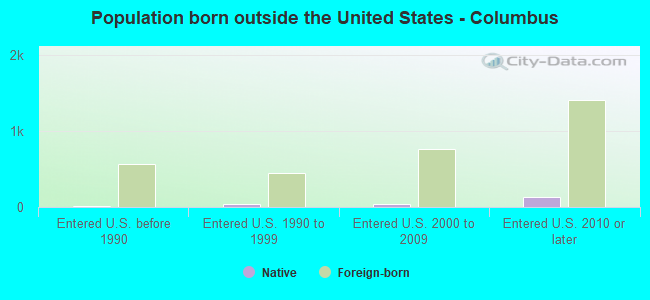
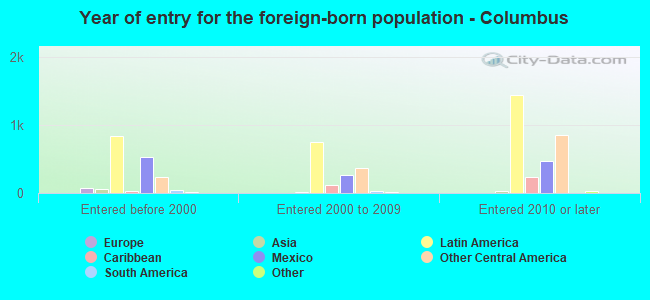
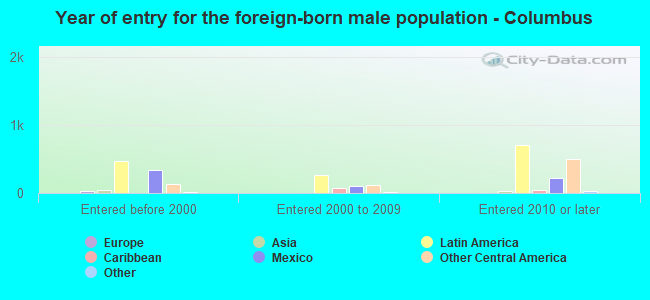
Foreign-born residents in Columbus 3,328 residents are foreign born (12.6% Latin America ).
This city:
13.8%Nebraska:
7.5%
Marital status for residents in Columbus Marital status - White (Caucasian) population 15 years and over
Males 30.5% Never married56.3% Now married2.8% Separated2.9% Widowed7.6% DivorcedFemales 23.8% Never married49.0% Now married0.2% Separated15.7% Widowed11.2% DivorcedWomen who gave birth in the past 12 months Now married:
83.4% (204)Unmarried:
16.6% (41)
Women who did not give birth in the past 12 months Now married:
46.0% (1,680)Unmarried:
54.0% (1,970)
Marital status - Black or African American population 15 years and over
Males 89.3% Never married4.9% Now married2.9% Separated0.0% Widowed2.9% DivorcedFemales 100.0% Never married0.0% Now married0.0% Separated0.0% Widowed0.0% DivorcedWomen who did not give birth in the past 12 months Now married:
0.0% (0)Unmarried:
100.0% (6)
Marital status - Asian population 15 years and over
Males 0.0% Never married0.0% Now married0.0% Separated100.0% Widowed0.0% DivorcedFemales 0.0% Never married100.0% Now married0.0% Separated0.0% Widowed0.0% DivorcedWomen who did not give birth in the past 12 months Now married:
100.0% (19)Unmarried:
0.0% (0)
Marital status - Other race population 15 years and over
Males 29.2% Never married31.2% Now married18.6% Separated6.2% Widowed14.8% DivorcedFemales 50.3% Never married36.7% Now married11.7% Separated0.0% Widowed1.3% DivorcedWomen who gave birth in the past 12 months Now married:
100.0% (56)Unmarried:
0.0% (0)
Women who did not give birth in the past 12 months Now married:
29.6% (100)Unmarried:
70.4% (238)
Marital status - Two or more races population 15 years and over
Males 52.7% Never married36.6% Now married9.3% Separated0.0% Widowed1.5% DivorcedFemales 38.6% Never married38.1% Now married8.2% Separated8.4% Widowed6.8% DivorcedWomen who gave birth in the past 12 months Now married:
60.0% (69)Unmarried:
40.0% (46)
Women who did not give birth in the past 12 months Now married:
49.7% (415)Unmarried:
50.3% (420)
Marital status - White alone, not Hispanic / Latino population 15 years and over
Males 29.6% Never married56.4% Now married2.5% Separated3.2% Widowed8.3% DivorcedFemales 21.9% Never married50.5% Now married0.2% Separated17.0% Widowed10.4% DivorcedWomen who gave birth in the past 12 months Now married:
94.0% (157)Unmarried:
6.0% (10)
Women who did not give birth in the past 12 months Now married:
48.3% (1,551)Unmarried:
51.7% (1,660)
Marital status - Hispanic or Latino population 15 years and over
Males 41.2% Never married40.7% Now married11.5% Separated1.9% Widowed4.7% DivorcedFemales 41.8% Never married36.8% Now married5.5% Separated5.3% Widowed10.6% DivorcedWomen who gave birth in the past 12 months Now married:
69.7% (155)Unmarried:
30.3% (67)
Women who did not give birth in the past 12 months Now married:
38.8% (520)Unmarried:
61.2% (819)
Ancestries in Columbus
3,094 26.7% German743 6.4% American734 6.3% Polish559 4.8% Czech332 2.9% English271 2.3% Irish244 2.1% European131 1.1% Norwegian116 1.0% Czechoslovakian70 0.6% Swedish62 0.5% Danish55 0.5% Swiss54 0.5% Dutch51 0.4% Welsh48 0.4% Italian44 0.4% Eastern European38 0.3% Scottish34 0.3% African23 0.2% Jordanian23 0.2% French19 0.2% Ukrainian14 0.1% French Canadian14 0.1% Luxembourger11 0.09% Ethiopian7 0.06% Scandinavian3 0.03% Nigerian2 0.02% Belgian1 0.01% Russian
Children Nativity (place of birth) in Columbus
Children under 6 years - Living with two parents Both parents native 1,039 100.0% NativeBoth parents foreign-born 137 100.0% NativeOne native, one foreign-born parent 9 100.0% NativeChildren under 6 years - Living with one parent Native parent 242 100.0% NativeForeign-born parent 406 100.0% NativeChildren 6 to 17 years - Living with two parents Both parents native 1,740 100.0% Native1 0.0% Foreign-bornBoth parents foreign-born 596 87.9% Native82 12.1% Foreign-bornOne native, one foreign-born parent 177 100.0% NativeChildren 6 to 17 years - Living with one parent Native parent 655 91.2% Native63 8.8% Foreign-bornForeign-born parent 537 70.0% Native230 30.0% Foreign-born
Grandparents responsible for own grandchildren in Columbus
Grandparents (30 to 59 years) White / Caucasian 61 58.5% Responsible for grandchildren43 41.5% Not responsible for grandchildrenTwo or more races 10 30.1% Responsible for grandchildren23 69.9% Not responsible for grandchildrenWhite alone, not Hispanic / Latino 61 87.2% Responsible for grandchildren9 12.8% Not responsible for grandchildrenHispanic or Latino 9 16.4% Responsible for grandchildren45 83.6% Not responsible for grandchildren
Grandparents (60 years and over) White / Caucasian 70 100.0% Responsible for grandchildrenTwo or more races 127 100.0% Not responsible for grandchildrenWhite alone, not Hispanic / Latino 70 100.0% Responsible for grandchildrenHispanic or Latino 92 100.0% Not responsible for grandchildren