Races in Converse, Texas (TX) Detailed Stats
Data:
Races - White alone (%)
Races - White alone (% change since 2000)
Races - Black alone (%)
Races - Black alone (% change since 2000)
Races - American Indian alone (%)
Races - American Indian alone (% change since 2000)
Races - Asian alone (%)
Races - Asian alone (% change since 2000)
Races - Hispanic (%)
Races - Hispanic (% change since 2000)
Races - Native Hawaiian and Other Pacific Islander alone (%)
Races - Native Hawaiian and Other Pacific Islander alone (% change since 2000)
Races - Two or more races(%)
Races - Two or more races(% change since 2000)
Races - Other race alone (%)
Races - Other race alone (% change since 2000)
Racial diversity
Place of birth - Born in state of residence (%)
Place of birth - Born in state of residence (%) - White
Place of birth - Born in state of residence (%) - Black or African American
Place of birth - Born in state of residence (%) - Asian
Place of birth - Born in state of residence (%) - Hispanic or Latino
Place of birth - Born in state of residence (%) - American Indian and Alaska Native
Place of birth - Born in state of residence (%) - Multirace
Place of birth - Born in state of residence (%) - Other Race
Place of birth - Born in other state (%)
Place of birth - Born in other state (%) - White
Place of birth - Born in other state (%) - Black or African American
Place of birth - Born in other state (%) - Asian
Place of birth - Born in other state (%) - Hispanic or Latino
Place of birth - Born in other state (%) - American Indian and Alaska Native
Place of birth - Born in other state (%) - Multirace
Place of birth - Born in other state (%) - Other Race
Place of birth - Native, outside of US (%)
Place of birth - Native, outside of US (%) - White
Place of birth - Native, outside of US (%) - Black or African American
Place of birth - Native, outside of US (%) - Asian
Place of birth - Native, outside of US (%) - Hispanic or Latino
Place of birth - Native, outside of US (%) - American Indian and Alaska Native
Place of birth - Native, outside of US (%) - Multirace
Place of birth - Native, outside of US (%) - Other Race
Place of birth - Foreign born (%)
Place of birth - Foreign born (%) - White
Place of birth - Foreign born (%) - Black or African American
Place of birth - Foreign born (%) - Asian
Place of birth - Foreign born (%) - Hispanic or Latino
Place of birth - Foreign born (%) - American Indian and Alaska Native
Place of birth - Foreign born (%) - Multirace
Place of birth - Foreign born (%) - Other Race
Residents speaking English at home (%)
Residents speaking English at home - Born in the United States (%)
Residents speaking English at home - Native, born elsewhere (%)
Residents speaking English at home - Foreign born (%)
Residents speaking Spanish at home (%)
Residents speaking Spanish at home - Born in the United States (%)
Residents speaking Spanish at home - Native, born elsewhere (%)
Residents speaking Spanish at home - Foreign born (%)
Residents speaking other language at home (%)
Residents speaking other language at home - Born in the United States (%)
Residents speaking other language at home - Native, born elsewhere (%)
Residents speaking other language at home - Foreign born (%)
Marital status - Never married (%)
Marital status - Now married (%)
Marital status - Separated (%)
Marital status - Widowed (%)
Marital status - Divorced (%)
Ancestries Reported - Arab (%)
Ancestries Reported - Czech (%)
Ancestries Reported - Danish (%)
Ancestries Reported - Dutch (%)
Ancestries Reported - English (%)
Ancestries Reported - French (%)
Ancestries Reported - French Canadian (%)
Ancestries Reported - German (%)
Ancestries Reported - Greek (%)
Ancestries Reported - Hungarian (%)
Ancestries Reported - Irish (%)
Ancestries Reported - Italian (%)
Ancestries Reported - Lithuanian (%)
Ancestries Reported - Norwegian (%)
Ancestries Reported - Polish (%)
Ancestries Reported - Portuguese (%)
Ancestries Reported - Russian (%)
Ancestries Reported - Scotch-Irish (%)
Ancestries Reported - Scottish (%)
Ancestries Reported - Slovak (%)
Ancestries Reported - Subsaharan African (%)
Ancestries Reported - Swedish (%)
Ancestries Reported - Swiss (%)
Ancestries Reported - Ukrainian (%)
Ancestries Reported - United States (%)
Ancestries Reported - Welsh (%)
Ancestries Reported - West Indian (%)
Ancestries Reported - Other (%)
Geographical mobility - Same house 1 year ago (%)
Geographical mobility - Same house 1 year ago (%) - White
Geographical mobility - Same house 1 year ago (%) - Black or African American
Geographical mobility - Same house 1 year ago (%) - Asian
Geographical mobility - Same house 1 year ago (%) - Hispanic or Latino
Geographical mobility - Same house 1 year ago (%) - American Indian and Alaska Native
Geographical mobility - Same house 1 year ago (%) - Multirace
Geographical mobility - Same house 1 year ago (%) - Other Race
Geographical mobility - Moved within same county (%)
Geographical mobility - Moved within same county (%) - White
Geographical mobility - Moved within same county (%) - Black or African American
Geographical mobility - Moved within same county (%) - Asian
Geographical mobility - Moved within same county (%) - Hispanic or Latino
Geographical mobility - Moved within same county (%) - American Indian and Alaska Native
Geographical mobility - Moved within same county (%) - Multirace
Geographical mobility - Moved within same county (%) - Other Race
Geographical mobility - Moved from different county within same state (%)
Geographical mobility - Moved from different county within same state (%) - White
Geographical mobility - Moved from different county within same state (%) - Black or African American
Geographical mobility - Moved from different county within same state (%) - Asian
Geographical mobility - Moved from different county within same state (%) - Hispanic or Latino
Geographical mobility - Moved from different county within same state (%) - American Indian and Alaska Native
Geographical mobility - Moved from different county within same state (%) - Multirace
Geographical mobility - Moved from different county within same state (%) - Other Race
Geographical mobility - Moved from different state (%)
Geographical mobility - Moved from different state (%) - White
Geographical mobility - Moved from different state (%) - Black or African American
Geographical mobility - Moved from different state (%) - Asian
Geographical mobility - Moved from different state (%) - Hispanic or Latino
Geographical mobility - Moved from different state (%) - American Indian and Alaska Native
Geographical mobility - Moved from different state (%) - Multirace
Geographical mobility - Moved from different state (%) - Other Race
Geographical mobility - Moved from abroad (%)
Geographical mobility - Moved from abroad (%) - White
Geographical mobility - Moved from abroad (%) - Black or African American
Geographical mobility - Moved from abroad (%) - Asian
Geographical mobility - Moved from abroad (%) - Hispanic or Latino
Geographical mobility - Moved from abroad (%) - American Indian and Alaska Native
Geographical mobility - Moved from abroad (%) - Multirace
Geographical mobility - Moved from abroad (%) - Other Race
Place of birth for the foreign-born population - Ireland (%)
Place of birth for the foreign-born population - Denmark (%)
Place of birth for the foreign-born population - Norway (%)
Place of birth for the foreign-born population - Sweden (%)
Place of birth for the foreign-born population - United Kingdom (%)
Place of birth for the foreign-born population - England (%)
Place of birth for the foreign-born population - Scotland (%)
Place of birth for the foreign-born population - Other Northern Europe (%)
Place of birth for the foreign-born population - Austria (%)
Place of birth for the foreign-born population - Belgium (%)
Place of birth for the foreign-born population - France (%)
Place of birth for the foreign-born population - Germany (%)
Place of birth for the foreign-born population - Netherlands (%)
Place of birth for the foreign-born population - Switzerland (%)
Place of birth for the foreign-born population - Other Western Europe (%)
Place of birth for the foreign-born population - Greece (%)
Place of birth for the foreign-born population - Italy (%)
Place of birth for the foreign-born population - Portugal (%)
Place of birth for the foreign-born population - Spain (%)
Place of birth for the foreign-born population - Other Southern Europe (%)
Place of birth for the foreign-born population - Albania (%)
Place of birth for the foreign-born population - Belarus (%)
Place of birth for the foreign-born population - Bosnia and Herzegovina (%)
Place of birth for the foreign-born population - Bulgaria (%)
Place of birth for the foreign-born population - Croatia (%)
Place of birth for the foreign-born population - Czechoslovakia (%)
Place of birth for the foreign-born population - Hungary (%)
Place of birth for the foreign-born population - Latvia (%)
Place of birth for the foreign-born population - Lithuania (%)
Place of birth for the foreign-born population - North Macedonia (Macedonia) (%)
Place of birth for the foreign-born population - Moldova (%)
Place of birth for the foreign-born population - Poland (%)
Place of birth for the foreign-born population - Romania (%)
Place of birth for the foreign-born population - Russia (%)
Place of birth for the foreign-born population - Serbia (%)
Place of birth for the foreign-born population - Ukraine (%)
Place of birth for the foreign-born population - Other Eastern Europe (%)
Place of birth for the foreign-born population - China (%)
Place of birth for the foreign-born population - Hong Kong (%)
Place of birth for the foreign-born population - Taiwan (%)
Place of birth for the foreign-born population - Japan (%)
Place of birth for the foreign-born population - Korea (%)
Place of birth for the foreign-born population - Other Eastern Asia (%)
Place of birth for the foreign-born population - Afghanistan (%)
Place of birth for the foreign-born population - Bangladesh (%)
Place of birth for the foreign-born population - India (%)
Place of birth for the foreign-born population - Iran (%)
Place of birth for the foreign-born population - Kazakhstan (%)
Place of birth for the foreign-born population - Nepal (%)
Place of birth for the foreign-born population - Pakistan (%)
Place of birth for the foreign-born population - Sri Lanka (%)
Place of birth for the foreign-born population - Uzbekistan (%)
Place of birth for the foreign-born population - Other South Central Asia (%)
Place of birth for the foreign-born population - Burma (%)
Place of birth for the foreign-born population - Cambodia (%)
Place of birth for the foreign-born population - Indonesia (%)
Place of birth for the foreign-born population - Laos (%)
Place of birth for the foreign-born population - Malaysia (%)
Place of birth for the foreign-born population - Philippines (%)
Place of birth for the foreign-born population - Singapore (%)
Place of birth for the foreign-born population - Thailand (%)
Place of birth for the foreign-born population - Vietnam (%)
Place of birth for the foreign-born population - Other South Eastern Asia (%)
Place of birth for the foreign-born population - Armenia (%)
Place of birth for the foreign-born population - Iraq (%)
Place of birth for the foreign-born population - Israel (%)
Place of birth for the foreign-born population - Jordan (%)
Place of birth for the foreign-born population - Kuwait (%)
Place of birth for the foreign-born population - Lebanon (%)
Place of birth for the foreign-born population - Saudi Arabia (%)
Place of birth for the foreign-born population - Syria (%)
Place of birth for the foreign-born population - Turkey (%)
Place of birth for the foreign-born population - Yemen (%)
Place of birth for the foreign-born population - Other Western Asia (%)
Place of birth for the foreign-born population - Eritrea (%)
Place of birth for the foreign-born population - Ethiopia (%)
Place of birth for the foreign-born population - Kenya (%)
Place of birth for the foreign-born population - Somalia (%)
Place of birth for the foreign-born population - Uganda (%)
Place of birth for the foreign-born population - Zimbabwe (%)
Place of birth for the foreign-born population - Other Eastern Africa (%)
Place of birth for the foreign-born population - Cameroon (%)
Place of birth for the foreign-born population - Congo (%)
Place of birth for the foreign-born population - Democratic Republic of Congo (Zaire) (%)
Place of birth for the foreign-born population - Other Middle Africa (%)
Place of birth for the foreign-born population - Egypt (%)
Place of birth for the foreign-born population - Morocco (%)
Place of birth for the foreign-born population - Sudan (%)
Place of birth for the foreign-born population - Other Northern Africa (%)
Place of birth for the foreign-born population - South Africa (%)
Place of birth for the foreign-born population - Other Southern Africa (%)
Place of birth for the foreign-born population - Cabo Verde (%)
Place of birth for the foreign-born population - Ghana (%)
Place of birth for the foreign-born population - Liberia (%)
Place of birth for the foreign-born population - Nigeria (%)
Place of birth for the foreign-born population - Senegal (%)
Place of birth for the foreign-born population - Sierra Leone (%)
Place of birth for the foreign-born population - Other Western Africa (%)
Place of birth for the foreign-born population - Australia (%)
Place of birth for the foreign-born population - New Zealand (%)
Place of birth for the foreign-born population - Fiji (%)
Place of birth for the foreign-born population - Micronesia (%)
Place of birth for the foreign-born population - Bahamas (%)
Place of birth for the foreign-born population - Barbados (%)
Place of birth for the foreign-born population - Cuba (%)
Place of birth for the foreign-born population - Dominica (%)
Place of birth for the foreign-born population - Dominican Republic (%)
Place of birth for the foreign-born population - Grenada (%)
Place of birth for the foreign-born population - Haiti (%)
Place of birth for the foreign-born population - Jamaica (%)
Place of birth for the foreign-born population - St. Vincent and the Grenadines (%)
Place of birth for the foreign-born population - Trinidad and Tobago (%)
Place of birth for the foreign-born population - West Indies (%)
Place of birth for the foreign-born population - Other Caribbean (%)
Place of birth for the foreign-born population - Belize (%)
Place of birth for the foreign-born population - Costa Rica (%)
Place of birth for the foreign-born population - El Salvador (%)
Place of birth for the foreign-born population - Guatemala (%)
Place of birth for the foreign-born population - Honduras (%)
Place of birth for the foreign-born population - Mexico (%)
Place of birth for the foreign-born population - Nicaragua (%)
Place of birth for the foreign-born population - Panama (%)
Place of birth for the foreign-born population - Other Central America (%)
Place of birth for the foreign-born population - Argentina (%)
Place of birth for the foreign-born population - Bolivia (%)
Place of birth for the foreign-born population - Brazil (%)
Place of birth for the foreign-born population - Chile (%)
Place of birth for the foreign-born population - Colombia (%)
Place of birth for the foreign-born population - Ecuador (%)
Place of birth for the foreign-born population - Guyana (%)
Place of birth for the foreign-born population - Peru (%)
Place of birth for the foreign-born population - Uruguay (%)
Place of birth for the foreign-born population - Venezuela (%)
Place of birth for the foreign-born population - Other South America (%)
Place of birth for the foreign-born population - Canada (%)
Place of birth for the foreign-born population - Other Northern America (%)
Place of birth for the foreign-born population - Other (%)
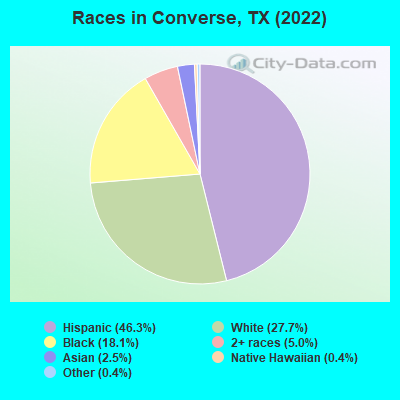
According to 2022 data, the most numerous races in Converse, TX are Hispanic (13,274 residents), White alone (7,953 residents), and Black alone (5,193 residents). 72.2% of Converse residents speak English at home. 8.7% of Converse, TX residents are foreign-born (5.8% born in Latin America, 1.6% born in Asia), which is 94.4% less than the foreign-born rate of 17.0% across the entire state of Texas.
Race distribution in Converse
2000 2022
10,933,313 52.4% White alone 6,669,666 32.0% Hispanic 2,364,255 11.3% Black alone 554,445 2.7% Asian alone 230,567 1.1% Two or more races 68,859 0.3% American Indian alone 19,958 0.10% Other race alone 10,757 0.05% Native Hawaiian and Other
12,070,642 40.2% Hispanic 11,683,430 38.9% White alone 3,508,706 11.7% Black alone 1,608,173 5.4% Asian alone 956,560 3.2% Two or more races 125,763 0.4% Other race alone 47,023 0.2% American Indian alone 29,275 0.10% Native Hawaiian and Other
Income and house value in Converse Median household income in 2022 $72,149 White non-Hispanic householders$94,819 Black householders$126,506 American Indian and Alaska Native householders$78,102 Asian householders$44,410 Some other race householders$78,051 Two or more races householders$80,829 Hispanic or Latino race householdersMedian 2022 house value $259,576 White Non-Hispanic householders$280,077 Black or African American householders$115,734 American Indian or Alaska Native householders $305,870 Asian householders$245,688 Some other race householders$350,179 Two or more races householders$229,154 Hispanic or Latino householders
Median age by race in Converse
37.2 Median age for White residents34.1 38.7 35.8 Median age for Black or African American residents32.6 35.3 47.7 Median age for American Indian / Alaska Native residents-656,656,656.0 47.6 39.1 Median age for Asian residents31.2 38.7 35.6 Median age for Native Hawaiian / Pacific Islander residents-596,986,816.7 34.0 31.7 Median age for Other race residents37.1 26.4 28.9 Median age for Two or more races residents26.9 31.9 40.5 Median age for White alone residents40.0 41.7 29.4 Median age for Hispanic or Latino residents28.9 30.6
Owner/renter occupied households by race in Converse
House owners and renters - White residents 3,555 86.3% Owner occupied563 13.7% Renter occupiedHouse owners and renters - Black or African American residents 1,273 59.5% Owner occupied867 40.5% Renter occupiedHouse owners and renters - American Indian / Alaska Native residents 90 52.0% Owner occupied83 48.0% Renter occupiedHouse owners and renters - Asian residents 196 54.9% Owner occupied161 45.1% Renter occupiedHouse owners and renters - Native Hawaiian / Pacific Islander residents 111 100.0% Renter occupiedHouse owners and renters - Other race residents 616 67.9% Owner occupied292 32.1% Renter occupiedHouse owners and renters - Two or more races residents 1,527 74.9% Owner occupied512 25.1% Renter occupiedHouse owners and renters - White alone residents 2,940 86.2% Owner occupied469 13.8% Renter occupiedHouse owners and renters - Hispanic or Latino residents 3,066 77.8% Owner occupied873 22.2% Renter occupied
Language usage in Converse
English speakers - Total 72.2% of residents of Converse speak English at home.
23.8% of residents speak Spanish at home 5,117 79.9% Speak English very well1,289 20.1% Speak English less than very well4.4% of residents speak other language at home 617 52.6% Speak English very well555 47.4% Speak English less than very well
English speakers - Born in the United States 84.7% of residents of Converse speak English at home.
14.6% of residents speak Spanish at home 1,183 97.0% Speak English very well37 3.0% Speak English less than very well0.9% of residents speak other language at home 78 100.0% Speak English very well
English speakers - Native, born elsewhere 59.4% of residents of Converse speak English at home.
28.2% of residents speak Spanish at home 259 78.5% Speak English very well71 21.5% Speak English less than very well15.5% of residents speak other language at home 153 84.1% Speak English very well29 15.9% Speak English less than very well
English speakers - Foreign-born 16.0% of residents of Converse speak English at home.
57.8% of residents speak Spanish at home 524 37.2% Speak English very well885 62.8% Speak English less than very well27.7% of residents speak other language at home 196 29.0% Speak English very well479 71.0% Speak English less than very well
White (Caucasian) - Speak only English Native:
83.7% (8,215)Foreign-born:
40.2% (156)
White (Caucasian) - Speak another language Native:
16.7% (1,640)Foreign-born:
69.3% (268)
Black or African American - Speak only English Native:
94.6% (5,188)Foreign-born:
40.4% (73)
Black or African American - Speak another language Native:
5.2% (286)Foreign-born:
59.0% (106)
Asian - Speak only English Native:
55.9% (163)Foreign-born:
7.2% (30)
Asian - Speak another language Native:
42.6% (124)Foreign-born:
91.8% (377)
Other race - Speak only English Native:
56.7% (1,334)Foreign-born:
14.6% (71)
Other race - Speak another language Native:
42.8% (1,008)Foreign-born:
83.8% (410)
Two or more races - Speak only English Native:
68.4% (3,940)Foreign-born:
2.1% (21)
Two or more races - Speak another language Native:
30.4% (1,749)Foreign-born:
98.2% (1,000)
White alone - Speak only English Native:
96.8% (7,136)Foreign-born:
46.0% (119)
White alone - Speak another language Native:
3.4% (249)Foreign-born:
53.7% (139)
Hispanic or Latino - Speak only English Native:
52.2% (5,464)Foreign-born:
9.4% (147)
Hispanic or Latino - Speak another language Native:
47.7% (4,995)Foreign-born:
90.8% (1,421)
Foreign-born residents in Converse 2,508 residents are foreign born (5.8% Latin America , 1.6% Asia ).
This city:
8.7%Texas:
17.1%
Marital status for residents in Converse Marital status - White (Caucasian) population 15 years and over
Males 32.3% Never married43.3% Now married3.5% Separated6.8% Widowed14.2% DivorcedFemales 24.1% Never married47.7% Now married4.2% Separated4.6% Widowed19.4% DivorcedWomen who gave birth in the past 12 months Now married:
58.9% (52)Unmarried:
41.1% (37)
Women who did not give birth in the past 12 months Now married:
49.1% (1,061)Unmarried:
50.9% (1,102)
Marital status - Black or African American population 15 years and over
Males 29.6% Never married55.4% Now married2.3% Separated0.0% Widowed12.7% DivorcedFemales 33.0% Never married32.9% Now married10.2% Separated0.8% Widowed23.1% DivorcedWomen who gave birth in the past 12 months Now married:
65.4% (19)Unmarried:
34.6% (10)
Women who did not give birth in the past 12 months Now married:
43.0% (700)Unmarried:
57.0% (926)
Marital status - American Indian / Alaska Native population 15 years and over
Males 0.0% Never married100.0% Now married0.0% Separated0.0% Widowed0.0% DivorcedFemales 24.2% Never married75.8% Now married0.0% Separated0.0% Widowed0.0% DivorcedWomen who did not give birth in the past 12 months Now married:
75.8% (108)Unmarried:
24.2% (34)
Marital status - Asian population 15 years and over
Males 31.2% Never married55.4% Now married0.0% Separated0.0% Widowed13.4% DivorcedFemales 5.4% Never married61.2% Now married0.0% Separated3.4% Widowed30.0% DivorcedWomen who gave birth in the past 12 months Now married:
100.0% (45)Unmarried:
0.0% (0)
Women who did not give birth in the past 12 months Now married:
89.6% (192)Unmarried:
10.4% (22)
Marital status - Native Hawaiian / Pacific Islander population 15 years and over
Males 100.0% Never married0.0% Now married0.0% Separated0.0% Widowed0.0% DivorcedFemales 77.9% Never married22.1% Now married0.0% Separated0.0% Widowed0.0% DivorcedWomen who gave birth in the past 12 months Now married:
0.0% (0)Unmarried:
100.0% (35)
Women who did not give birth in the past 12 months Now married:
0.0% (0)Unmarried:
100.0% (29)
Marital status - Other race population 15 years and over
Males 34.4% Never married51.2% Now married4.5% Separated0.0% Widowed9.8% DivorcedFemales 33.5% Never married44.9% Now married3.4% Separated7.8% Widowed10.4% DivorcedWomen who did not give birth in the past 12 months Now married:
48.2% (396)Unmarried:
51.8% (426)
Marital status - Two or more races population 15 years and over
Males 42.4% Never married52.3% Now married0.8% Separated2.0% Widowed2.5% DivorcedFemales 23.0% Never married55.6% Now married0.8% Separated6.9% Widowed13.8% DivorcedWomen who gave birth in the past 12 months Now married:
100.0% (53)Unmarried:
0.0% (0)
Women who did not give birth in the past 12 months Now married:
66.2% (1,013)Unmarried:
33.8% (517)
Marital status - White alone, not Hispanic / Latino population 15 years and over
Males 27.1% Never married44.1% Now married2.3% Separated9.6% Widowed16.9% DivorcedFemales 15.6% Never married57.0% Now married2.1% Separated5.1% Widowed20.3% DivorcedWomen who gave birth in the past 12 months Now married:
73.0% (72)Unmarried:
27.0% (26)
Women who did not give birth in the past 12 months Now married:
63.8% (988)Unmarried:
36.2% (561)
Marital status - Hispanic or Latino population 15 years and over
Males 37.1% Never married51.1% Now married3.6% Separated1.1% Widowed7.2% DivorcedFemales 31.8% Never married43.6% Now married4.1% Separated4.8% Widowed15.7% DivorcedWomen who gave birth in the past 12 months Now married:
58.6% (35)Unmarried:
41.4% (25)
Women who did not give birth in the past 12 months Now married:
46.1% (1,451)Unmarried:
53.9% (1,699)
Ancestries in Converse
767 4.5% American595 3.5% German417 2.4% Irish405 2.4% English324 1.9% African229 1.3% Czech154 0.9% European86 0.5% Russian81 0.5% Polish71 0.4% Norwegian50 0.3% Afghan43 0.3% Belizean39 0.2% Scottish36 0.2% Romanian34 0.2% Dutch31 0.2% Celtic30 0.2% Latvian30 0.2% Scotch-Irish25 0.1% Italian23 0.1% French17 0.10% Moroccan17 0.10% British15 0.09% Austrian13 0.08% French Canadian12 0.07% West Indian9 0.05% Israeli
Geographical mobility in Converse Same house 1 year ago 9,282 87.1% White (Caucasian)4,985 86.3% Black or African American218 85.0% American Indian / Alaska Native690 89.7% Asian158 98.2% Native Hawaiian / Pacific Islander2,423 84.1% Other race6,530 87.0% Two or more races7,153 90.9% White alone, not Hispanic / Latino11,020 83.6% Hispanic or LatinoMoved within same county 506 4.8% White / Caucasian338 5.9% Black or African American36 14.0% American Indian / Alaska Native27 3.5% Asian25 0.9% Other race761 10.1% Two or more races318 4.0% White alone, not Hispanic / Latino810 6.1% Hispanic or LatinoMoved within same state 321 3.0% White / Caucasian272 4.7% Black or African American12 1.6% Asian18 0.6% Other race64 0.9% Two or more races279 3.5% White alone, not Hispanic / Latino246 1.9% Hispanic or LatinoMoved from different state 637 6.0% White / Caucasian152 2.6% Black or African American37 4.8% Asian400 13.9% Other race131 1.7% Two or more races118 1.5% White alone, not Hispanic / Latino1,114 8.4% Hispanic or LatinoMoved from abroad 3 0.0% White161 5.6% Other race147 1.1% Hispanic or Latino
Children Nativity (place of birth) in Converse
Children under 6 years - Living with two parents Both parents native 980 100.0% NativeBoth parents foreign-born 76 87.8% Native10 12.2% Foreign-bornOne native, one foreign-born parent 232 100.0% NativeChildren under 6 years - Living with one parent Native parent 739 94.0% Native47 6.0% Foreign-bornChildren 6 to 17 years - Living with two parents Both parents native 1,922 100.0% NativeBoth parents foreign-born 363 93.8% Native24 6.2% Foreign-bornOne native, one foreign-born parent 262 100.0% NativeChildren 6 to 17 years - Living with one parent Native parent 2,991 100.0% NativeForeign-born parent 162 49.9% Native163 50.1% Foreign-born
Grandparents responsible for own grandchildren in Converse
Grandparents (30 to 59 years) White / Caucasian 38 50.0% Responsible for grandchildren38 50.0% Not responsible for grandchildrenBlack or African American 29 66.6% Responsible for grandchildren15 33.4% Not responsible for grandchildrenOther race 11 7.2% Responsible for grandchildren141 92.8% Not responsible for grandchildrenTwo or more races 74 65.8% Responsible for grandchildren38 34.2% Not responsible for grandchildrenWhite alone, not Hispanic / Latino 35 100.0% Responsible for grandchildrenHispanic or Latino 72 29.9% Responsible for grandchildren169 70.1% Not responsible for grandchildrenGrandparents (60 years and over) White / Caucasian 51 27.8% Responsible for grandchildren134 72.2% Not responsible for grandchildrenBlack or African American 256 100.0% Responsible for grandchildrenTwo or more races 12 100.0% Responsible for grandchildrenWhite alone, not Hispanic / Latino 14 11.0% Responsible for grandchildren114 89.0% Not responsible for grandchildrenHispanic or Latino 63 41.4% Responsible for grandchildren89 58.6% Not responsible for grandchildren