Races in Coos Bay, Oregon (OR) Detailed Stats
Ancestries, Foreign-born residents, place of birth
Settings
X


Recent posts about races in Coos Bay, Oregon on our local forum with over 2,400,000 registered users:
 | Coos Bay/ North Bend, Oregon living. (90 replies) |
| Coos Bay vs Aberdeen WA for retirement (31 replies) |
| Need info about Coos Bay weather. Moving in Spring (45 replies) |
| Coos Bay and Beach cities in Oregon (14 replies) |
| Best place to retire on the coast (117 replies) |
| Coos Bay....or maybe a hidden gem. (25 replies) |
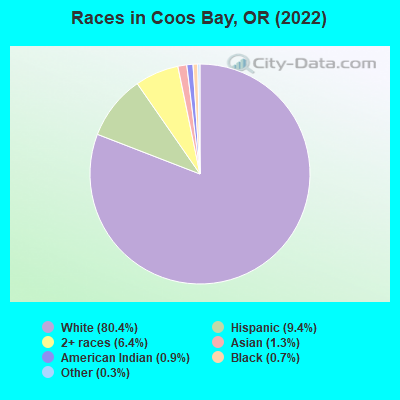
According to 2022 data, the most numerous races in Coos Bay, OR are White alone (12,852 residents), Hispanic (1,498 residents), and Two or more races (1,017 residents). 92.8% of Coos Bay residents speak English at home. 4.9% of Coos Bay, OR residents are foreign-born (3.1% born in Latin America, 1.1% born in Asia, 0.5% born in Europe), which is 85.2% less than the foreign-born rate of 9.0% across the entire state of Oregon.
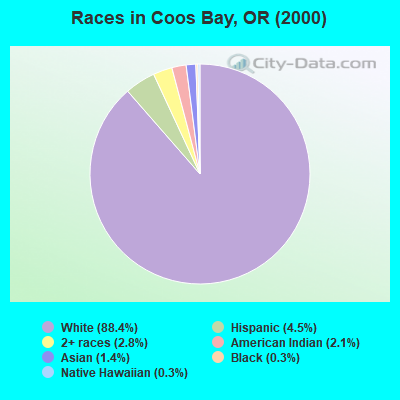
Race distribution in Coos Bay
2000
2022

- 13,59388.4%White alone
- 6914.5%Hispanic
- 4362.8%Two or more races
- 3272.1%American Indian alone
- 2181.4%Asian alone
- 500.3%Black alone
- 450.3%Native Hawaiian and Other
Pacific Islander alone - 140.09%Other race alone
-
- 12,85280.4%White alone
- 1,4989.4%Hispanic
- 1,0176.4%Two or more races
- 2081.3%Asian alone
- 1500.9%American Indian alone
- 1180.7%Black alone
- 500.3%Other race alone
2000
2022
-
- 2,857,61683.5%White alone
- 275,3148.0%Hispanic
- 100,3332.9%Asian alone
- 82,7332.4%Two or more races
- 53,3251.6%Black alone
- 40,1301.2%American Indian alone
- 7,3980.2%Native Hawaiian and Other
Pacific Islander alone - 4,5500.1%Other race alone

-
- 3,037,57171.6%White alone
- 609,53814.4%Hispanic
- 252,7446.0%Two or more races
- 191,2834.5%Asian alone
- 78,2281.8%Black alone
- 29,3990.7%American Indian alone
- 25,7310.6%Other race alone
- 15,6430.4%Native Hawaiian and Other
Pacific Islander alone

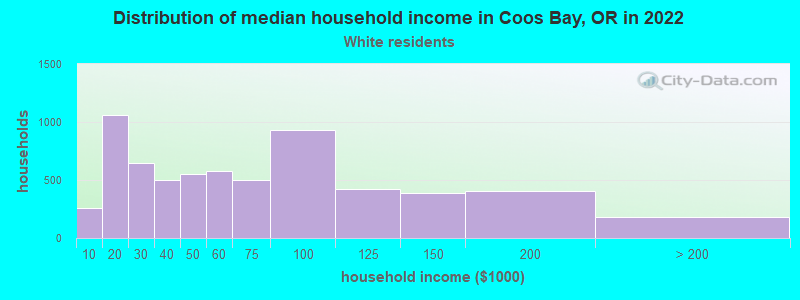
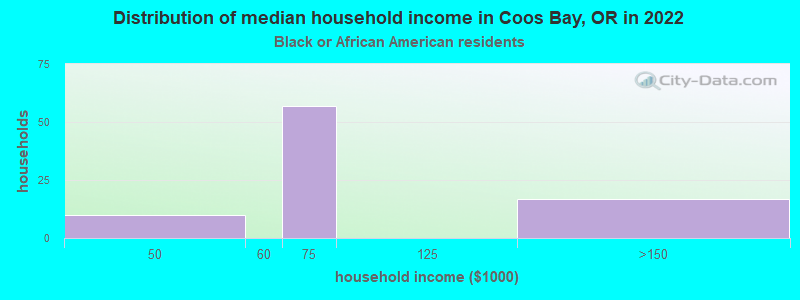
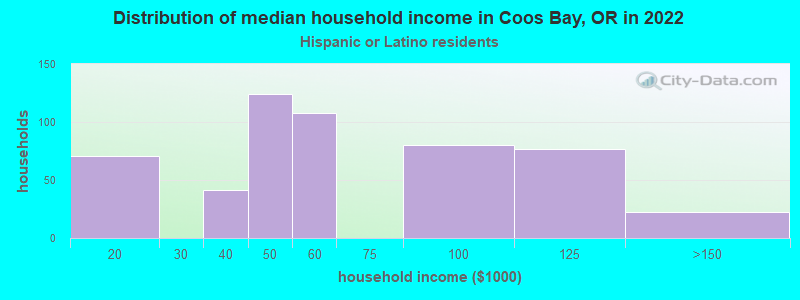
Income and house value in Coos Bay
- Median household income in 2022
- $52,349White non-Hispanic householders
- $76,909Black householders
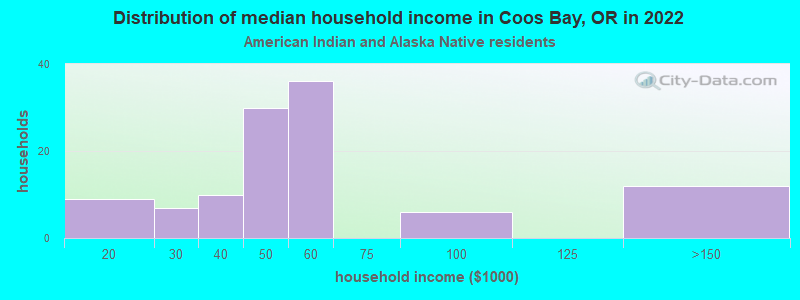
- $55,284American Indian and Alaska Native householders
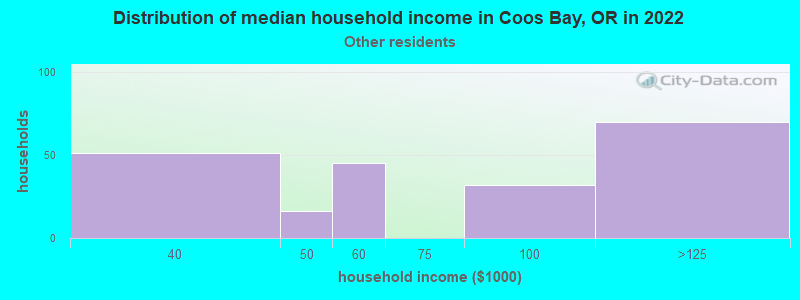
- $59,083Some other race householders
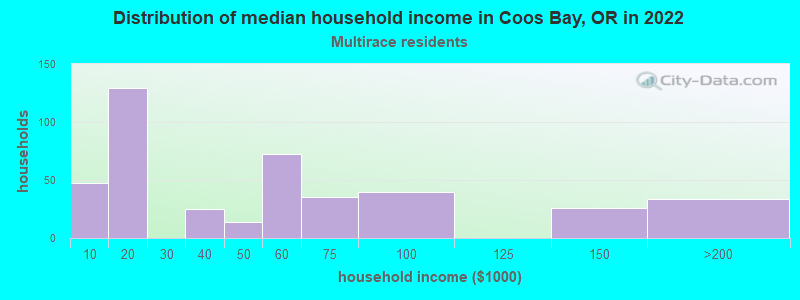
- $42,074Two or more races householders
- $52,650Hispanic or Latino race householders
- Median 2022 house value
- $295,140White Non-Hispanic householders
- $364,791American Indian or Alaska Native householders
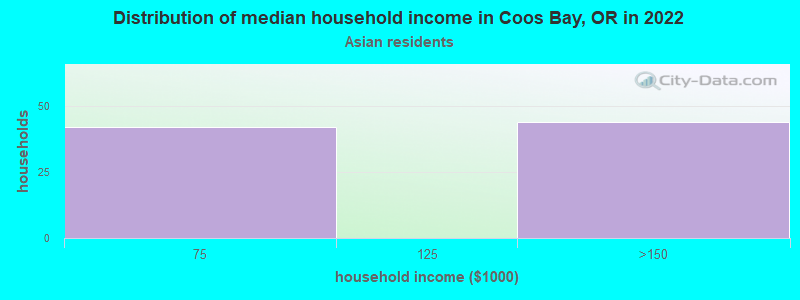
- $429,353Asian householders
- $263,018Some other race householders
- $277,330Two or more races householders
- $252,841Hispanic or Latino householders
Household income for White non-Hispanic householders
Household income for Black householders
Household income for American Indian and Alaska Native householders
Household income for Asian householders
Household income for Some other race householders
Household income for Two or more races householders
Household income for Hispanic or Latino race householders
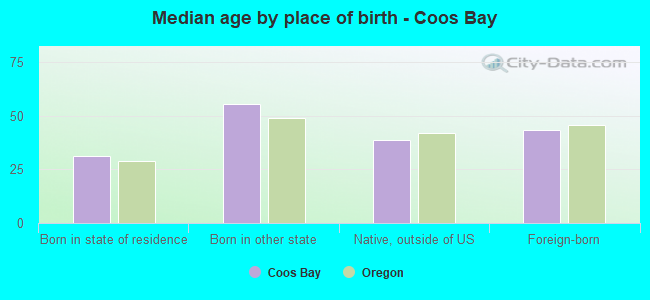
Median age by race in Coos Bay
- 47.0Median age for White residents
- 46.1Males
- 49.3Females
- 37.7Median age for Black or African American residents
- 39.0Males
- -625,514,402.7Females
- 51.1Median age for American Indian / Alaska Native residents
- 47.7Males
- 57.0Females
- 41.2Median age for Asian residents
- -696,883,852.0Males
- 32.1Females
- -764,705,881.6Median age for Native Hawaiian / Pacific Islander residents
- -764,119,600.6Males
- -774,891,774.1Females
- 30.8Median age for Other race residents
- 32.0Males
- 19.3Females
- 22.3Median age for Two or more races residents
- 28.7Males
- 20.5Females
- 47.0Median age for White alone residents
- 46.0Males
- 49.1Females
- 22.7Median age for Hispanic or Latino residents
- 26.5Males
- 20.4Females
Owner/renter occupied households by race in Coos Bay
- House owners and renters - White residents
- 4,01562.1%Owner occupied
- 2,45437.9%Renter occupied
- House owners and renters - Black or African American residents
- 1216.0%Owner occupied
- 6184.0%Renter occupied
- House owners and renters - American Indian / Alaska Native residents
- 3027.5%Owner occupied
- 7972.5%Renter occupied
- House owners and renters - Asian residents
- 4153.7%Owner occupied
- 3546.3%Renter occupied
- House owners and renters - Other race residents
- 6330.3%Owner occupied
- 14569.7%Renter occupied
- House owners and renters - Two or more races residents
- 26061.9%Owner occupied
- 16038.1%Renter occupied
- House owners and renters - White alone residents
- 4,03263.5%Owner occupied
- 2,32236.5%Renter occupied
- House owners and renters - Hispanic or Latino residents
- 13224.3%Owner occupied
- 41275.7%Renter occupied
Language usage in Coos Bay
- English speakers - Total
- 92.8% of residents of Coos Bay speak English at home.
- 5.8% of residents speak Spanish at home
- 58667.4%Speak English very well
- 28332.6%Speak English less than very well
- 1.5% of residents speak other language at home
- 6027.4%Speak English very well
- 15972.6%Speak English less than very well
- English speakers - Born in the United States
- 97.4% of residents of Coos Bay speak English at home.
- 2.4% of residents speak Spanish at home
- 12168.4%Speak English very well
- 5631.6%Speak English less than very well
- 0.1% of residents speak other language at home
- 7100.0%Speak English very well
All residents speak only English at home
- English speakers - Foreign-born
- 28.0% of residents of Coos Bay speak English at home.
- 46.1% of residents speak Spanish at home
- 12034.9%Speak English very well
- 22465.1%Speak English less than very well
- 27.6% of residents speak other language at home
- 4823.3%Speak English very well
- 15876.7%Speak English less than very well
White (Caucasian) - Speak only English
| Native: | 98.5% (12,082) |
| Foreign-born: | 61.6% (83) |
White (Caucasian) - Speak another language
| Native: | 2.0% (241) |
| Foreign-born: | 45.6% (61) |
Black or African American - Speak only English
| Native: | 99.5% (83) |
| Foreign-born: | 100.0% (37) |
American Indian / Alaska Native - Speak another language
| Native: | 33.3% (88) |
| Foreign-born: | 100.0% (33) |
Asian - Speak only English
| Native: | 27.7% (3) |
| Foreign-born: | 12.2% (23) |
Asian - Speak another language
| Native: | 71.0% (8) |
| Foreign-born: | 87.4% (168) |
Other race - Speak only English
| Native: | 62.1% (235) |
| Foreign-born: | 5.5% (17) |
Other race - Speak another language
| Native: | 40.4% (153) |
| Foreign-born: | 94.6% (295) |
Two or more races - Speak only English
| Native: | 98.3% (1,121) |
| Foreign-born: | 63.7% (61) |
White alone - Speak only English
| Native: | 99.7% (12,094) |
| Foreign-born: | 71.3% (88) |
White alone - Speak another language
| Native: | 0.3% (34) |
| Foreign-born: | 29.7% (37) |
Hispanic or Latino - Speak only English
| Native: | 50.0% (499) |
| Foreign-born: | 11.1% (43) |
Hispanic or Latino - Speak another language
| Native: | 49.6% (495) |
| Foreign-born: | 89.2% (345) |
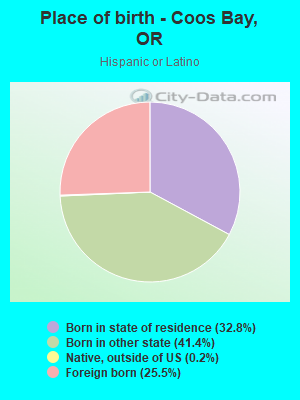
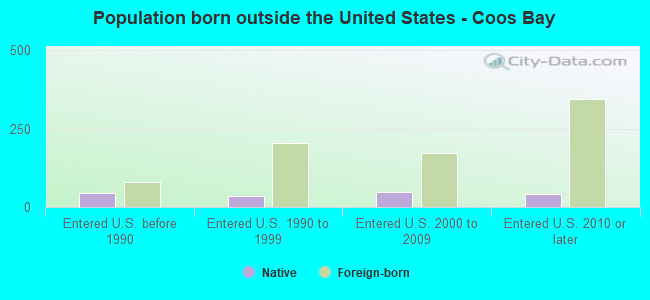
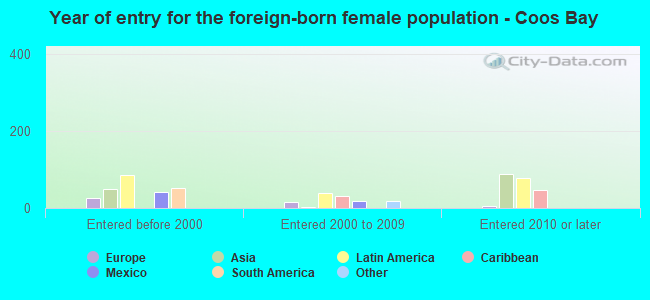
Foreign-born residents in Coos Bay
777 residents are foreign born (3.1% Latin America, 1.1% Asia, 0.5% Europe).
| This city: | 4.9% |
| Oregon: | 9.8% |

Marital status for residents in Coos Bay
Marital status - White (Caucasian) population 15 years and over
- Males
- 38.0%Never married
- 38.4%Now married
- 0.6%Separated
- 5.6%Widowed
- 17.4%Divorced
- Females
- 25.0%Never married
- 37.0%Now married
- 1.3%Separated
- 10.3%Widowed
- 26.4%Divorced
Women who gave birth in the past 12 months
| Now married: | 100.0% (94) |
| Unmarried: | 0.0% (0) |
Women who did not give birth in the past 12 months
| Now married: | 33.0% (772) |
| Unmarried: | 67.0% (1,570) |
Marital status - Black or African American population 15 years and over
- Males
- 72.0%Never married
- 18.7%Now married
- 0.0%Separated
- 0.0%Widowed
- 9.3%Divorced
- Females
- 24.1%Never married
- 75.9%Now married
- 0.0%Separated
- 0.0%Widowed
- 0.0%Divorced
Marital status - American Indian / Alaska Native population 15 years and over
- Males
- 29.5%Never married
- 65.8%Now married
- 0.0%Separated
- 0.0%Widowed
- 4.7%Divorced
- Females
- 77.3%Never married
- 0.0%Now married
- 10.7%Separated
- 0.0%Widowed
- 12.0%Divorced
Women who did not give birth in the past 12 months
| Now married: | 0.0% (0) |
| Unmarried: | 100.0% (39) |
Marital status - Asian population 15 years and over
- Males
- 0.0%Never married
- 100.0%Now married
- 0.0%Separated
- 0.0%Widowed
- 0.0%Divorced
- Females
- 47.0%Never married
- 53.0%Now married
- 0.0%Separated
- 0.0%Widowed
- 0.0%Divorced
Women who did not give birth in the past 12 months
| Now married: | 31.2% (36) |
| Unmarried: | 68.8% (80) |
Marital status - Other race population 15 years and over
- Males
- 48.8%Never married
- 28.0%Now married
- 8.1%Separated
- 0.0%Widowed
- 15.1%Divorced
- Females
- 50.3%Never married
- 49.7%Now married
- 0.0%Separated
- 0.0%Widowed
- 0.0%Divorced
Women who did not give birth in the past 12 months
| Now married: | 38.3% (67) |
| Unmarried: | 61.7% (108) |
Marital status - Two or more races population 15 years and over
- Males
- 31.6%Never married
- 54.0%Now married
- 0.0%Separated
- 0.0%Widowed
- 14.4%Divorced
- Females
- 42.1%Never married
- 22.2%Now married
- 6.9%Separated
- 2.5%Widowed
- 26.4%Divorced
Women who did not give birth in the past 12 months
| Now married: | 41.8% (147) |
| Unmarried: | 58.2% (204) |
Marital status - White alone, not Hispanic / Latino population 15 years and over
- Males
- 37.2%Never married
- 38.8%Now married
- 0.6%Separated
- 5.8%Widowed
- 17.5%Divorced
- Females
- 23.9%Never married
- 37.6%Now married
- 1.3%Separated
- 10.7%Widowed
- 26.4%Divorced
Women who gave birth in the past 12 months
| Now married: | 100.0% (97) |
| Unmarried: | 0.0% (0) |
Women who did not give birth in the past 12 months
| Now married: | 34.2% (787) |
| Unmarried: | 65.8% (1,515) |
Marital status - Hispanic or Latino population 15 years and over
- Males
- 48.1%Never married
- 35.3%Now married
- 4.6%Separated
- 0.0%Widowed
- 12.0%Divorced
- Females
- 53.5%Never married
- 27.0%Now married
- 1.5%Separated
- 0.0%Widowed
- 17.9%Divorced
Women who did not give birth in the past 12 months
| Now married: | 24.5% (96) |
| Unmarried: | 75.5% (296) |
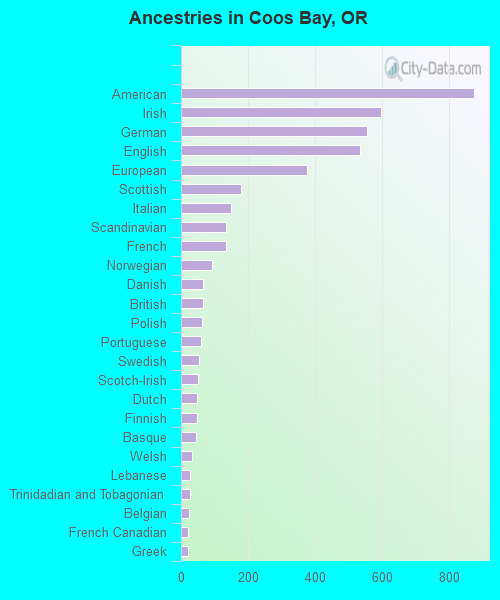
Ancestries in Coos Bay

- 87714.0%American
- 5989.6%Irish
- 5568.9%German
- 5368.6%English
- 3776.0%European
- 1792.9%Scottish
- 1502.4%Italian
- 1352.2%Scandinavian
- 1342.1%French
- 921.5%Norwegian
- 661.1%Danish
- 651.0%British
- 621.0%Polish
- 611.0%Portuguese
- 550.9%Swedish
- 520.8%Scotch-Irish
- 470.8%Dutch
- 470.8%Finnish
- 440.7%Basque
- 340.5%Welsh
- 280.4%Lebanese
- 260.4%Trinidadian and Tobagonian
- 250.4%Belgian
- 220.4%French Canadian
- 220.4%Greek
- 160.3%Northern European
- 130.2%Slavic
- 110.2%Canadian
- 110.2%Jamaican
- 100.2%Austrian
- 80.1%Russian
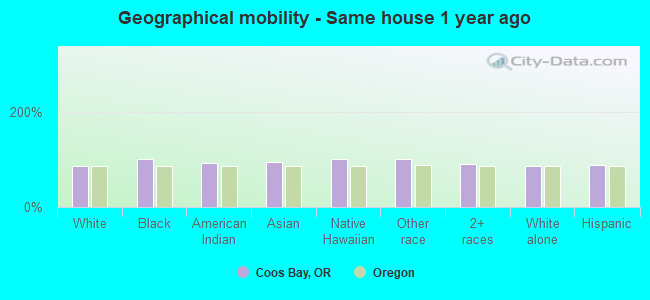
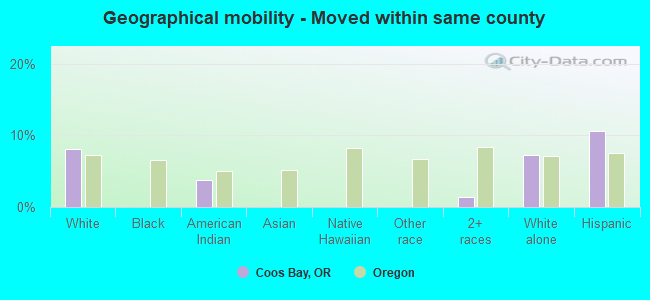
Geographical mobility in Coos Bay

- Same house 1 year ago
- 10,93885.4%White (Caucasian)
- 127100.0%Black or African American
- 28093.4%American Indian / Alaska Native
- 19995.3%Asian
- 8100.0%Native Hawaiian / Pacific Islander
- 782100.0%Other race
- 1,35690.3%Two or more races
- 11,00686.2%White alone, not Hispanic / Latino
- 1,30488.1%Hispanic or Latino
-
- Moved within same county
- 1,0358.1%White / Caucasian
- 113.7%American Indian / Alaska Native
- 201.3%Two or more races
- 9197.2%White alone, not Hispanic / Latino
- 15610.6%Hispanic or Latino
-
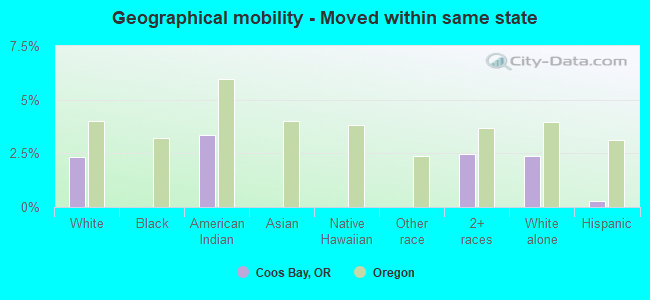
- Moved within same state
- 2962.3%White / Caucasian
- 103.4%American Indian / Alaska Native
- 372.4%Two or more races
- 3022.4%White alone, not Hispanic / Latino
- 40.3%Hispanic or Latino
-
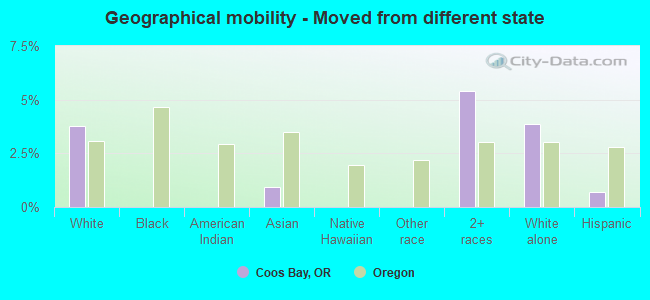
- Moved from different state
- 4863.8%White / Caucasian
- 21.0%Asian
- 815.4%Two or more races
- 4943.9%White alone, not Hispanic / Latino
- 100.7%Hispanic or Latino
-
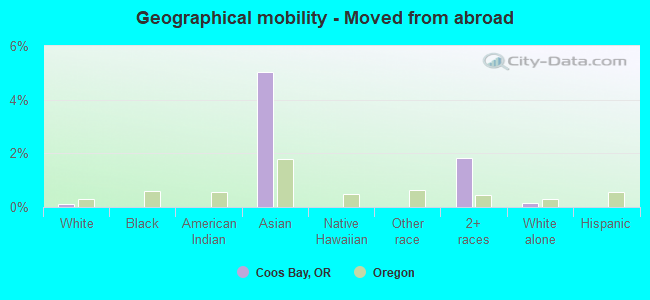
- Moved from abroad
- 170.1%White
- 105.0%Asian
- 271.8%Two or more races
- 180.1%White alone, not Hispanic / Latino
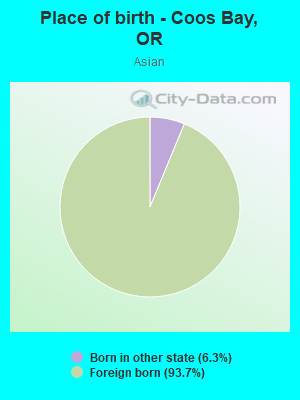
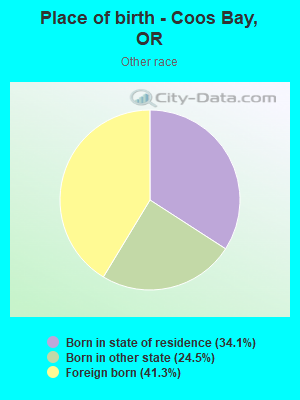
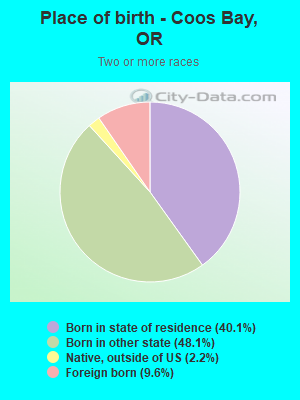
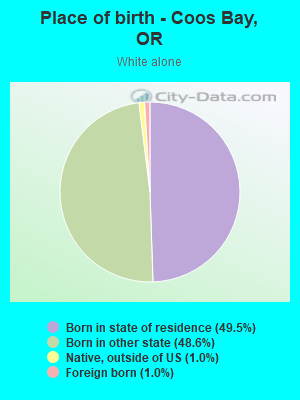
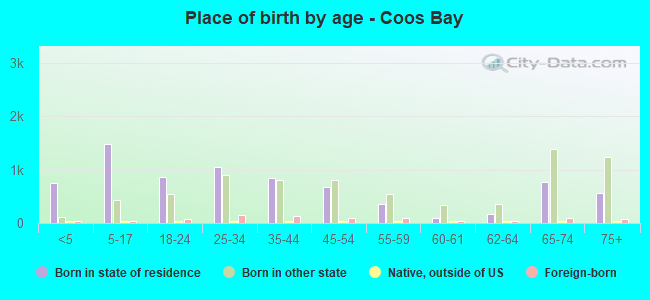
Children Nativity (place of birth) in Coos Bay
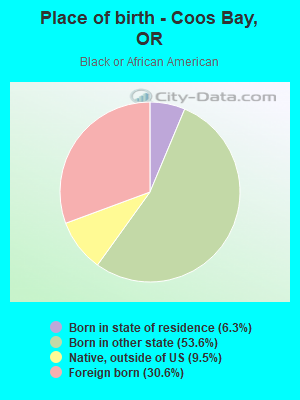
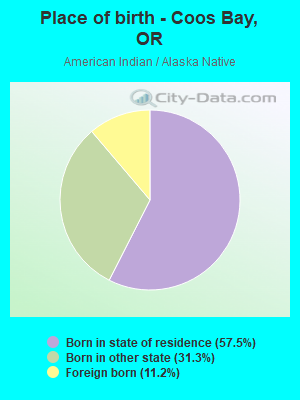
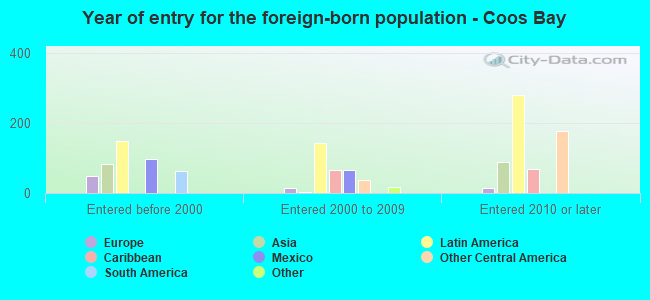
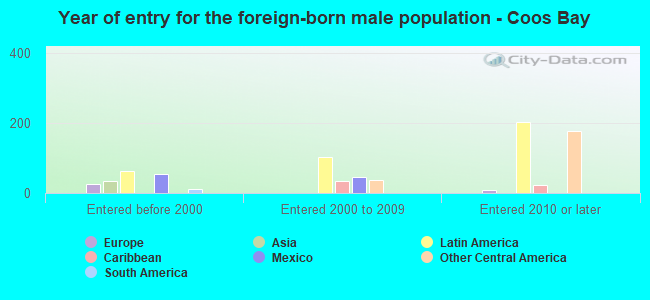
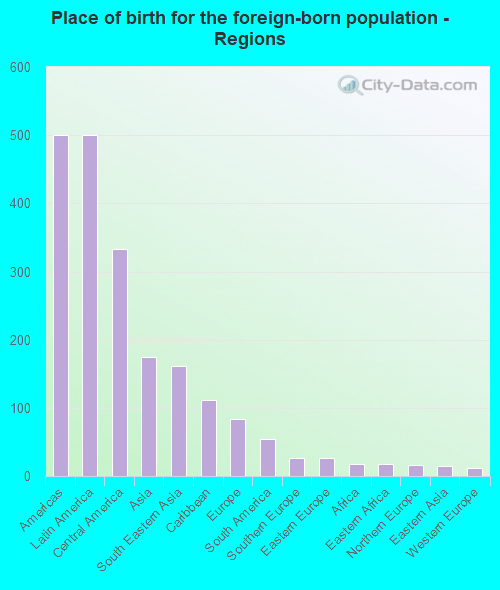
Place of birth for residents in Coos Bay
![Place of birth for the foreign-born population - Regions]()
- 500Americas
- 500Latin America
- 333Central America
- 175Asia
- 161South Eastern Asia
- 112Caribbean
- 83Europe
- 55South America
- 27Southern Europe
- 27Eastern Europe
- 18Africa
- 18Eastern Africa
- 16Northern Europe
- 14Eastern Asia
- 12Western Europe
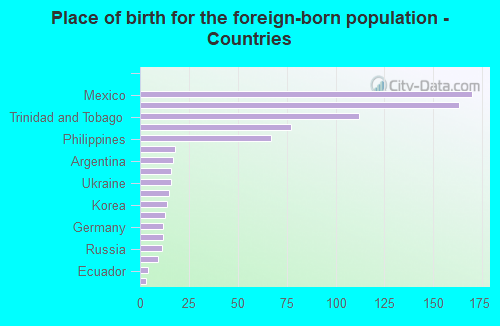
![Place of birth for the foreign-born population - Countries]()
- 170Mexico
- 163Guatemala
- 112Trinidad and Tobago
- 77Vietnam
- 67Philippines
- 18Zimbabwe
- 17Argentina
- 16United Kingdom
- 16Ukraine
- 15Greece
- 14Korea
- 13Thailand
- 12Germany
- 12Italy
- 11Russia
- 9Colombia
- 4Ecuador
- 3Laos
Grandparents responsible for own grandchildren in Coos Bay
Zip codes: 97459.