Races in Corvallis, Oregon (OR) Detailed Stats
Data:
Races - White alone (%)
Races - White alone (% change since 2000)
Races - Black alone (%)
Races - Black alone (% change since 2000)
Races - American Indian alone (%)
Races - American Indian alone (% change since 2000)
Races - Asian alone (%)
Races - Asian alone (% change since 2000)
Races - Hispanic (%)
Races - Hispanic (% change since 2000)
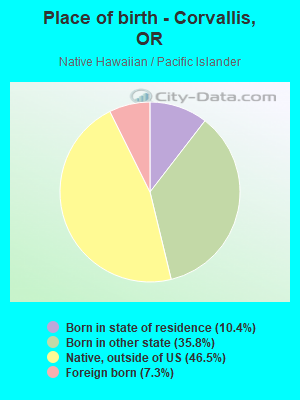
Races - Native Hawaiian and Other Pacific Islander alone (%)
Races - Native Hawaiian and Other Pacific Islander alone (% change since 2000)
Races - Two or more races(%)
Races - Two or more races(% change since 2000)
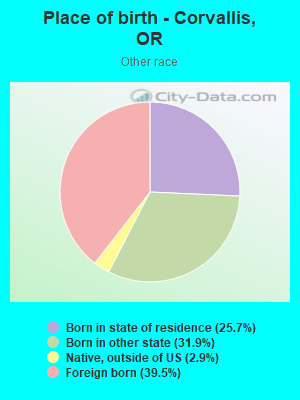
Races - Other race alone (%)
Races - Other race alone (% change since 2000)
Racial diversity
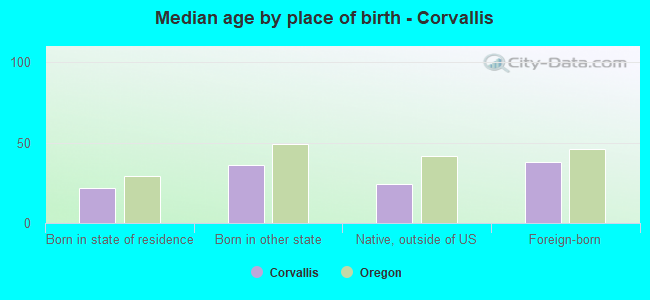
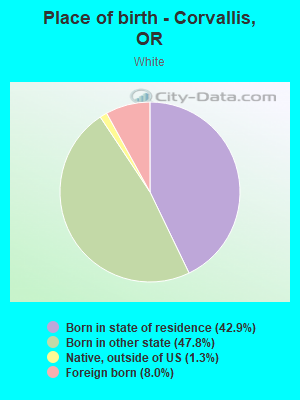
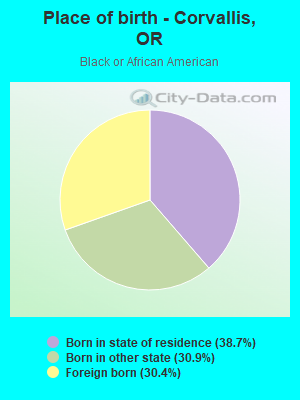
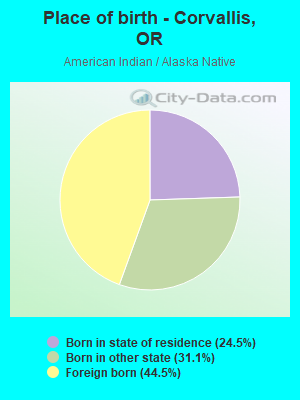
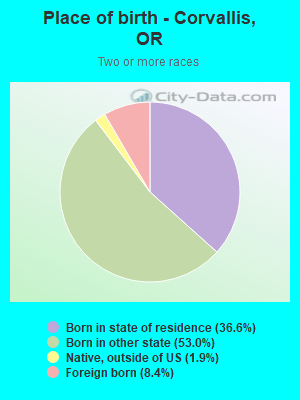
Place of birth - Born in state of residence (%)
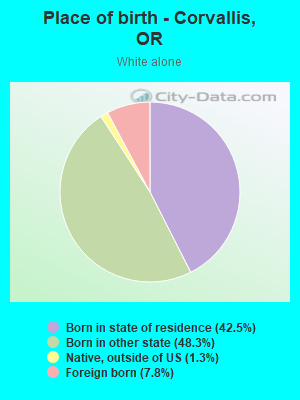
Place of birth - Born in state of residence (%) - White
Place of birth - Born in state of residence (%) - Black or African American
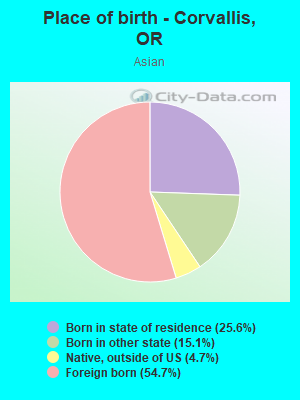
Place of birth - Born in state of residence (%) - Asian
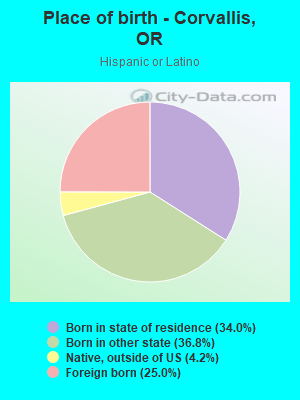
Place of birth - Born in state of residence (%) - Hispanic or Latino
Place of birth - Born in state of residence (%) - American Indian and Alaska Native
Place of birth - Born in state of residence (%) - Multirace
Place of birth - Born in state of residence (%) - Other Race
Place of birth - Born in other state (%)
Place of birth - Born in other state (%) - White
Place of birth - Born in other state (%) - Black or African American
Place of birth - Born in other state (%) - Asian
Place of birth - Born in other state (%) - Hispanic or Latino
Place of birth - Born in other state (%) - American Indian and Alaska Native
Place of birth - Born in other state (%) - Multirace
Place of birth - Born in other state (%) - Other Race
Place of birth - Native, outside of US (%)
Place of birth - Native, outside of US (%) - White
Place of birth - Native, outside of US (%) - Black or African American
Place of birth - Native, outside of US (%) - Asian
Place of birth - Native, outside of US (%) - Hispanic or Latino
Place of birth - Native, outside of US (%) - American Indian and Alaska Native
Place of birth - Native, outside of US (%) - Multirace
Place of birth - Native, outside of US (%) - Other Race
Place of birth - Foreign born (%)
Place of birth - Foreign born (%) - White
Place of birth - Foreign born (%) - Black or African American
Place of birth - Foreign born (%) - Asian
Place of birth - Foreign born (%) - Hispanic or Latino
Place of birth - Foreign born (%) - American Indian and Alaska Native
Place of birth - Foreign born (%) - Multirace
Place of birth - Foreign born (%) - Other Race
Residents speaking English at home (%)
Residents speaking English at home - Born in the United States (%)
Residents speaking English at home - Native, born elsewhere (%)
Residents speaking English at home - Foreign born (%)
Residents speaking Spanish at home (%)
Residents speaking Spanish at home - Born in the United States (%)
Residents speaking Spanish at home - Native, born elsewhere (%)
Residents speaking Spanish at home - Foreign born (%)
Residents speaking other language at home (%)
Residents speaking other language at home - Born in the United States (%)
Residents speaking other language at home - Native, born elsewhere (%)
Residents speaking other language at home - Foreign born (%)
Marital status - Never married (%)
Marital status - Now married (%)
Marital status - Separated (%)
Marital status - Widowed (%)
Marital status - Divorced (%)
Ancestries Reported - Arab (%)
Ancestries Reported - Czech (%)
Ancestries Reported - Danish (%)
Ancestries Reported - Dutch (%)
Ancestries Reported - English (%)
Ancestries Reported - French (%)
Ancestries Reported - French Canadian (%)
Ancestries Reported - German (%)
Ancestries Reported - Greek (%)
Ancestries Reported - Hungarian (%)
Ancestries Reported - Irish (%)
Ancestries Reported - Italian (%)
Ancestries Reported - Lithuanian (%)
Ancestries Reported - Norwegian (%)
Ancestries Reported - Polish (%)
Ancestries Reported - Portuguese (%)
Ancestries Reported - Russian (%)
Ancestries Reported - Scotch-Irish (%)
Ancestries Reported - Scottish (%)
Ancestries Reported - Slovak (%)
Ancestries Reported - Subsaharan African (%)
Ancestries Reported - Swedish (%)
Ancestries Reported - Swiss (%)
Ancestries Reported - Ukrainian (%)
Ancestries Reported - United States (%)
Ancestries Reported - Welsh (%)
Ancestries Reported - West Indian (%)
Ancestries Reported - Other (%)
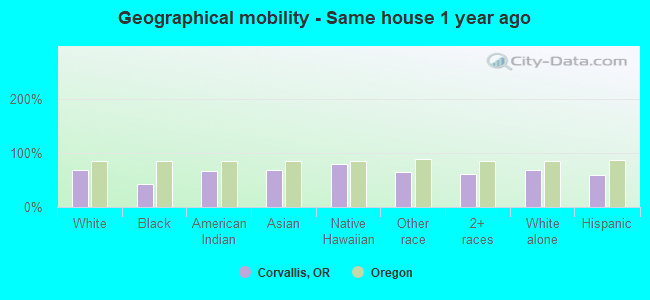
Geographical mobility - Same house 1 year ago (%)
Geographical mobility - Same house 1 year ago (%) - White
Geographical mobility - Same house 1 year ago (%) - Black or African American
Geographical mobility - Same house 1 year ago (%) - Asian
Geographical mobility - Same house 1 year ago (%) - Hispanic or Latino
Geographical mobility - Same house 1 year ago (%) - American Indian and Alaska Native
Geographical mobility - Same house 1 year ago (%) - Multirace
Geographical mobility - Same house 1 year ago (%) - Other Race
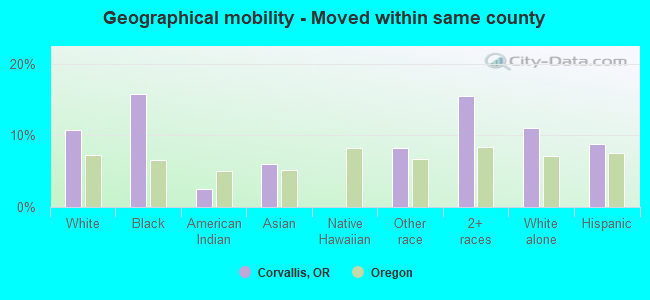
Geographical mobility - Moved within same county (%)
Geographical mobility - Moved within same county (%) - White
Geographical mobility - Moved within same county (%) - Black or African American
Geographical mobility - Moved within same county (%) - Asian
Geographical mobility - Moved within same county (%) - Hispanic or Latino
Geographical mobility - Moved within same county (%) - American Indian and Alaska Native
Geographical mobility - Moved within same county (%) - Multirace
Geographical mobility - Moved within same county (%) - Other Race
Geographical mobility - Moved from different county within same state (%)
Geographical mobility - Moved from different county within same state (%) - White
Geographical mobility - Moved from different county within same state (%) - Black or African American
Geographical mobility - Moved from different county within same state (%) - Asian
Geographical mobility - Moved from different county within same state (%) - Hispanic or Latino
Geographical mobility - Moved from different county within same state (%) - American Indian and Alaska Native
Geographical mobility - Moved from different county within same state (%) - Multirace
Geographical mobility - Moved from different county within same state (%) - Other Race
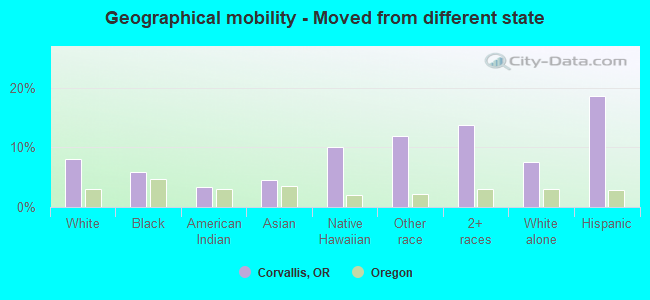
Geographical mobility - Moved from different state (%)
Geographical mobility - Moved from different state (%) - White
Geographical mobility - Moved from different state (%) - Black or African American
Geographical mobility - Moved from different state (%) - Asian
Geographical mobility - Moved from different state (%) - Hispanic or Latino
Geographical mobility - Moved from different state (%) - American Indian and Alaska Native
Geographical mobility - Moved from different state (%) - Multirace
Geographical mobility - Moved from different state (%) - Other Race
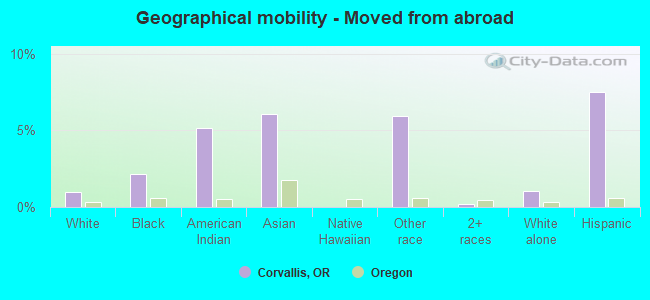
Geographical mobility - Moved from abroad (%)
Geographical mobility - Moved from abroad (%) - White
Geographical mobility - Moved from abroad (%) - Black or African American
Geographical mobility - Moved from abroad (%) - Asian
Geographical mobility - Moved from abroad (%) - Hispanic or Latino
Geographical mobility - Moved from abroad (%) - American Indian and Alaska Native
Geographical mobility - Moved from abroad (%) - Multirace
Geographical mobility - Moved from abroad (%) - Other Race
Place of birth for the foreign-born population - Ireland (%)
Place of birth for the foreign-born population - Denmark (%)
Place of birth for the foreign-born population - Norway (%)
Place of birth for the foreign-born population - Sweden (%)
Place of birth for the foreign-born population - United Kingdom (%)
Place of birth for the foreign-born population - England (%)
Place of birth for the foreign-born population - Scotland (%)
Place of birth for the foreign-born population - Other Northern Europe (%)
Place of birth for the foreign-born population - Austria (%)
Place of birth for the foreign-born population - Belgium (%)
Place of birth for the foreign-born population - France (%)
Place of birth for the foreign-born population - Germany (%)
Place of birth for the foreign-born population - Netherlands (%)
Place of birth for the foreign-born population - Switzerland (%)
Place of birth for the foreign-born population - Other Western Europe (%)
Place of birth for the foreign-born population - Greece (%)
Place of birth for the foreign-born population - Italy (%)
Place of birth for the foreign-born population - Portugal (%)
Place of birth for the foreign-born population - Spain (%)
Place of birth for the foreign-born population - Other Southern Europe (%)
Place of birth for the foreign-born population - Albania (%)
Place of birth for the foreign-born population - Belarus (%)
Place of birth for the foreign-born population - Bosnia and Herzegovina (%)
Place of birth for the foreign-born population - Bulgaria (%)
Place of birth for the foreign-born population - Croatia (%)
Place of birth for the foreign-born population - Czechoslovakia (%)
Place of birth for the foreign-born population - Hungary (%)
Place of birth for the foreign-born population - Latvia (%)
Place of birth for the foreign-born population - Lithuania (%)
Place of birth for the foreign-born population - North Macedonia (Macedonia) (%)
Place of birth for the foreign-born population - Moldova (%)
Place of birth for the foreign-born population - Poland (%)
Place of birth for the foreign-born population - Romania (%)
Place of birth for the foreign-born population - Russia (%)
Place of birth for the foreign-born population - Serbia (%)
Place of birth for the foreign-born population - Ukraine (%)
Place of birth for the foreign-born population - Other Eastern Europe (%)
Place of birth for the foreign-born population - China (%)
Place of birth for the foreign-born population - Hong Kong (%)
Place of birth for the foreign-born population - Taiwan (%)
Place of birth for the foreign-born population - Japan (%)
Place of birth for the foreign-born population - Korea (%)
Place of birth for the foreign-born population - Other Eastern Asia (%)
Place of birth for the foreign-born population - Afghanistan (%)
Place of birth for the foreign-born population - Bangladesh (%)
Place of birth for the foreign-born population - India (%)
Place of birth for the foreign-born population - Iran (%)
Place of birth for the foreign-born population - Kazakhstan (%)
Place of birth for the foreign-born population - Nepal (%)
Place of birth for the foreign-born population - Pakistan (%)
Place of birth for the foreign-born population - Sri Lanka (%)
Place of birth for the foreign-born population - Uzbekistan (%)
Place of birth for the foreign-born population - Other South Central Asia (%)
Place of birth for the foreign-born population - Burma (%)
Place of birth for the foreign-born population - Cambodia (%)
Place of birth for the foreign-born population - Indonesia (%)
Place of birth for the foreign-born population - Laos (%)
Place of birth for the foreign-born population - Malaysia (%)
Place of birth for the foreign-born population - Philippines (%)
Place of birth for the foreign-born population - Singapore (%)
Place of birth for the foreign-born population - Thailand (%)
Place of birth for the foreign-born population - Vietnam (%)
Place of birth for the foreign-born population - Other South Eastern Asia (%)
Place of birth for the foreign-born population - Armenia (%)
Place of birth for the foreign-born population - Iraq (%)
Place of birth for the foreign-born population - Israel (%)
Place of birth for the foreign-born population - Jordan (%)
Place of birth for the foreign-born population - Kuwait (%)
Place of birth for the foreign-born population - Lebanon (%)
Place of birth for the foreign-born population - Saudi Arabia (%)
Place of birth for the foreign-born population - Syria (%)
Place of birth for the foreign-born population - Turkey (%)
Place of birth for the foreign-born population - Yemen (%)
Place of birth for the foreign-born population - Other Western Asia (%)
Place of birth for the foreign-born population - Eritrea (%)
Place of birth for the foreign-born population - Ethiopia (%)
Place of birth for the foreign-born population - Kenya (%)
Place of birth for the foreign-born population - Somalia (%)
Place of birth for the foreign-born population - Uganda (%)
Place of birth for the foreign-born population - Zimbabwe (%)
Place of birth for the foreign-born population - Other Eastern Africa (%)
Place of birth for the foreign-born population - Cameroon (%)
Place of birth for the foreign-born population - Congo (%)
Place of birth for the foreign-born population - Democratic Republic of Congo (Zaire) (%)
Place of birth for the foreign-born population - Other Middle Africa (%)
Place of birth for the foreign-born population - Egypt (%)
Place of birth for the foreign-born population - Morocco (%)
Place of birth for the foreign-born population - Sudan (%)
Place of birth for the foreign-born population - Other Northern Africa (%)
Place of birth for the foreign-born population - South Africa (%)
Place of birth for the foreign-born population - Other Southern Africa (%)
Place of birth for the foreign-born population - Cabo Verde (%)
Place of birth for the foreign-born population - Ghana (%)
Place of birth for the foreign-born population - Liberia (%)
Place of birth for the foreign-born population - Nigeria (%)
Place of birth for the foreign-born population - Senegal (%)
Place of birth for the foreign-born population - Sierra Leone (%)
Place of birth for the foreign-born population - Other Western Africa (%)
Place of birth for the foreign-born population - Australia (%)
Place of birth for the foreign-born population - New Zealand (%)
Place of birth for the foreign-born population - Fiji (%)
Place of birth for the foreign-born population - Micronesia (%)
Place of birth for the foreign-born population - Bahamas (%)
Place of birth for the foreign-born population - Barbados (%)
Place of birth for the foreign-born population - Cuba (%)
Place of birth for the foreign-born population - Dominica (%)
Place of birth for the foreign-born population - Dominican Republic (%)
Place of birth for the foreign-born population - Grenada (%)
Place of birth for the foreign-born population - Haiti (%)
Place of birth for the foreign-born population - Jamaica (%)
Place of birth for the foreign-born population - St. Vincent and the Grenadines (%)
Place of birth for the foreign-born population - Trinidad and Tobago (%)
Place of birth for the foreign-born population - West Indies (%)
Place of birth for the foreign-born population - Other Caribbean (%)
Place of birth for the foreign-born population - Belize (%)
Place of birth for the foreign-born population - Costa Rica (%)
Place of birth for the foreign-born population - El Salvador (%)
Place of birth for the foreign-born population - Guatemala (%)
Place of birth for the foreign-born population - Honduras (%)
Place of birth for the foreign-born population - Mexico (%)
Place of birth for the foreign-born population - Nicaragua (%)
Place of birth for the foreign-born population - Panama (%)
Place of birth for the foreign-born population - Other Central America (%)
Place of birth for the foreign-born population - Argentina (%)
Place of birth for the foreign-born population - Bolivia (%)
Place of birth for the foreign-born population - Brazil (%)
Place of birth for the foreign-born population - Chile (%)
Place of birth for the foreign-born population - Colombia (%)
Place of birth for the foreign-born population - Ecuador (%)
Place of birth for the foreign-born population - Guyana (%)
Place of birth for the foreign-born population - Peru (%)
Place of birth for the foreign-born population - Uruguay (%)
Place of birth for the foreign-born population - Venezuela (%)
Place of birth for the foreign-born population - Other South America (%)
Place of birth for the foreign-born population - Canada (%)
Place of birth for the foreign-born population - Other Northern America (%)
Place of birth for the foreign-born population - Other (%)
Latest news about races in Corvallis, OR collected exclusively by city-data.com from local newspapers, TV, and radio stations
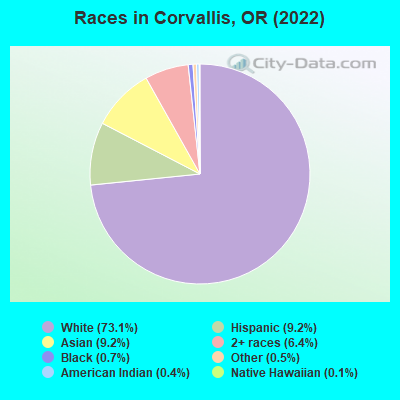
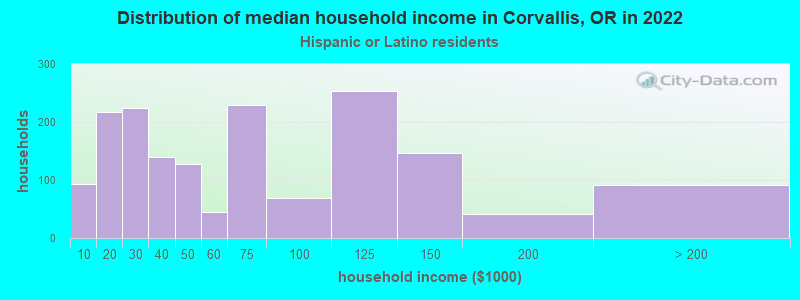
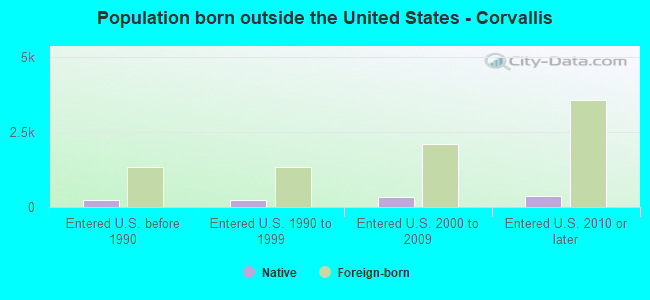
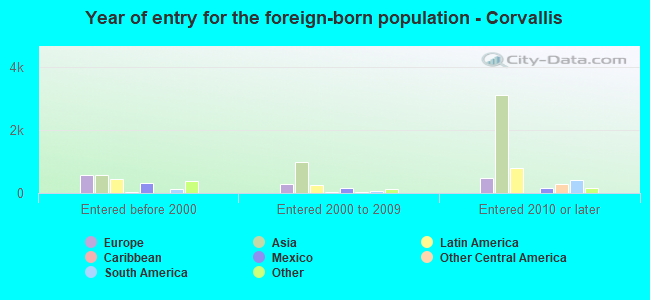
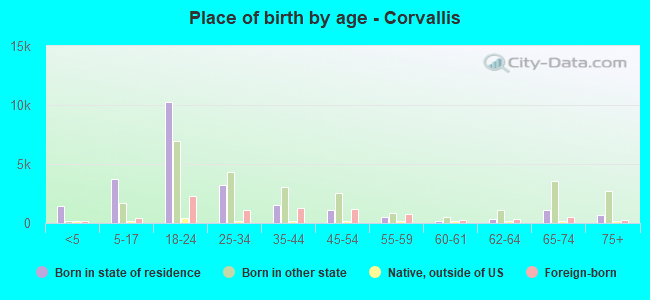
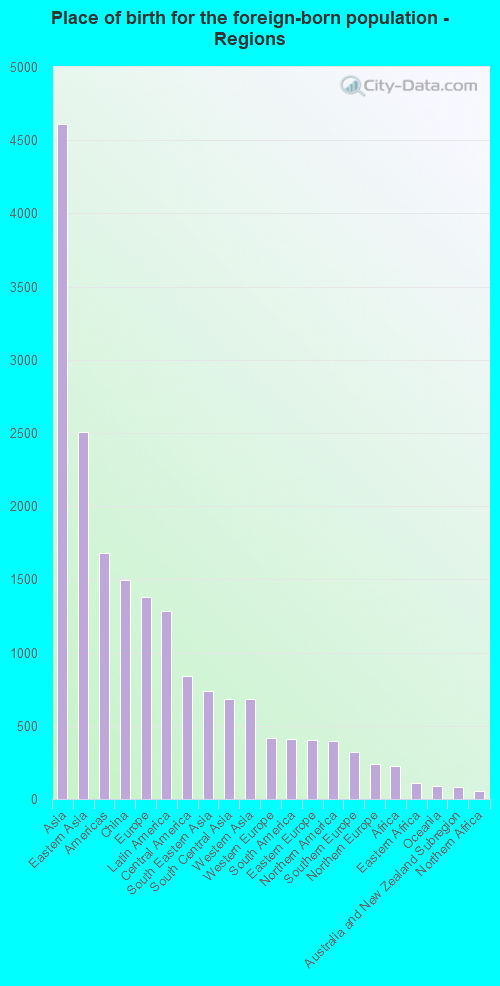
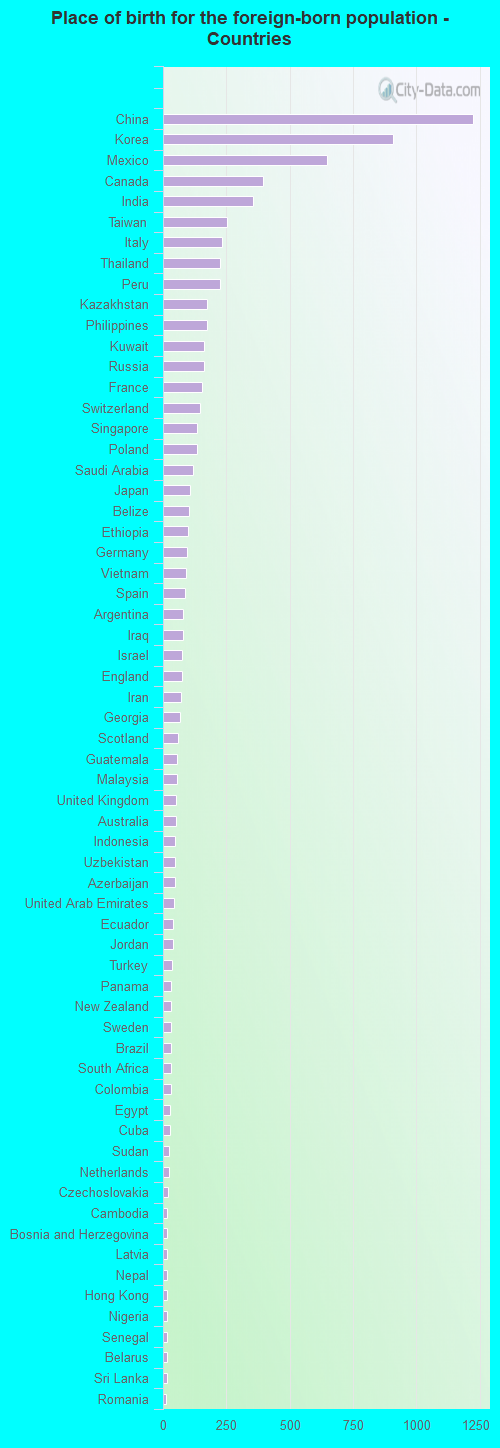
According to 2022 data, the most numerous races in Corvallis, OR are White alone (44,845 residents), Hispanic (5,655 residents), and Two or more races (3,931 residents). 84.2% of Corvallis residents speak English at home. 13.0% of Corvallis, OR residents are foreign-born (7.5% born in Asia, 2.3% born in Europe, 2.1% born in Latin America), which is 30.9% greater than the foreign-born rate of 9.0% across the entire state of Oregon.
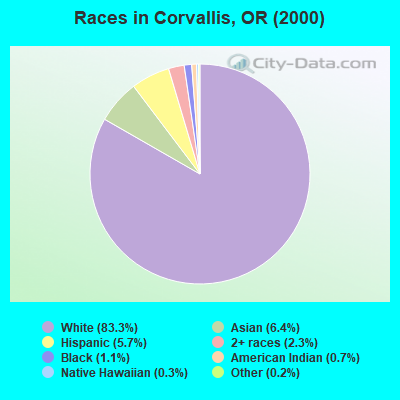
Race distribution in Corvallis
2000 2022
2,857,616 83.5% White alone 275,314 8.0% Hispanic 100,333 2.9% Asian alone 82,733 2.4% Two or more races 53,325 1.6% Black alone 40,130 1.2% American Indian alone 7,398 0.2% Native Hawaiian and Other 4,550 0.1% Other race alone
3,037,571 71.6% White alone 609,538 14.4% Hispanic 252,744 6.0% Two or more races 191,283 4.5% Asian alone 78,228 1.8% Black alone 29,399 0.7% American Indian alone 25,731 0.6% Other race alone 15,643 0.4% Native Hawaiian and Other
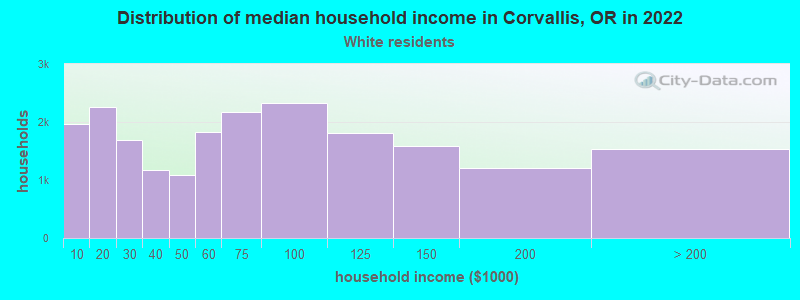
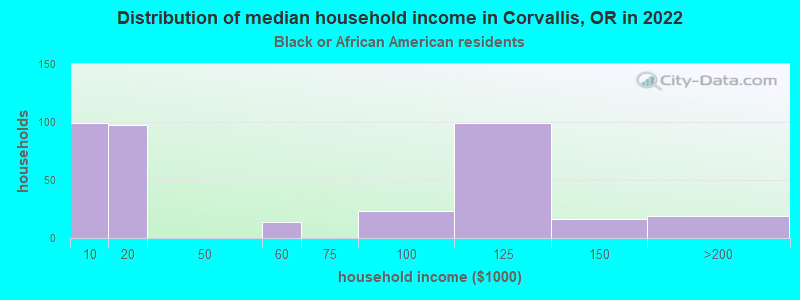
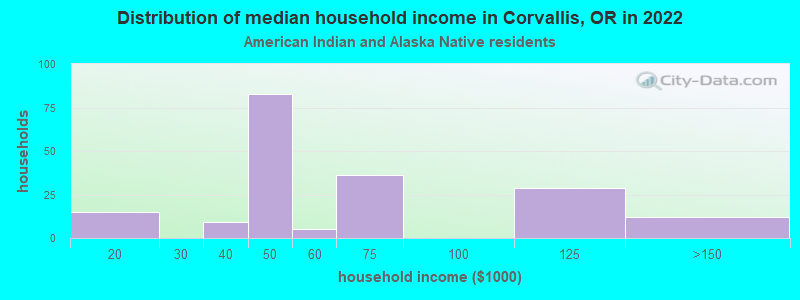
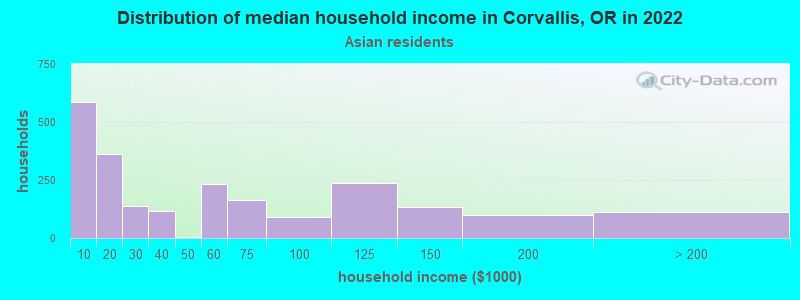
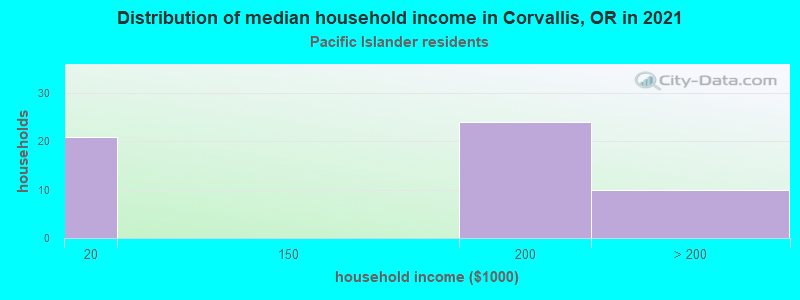
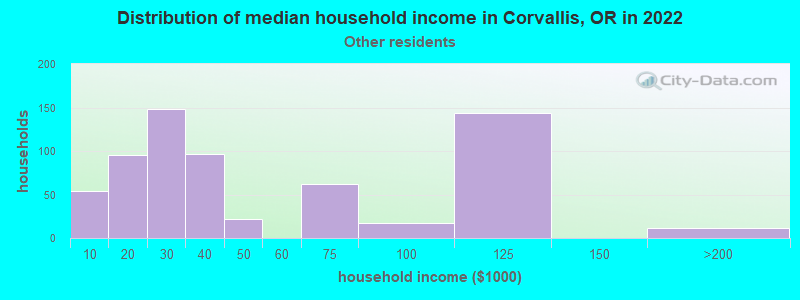
Income and house value in Corvallis Median household income in 2022 $60,009 White non-Hispanic householders$45,023 American Indian and Alaska Native householders$40,716 Asian householders$141,665 Native Hawaiian and other Pacific Islander householders$31,949 Some other race householders$38,759 Two or more races householders$45,230 Hispanic or Latino race householdersMedian 2022 house value $528,877 White Non-Hispanic householders$657,944 Black or African American householders$395,828 American Indian or Alaska Native householders $608,839 Asian householders$282,023 Native Hawaiian and other Pacific Islander householders$617,466 Some other race householders$487,403 Two or more races householders$446,924 Hispanic or Latino householders
Median age by race in Corvallis
29.5 Median age for White residents27.7 30.9 39.5 Median age for Black or African American residents23.3 20.6 47.1 Median age for American Indian / Alaska Native residents43.5 30.0 21.9 Median age for Asian residents21.4 24.2 23.0 Median age for Native Hawaiian / Pacific Islander residents24.0 32.8 31.8 Median age for Other race residents43.2 34.0 22.8 Median age for Two or more races residents27.2 21.8 30.2 Median age for White alone residents29.3 31.7 23.6 Median age for Hispanic or Latino residents23.0 23.6
Owner/renter occupied households by race in Corvallis
House owners and renters - White residents 8,942 43.7% Owner occupied11,533 56.3% Renter occupiedHouse owners and renters - Black or African American residents 32 7.8% Owner occupied376 92.2% Renter occupiedHouse owners and renters - American Indian / Alaska Native residents 26 15.1% Owner occupied147 84.9% Renter occupiedHouse owners and renters - Asian residents 597 32.9% Owner occupied1,217 67.1% Renter occupiedHouse owners and renters - Native Hawaiian / Pacific Islander residents 23 100.0% Owner occupiedHouse owners and renters - Other race residents 101 35.2% Owner occupied186 64.8% Renter occupiedHouse owners and renters - Two or more races residents 459 33.5% Owner occupied910 66.5% Renter occupiedHouse owners and renters - White alone residents 8,794 44.4% Owner occupied11,016 55.6% Renter occupiedHouse owners and renters - Hispanic or Latino residents 444 30.4% Owner occupied1,016 69.6% Renter occupied
Language usage in Corvallis
English speakers - Total 84.2% of residents of Corvallis speak English at home.
4.8% of residents speak Spanish at home 1,912 66.8% Speak English very well950 33.2% Speak English less than very well10.6% of residents speak other language at home 4,801 76.1% Speak English very well1,510 23.9% Speak English less than very well
English speakers - Born in the United States 93.7% of residents of Corvallis speak English at home.
3.1% of residents speak Spanish at home 753 89.3% Speak English very well90 10.7% Speak English less than very well2.8% of residents speak other language at home 672 89.7% Speak English very well77 10.3% Speak English less than very well
English speakers - Native, born elsewhere 94.8% of residents of Corvallis speak English at home.
16.5% of residents speak Spanish at home 74 42.8% Speak English very well99 57.2% Speak English less than very well7.1% of residents speak other language at home 56 75.7% Speak English very well18 24.3% Speak English less than very well
English speakers - Foreign-born 31.7% of residents of Corvallis speak English at home.
14.3% of residents speak Spanish at home 507 41.8% Speak English very well707 58.2% Speak English less than very well52.8% of residents speak other language at home 3,316 74.1% Speak English very well1,162 25.9% Speak English less than very well
White (Caucasian) - Speak only English Native:
95.7% (41,160)Foreign-born:
47.1% (1,800)
White (Caucasian) - Speak another language Native:
4.4% (1,876)Foreign-born:
53.1% (2,032)
Black or African American - Speak only English Native:
99.5% (736)Foreign-born:
12.0% (40)
American Indian / Alaska Native - Speak only English Native:
62.2% (203)Foreign-born:
25.6% (99)
American Indian / Alaska Native - Speak another language Native:
37.5% (122)Foreign-born:
71.5% (278)
Asian - Speak only English Native:
55.4% (1,279)Foreign-born:
16.7% (523)
Asian - Speak another language Native:
43.0% (993)Foreign-born:
82.5% (2,577)
Native Hawaiian / Pacific Islander - Speak another language Native:
51.4% (41)Foreign-born:
96.9% (7)
Other race - Speak only English Native:
37.1% (371)Foreign-born:
11.0% (79)
Other race - Speak another language Native:
61.9% (619)Foreign-born:
88.9% (636)
Two or more races - Speak only English Native:
81.5% (3,781)Foreign-born:
23.9% (109)
Two or more races - Speak another language Native:
18.4% (856)Foreign-born:
75.6% (345)
White alone - Speak only English Native:
97.2% (39,482)Foreign-born:
53.9% (1,900)
White alone - Speak another language Native:
2.7% (1,101)Foreign-born:
46.0% (1,621)
Hispanic or Latino - Speak only English Native:
72.3% (2,949)Foreign-born:
13.5% (194)
Hispanic or Latino - Speak another language Native:
26.4% (1,075)Foreign-born:
85.6% (1,230)
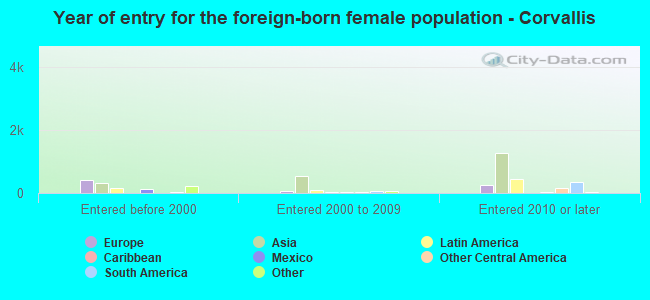
Foreign-born residents in Corvallis 7,989 residents are foreign born (7.5% Asia , 2.3% Europe , 2.1% Latin America ).
This city:
13.0%Oregon:
9.8%
Marital status for residents in Corvallis Marital status - White (Caucasian) population 15 years and over
Males 57.0% Never married34.9% Now married0.3% Separated1.3% Widowed6.5% DivorcedFemales 51.3% Never married31.8% Now married0.6% Separated5.8% Widowed10.5% DivorcedWomen who gave birth in the past 12 months Now married:
67.1% (168)Unmarried:
32.9% (83)
Women who did not give birth in the past 12 months Now married:
21.3% (3,055)Unmarried:
78.7% (11,307)
Marital status - Black or African American population 15 years and over
Males 72.8% Never married11.3% Now married0.0% Separated0.0% Widowed15.9% DivorcedFemales 91.2% Never married4.7% Now married0.0% Separated4.1% Widowed0.0% DivorcedWomen who did not give birth in the past 12 months Now married:
5.1% (17)Unmarried:
94.9% (318)
Marital status - American Indian / Alaska Native population 15 years and over
Males 70.5% Never married29.2% Now married0.0% Separated0.3% Widowed0.0% DivorcedFemales 49.1% Never married43.4% Now married0.0% Separated0.0% Widowed7.4% DivorcedWomen who did not give birth in the past 12 months Now married:
33.8% (48)Unmarried:
66.2% (94)
Marital status - Asian population 15 years and over
Males 71.2% Never married26.3% Now married0.0% Separated0.5% Widowed2.0% DivorcedFemales 58.3% Never married38.3% Now married3.0% Separated0.4% Widowed0.0% DivorcedWomen who gave birth in the past 12 months Now married:
81.7% (42)Unmarried:
18.3% (9)
Women who did not give birth in the past 12 months Now married:
30.7% (495)Unmarried:
69.3% (1,117)
Marital status - Native Hawaiian / Pacific Islander population 15 years and over
Males 56.8% Never married0.0% Now married0.0% Separated0.0% Widowed43.2% DivorcedFemales 54.2% Never married27.1% Now married0.0% Separated0.0% Widowed18.8% DivorcedWomen who did not give birth in the past 12 months Now married:
0.0% (0)Unmarried:
100.0% (27)
Marital status - Other race population 15 years and over
Males 38.3% Never married37.1% Now married9.7% Separated0.0% Widowed14.9% DivorcedFemales 60.9% Never married21.8% Now married0.0% Separated7.5% Widowed9.8% DivorcedWomen who did not give birth in the past 12 months Now married:
19.9% (101)Unmarried:
80.1% (406)
Marital status - Two or more races population 15 years and over
Males 73.2% Never married20.8% Now married0.4% Separated0.1% Widowed5.5% DivorcedFemales 70.6% Never married19.8% Now married2.6% Separated0.1% Widowed6.9% DivorcedWomen who gave birth in the past 12 months Now married:
77.4% (60)Unmarried:
22.6% (18)
Women who did not give birth in the past 12 months Now married:
11.0% (201)Unmarried:
89.0% (1,624)
Marital status - White alone, not Hispanic / Latino population 15 years and over
Males 56.3% Never married35.5% Now married0.3% Separated1.3% Widowed6.6% DivorcedFemales 50.7% Never married31.8% Now married0.6% Separated5.9% Widowed10.9% DivorcedWomen who gave birth in the past 12 months Now married:
70.5% (165)Unmarried:
29.5% (69)
Women who did not give birth in the past 12 months Now married:
21.0% (2,788)Unmarried:
79.0% (10,478)
Marital status - Hispanic or Latino population 15 years and over
Males 63.1% Never married27.7% Now married2.8% Separated0.5% Widowed5.9% DivorcedFemales 65.9% Never married26.0% Now married0.0% Separated3.7% Widowed4.4% DivorcedWomen who gave birth in the past 12 months Now married:
72.1% (33)Unmarried:
27.9% (13)
Women who did not give birth in the past 12 months Now married:
21.0% (376)Unmarried:
79.0% (1,411)
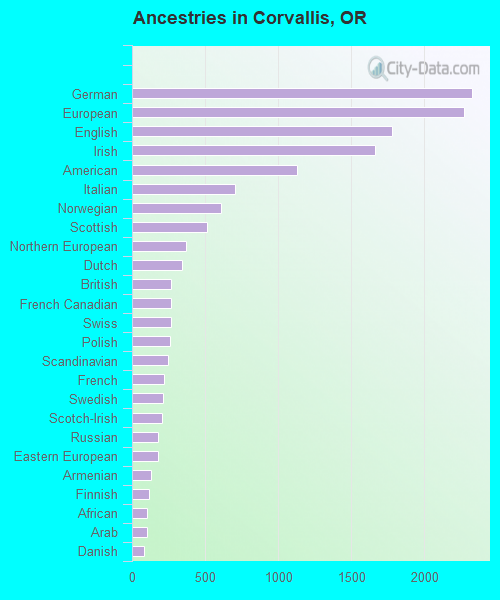
Ancestries in Corvallis
2,327 8.6% German2,275 8.4% European1,779 6.6% English1,661 6.2% Irish1,129 4.2% American702 2.6% Italian607 2.3% Norwegian515 1.9% Scottish369 1.4% Northern European343 1.3% Dutch269 1.0% British267 1.0% French Canadian265 1.0% Swiss262 1.0% Polish244 0.9% Scandinavian217 0.8% French212 0.8% Swedish202 0.7% Scotch-Irish180 0.7% Russian177 0.7% Eastern European132 0.5% Armenian116 0.4% Finnish106 0.4% African101 0.4% Arab85 0.3% Danish80 0.3% Jordanian71 0.3% Ukrainian69 0.3% Israeli61 0.2% Australian59 0.2% Belgian54 0.2% Lebanese54 0.2% Czech51 0.2% Portuguese50 0.2% Palestinian50 0.2% Turkish38 0.1% Austrian37 0.1% Iranian36 0.1% Welsh36 0.1% Slavic30 0.1% Greek30 0.1% Czechoslovakian28 0.1% Latvian27 0.1% Lithuanian23 0.09% Canadian22 0.08% Romanian22 0.08% Hungarian21 0.08% Egyptian19 0.07% Croatian11 0.04% Pennsylvania German9 0.03% Albanian5 0.02% Basque5 0.02% Slovak3 0.01% Brazilian
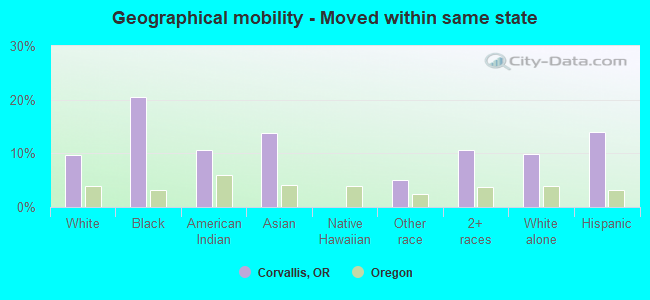
Geographical mobility in Corvallis Same house 1 year ago 32,626 68.6% White (Caucasian)454 42.9% Black or African American519 66.5% American Indian / Alaska Native3,737 68.7% Asian67 79.0% Native Hawaiian / Pacific Islander1,146 64.4% Other race3,199 61.2% Two or more races30,880 69.1% White alone, not Hispanic / Latino3,388 59.6% Hispanic or LatinoMoved within same county 5,107 10.7% White / Caucasian167 15.7% Black or African American19 2.5% American Indian / Alaska Native326 6.0% Asian147 8.3% Other race812 15.5% Two or more races4,928 11.0% White alone, not Hispanic / Latino499 8.8% Hispanic or LatinoMoved within same state 4,624 9.7% White / Caucasian217 20.5% Black or African American82 10.5% American Indian / Alaska Native755 13.9% Asian90 5.1% Other race555 10.6% Two or more races4,394 9.8% White alone, not Hispanic / Latino797 14.0% Hispanic or LatinoMoved from different state 3,794 8.0% White / Caucasian61 5.8% Black or African American27 3.4% American Indian / Alaska Native248 4.6% Asian9 10.0% Native Hawaiian / Pacific Islander213 12.0% Other race715 13.7% Two or more races3,377 7.6% White alone, not Hispanic / Latino1,061 18.7% Hispanic or LatinoMoved from abroad 462 1.0% White23 2.2% Black or African American40 5.1% American Indian / Alaska Native332 6.1% Asian106 5.9% Other race10 0.2% Two or more races452 1.0% White alone, not Hispanic / Latino425 7.5% Hispanic or Latino
Children Nativity (place of birth) in Corvallis
Children under 6 years - Living with two parents Both parents native 941 100.0% NativeBoth parents foreign-born 270 74.8% Native91 25.2% Foreign-bornOne native, one foreign-born parent 205 96.2% Native8 3.8% Foreign-bornChildren under 6 years - Living with one parent Native parent 470 100.0% NativeForeign-born parent 48 100.0% NativeChildren 6 to 17 years - Living with two parents Both parents native 2,463 100.0% Native1 0.0% Foreign-bornBoth parents foreign-born 245 37.2% Native415 62.8% Foreign-bornOne native, one foreign-born parent 442 100.0% NativeChildren 6 to 17 years - Living with one parent Native parent 1,657 100.0% NativeForeign-born parent 420 50.0% Native420 50.0% Foreign-born
Grandparents responsible for own grandchildren in Corvallis
Grandparents (30 to 59 years) White / Caucasian 57 100.0% Not responsible for grandchildrenAsian 3 100.0% Responsible for grandchildrenWhite alone, not Hispanic / Latino 65 100.0% Not responsible for grandchildrenGrandparents (60 years and over) White / Caucasian 26 39.8% Responsible for grandchildren39 60.2% Not responsible for grandchildrenAsian 38 100.0% Not responsible for grandchildrenWhite alone, not Hispanic / Latino 27 39.6% Responsible for grandchildren41 60.4% Not responsible for grandchildren