Races in Cottage Grove, Oregon (OR) Detailed Stats
Ancestries, Foreign-born residents, place of birth
Settings
X


Recent posts about races in Cottage Grove, Oregon on our local forum with over 2,400,000 registered users:
 | Main St Cottage Grove too close to race tracks? (6 replies) |
| Why Is Asian Food More Expensive Here? (22 replies) |
| Looking into Cottage Grove as possible retirement place (91 replies) |
| Has anyone bought land and built a house? (5 replies) |
| Crime and being seniors (92 replies) |
| Is the crime rate really bad in Cottage Grove? (3 replies) |
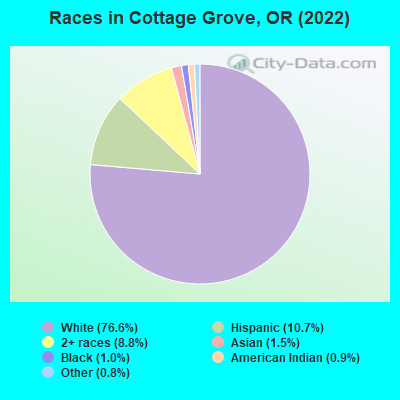
According to 2022 data, the most numerous races in Cottage Grove, OR are White alone (8,105 residents), Hispanic (1,137 residents), and Two or more races (935 residents). 92.3% of Cottage Grove residents speak English at home. 4.1% of Cottage Grove, OR residents are foreign-born (2.4% born in Latin America, 1.2% born in Asia), which is 120.6% less than the foreign-born rate of 9.0% across the entire state of Oregon.
Race distribution in Cottage Grove
2000
2022

- 7,63990.5%White alone
- 4174.9%Hispanic
- 1942.3%Two or more races
- 881.0%American Indian alone
- 770.9%Asian alone
- 130.2%Black alone
- 90.1%Other race alone
- 80.09%Native Hawaiian and Other
Pacific Islander alone

-
- 8,10576.6%White alone
- 1,13710.7%Hispanic
- 9358.8%Two or more races
- 1581.5%Asian alone
- 1051.0%Black alone
- 980.9%American Indian alone
- 880.8%Other race alone
- 50.05%Native Hawaiian and Other
Pacific Islander alone
2000
2022
-
- 2,857,61683.5%White alone
- 275,3148.0%Hispanic
- 100,3332.9%Asian alone
- 82,7332.4%Two or more races
- 53,3251.6%Black alone
- 40,1301.2%American Indian alone
- 7,3980.2%Native Hawaiian and Other
Pacific Islander alone - 4,5500.1%Other race alone

-
- 3,037,57171.6%White alone
- 609,53814.4%Hispanic
- 252,7446.0%Two or more races
- 191,2834.5%Asian alone
- 78,2281.8%Black alone
- 29,3990.7%American Indian alone
- 25,7310.6%Other race alone
- 15,6430.4%Native Hawaiian and Other
Pacific Islander alone

Income and house value in Cottage Grove
- Median household income in 2022
- $58,868White non-Hispanic householders
- $87,313Some other race householders
- $59,256Two or more races householders
- $53,537Hispanic or Latino race householders
- Median 2022 house value
- $343,438White Non-Hispanic householders
- $167,308Black or African American householders
- $365,949American Indian or Alaska Native householders
- $443,519Asian householders
- $342,221Native Hawaiian and other Pacific Islander householders
- $418,271Some other race householders
- $258,567Two or more races householders
- $466,638Hispanic or Latino householders
Household income for White non-Hispanic householders

Household income for Black householders

Household income for American Indian and Alaska Native householders

Household income for Asian householders

Household income for Some other race householders

Household income for Two or more races householders

Household income for Hispanic or Latino race householders

Median age by race in Cottage Grove
- 39.5Median age for White residents
- 35.1Males
- 43.8Females
- 35.0Median age for Black or African American residents
- 51.1Males
- 33.7Females
- 24.3Median age for American Indian / Alaska Native residents
- 18.8Males
- 37.2Females
- 47.5Median age for Asian residents
- 44.7Males
- 48.2Females
- -530,901,721.9Median age for Native Hawaiian / Pacific Islander residents
- -463,011,313.7Males
- -488,188,975.9Females
- 51.8Median age for Other race residents
- 55.5Males
- 45.1Females
- 22.8Median age for Two or more races residents
- 17.9Males
- 24.5Females
- 40.4Median age for White alone residents
- 36.2Males
- 44.6Females
- 35.2Median age for Hispanic or Latino residents
- 36.6Males
- 29.4Females
Owner/renter occupied households by race in Cottage Grove
- House owners and renters - White residents
- 2,23663.4%Owner occupied
- 1,28936.6%Renter occupied
- House owners and renters - Black or African American residents
- 61100.0%Owner occupied
- House owners and renters - American Indian / Alaska Native residents
- 10283.4%Owner occupied
- 2016.6%Renter occupied
- House owners and renters - Asian residents
- 62100.0%Owner occupied
- House owners and renters - Native Hawaiian / Pacific Islander residents
- 5100.0%Owner occupied
- House owners and renters - Other race residents
- 83.8%Owner occupied
- 20496.2%Renter occupied
- House owners and renters - Two or more races residents
- 10741.1%Owner occupied
- 15458.9%Renter occupied
- House owners and renters - White alone residents
- 2,18064.7%Owner occupied
- 1,18835.3%Renter occupied
- House owners and renters - Hispanic or Latino residents
- 10422.1%Owner occupied
- 36677.9%Renter occupied
Language usage in Cottage Grove
- English speakers - Total
- 92.3% of residents of Cottage Grove speak English at home.
- 4.2% of residents speak Spanish at home
- 25459.9%Speak English very well
- 17040.1%Speak English less than very well
- 3.2% of residents speak other language at home
- 26480.7%Speak English very well
- 6319.3%Speak English less than very well
- English speakers - Born in the United States
- 95.9% of residents of Cottage Grove speak English at home.
- 2.4% of residents speak Spanish at home
- 111100.0%Speak English very well
- 1.5% of residents speak other language at home
- 6694.3%Speak English very well
- 45.7%Speak English less than very well
- English speakers - Native, born elsewhere
- 85.1% of residents of Cottage Grove speak English at home.
- 14.9% of residents speak other language at home
- 15100.0%Speak English very well
- English speakers - Foreign-born
- 17.5% of residents of Cottage Grove speak English at home.
- 43.3% of residents speak Spanish at home
- 4825.3%Speak English very well
- 14274.7%Speak English less than very well
- 29.2% of residents speak other language at home
- 6752.3%Speak English very well
- 6147.7%Speak English less than very well
White (Caucasian) - Speak only English
| Native: | 98.0% (7,826) |
| Foreign-born: | 22.6% (55) |
White (Caucasian) - Speak another language
| Native: | 2.0% (161) |
| Foreign-born: | 74.2% (180) |
American Indian / Alaska Native - Speak another language
| Native: | 34.3% (67) |
| Foreign-born: | 100.0% (55) |
Asian - Speak another language
| Native: | 59.2% (36) |
| Foreign-born: | 97.7% (88) |
Other race - Speak another language
| Native: | 19.1% (57) |
| Foreign-born: | 100.0% (35) |
Two or more races - Speak only English
| Native: | 92.2% (917) |
| Foreign-born: | 76.8% (32) |
Two or more races - Speak another language
| Native: | 7.5% (75) |
| Foreign-born: | 33.0% (14) |
White alone - Speak only English
| Native: | 98.5% (7,630) |
| Foreign-born: | 99.9% (56) |
Hispanic or Latino - Speak another language
| Native: | 25.6% (205) |
| Foreign-born: | 100.0% (230) |
Foreign-born residents in Cottage Grove
432 residents are foreign born (2.4% Latin America, 1.2% Asia).
| This city: | 4.1% |
| Oregon: | 9.8% |


Marital status for residents in Cottage Grove
Marital status - White (Caucasian) population 15 years and over
- Males
- 41.0%Never married
- 44.8%Now married
- 1.3%Separated
- 2.7%Widowed
- 10.3%Divorced
- Females
- 28.6%Never married
- 42.7%Now married
- 1.5%Separated
- 11.7%Widowed
- 15.5%Divorced
Women who gave birth in the past 12 months
| Now married: | 95.9% (206) |
| Unmarried: | 4.1% (9) |
Women who did not give birth in the past 12 months
| Now married: | 38.3% (658) |
| Unmarried: | 61.7% (1,061) |
Marital status - Black or African American population 15 years and over
- Males
- 16.7%Never married
- 66.7%Now married
- 0.0%Separated
- 0.0%Widowed
- 16.7%Divorced
- Females
- 0.0%Never married
- 86.0%Now married
- 0.0%Separated
- 0.0%Widowed
- 14.0%Divorced
Women who did not give birth in the past 12 months
| Now married: | 100.0% (46) |
| Unmarried: | 0.0% (0) |
Marital status - American Indian / Alaska Native population 15 years and over
- Males
- 27.4%Never married
- 72.6%Now married
- 0.0%Separated
- 0.0%Widowed
- 0.0%Divorced
- Females
- 53.8%Never married
- 44.9%Now married
- 0.0%Separated
- 0.0%Widowed
- 1.3%Divorced
Women who did not give birth in the past 12 months
| Now married: | 44.9% (38) |
| Unmarried: | 55.1% (47) |
Marital status - Asian population 15 years and over
- Males
- 70.1%Never married
- 29.9%Now married
- 0.0%Separated
- 0.0%Widowed
- 0.0%Divorced
- Females
- 0.0%Never married
- 98.1%Now married
- 0.0%Separated
- 0.0%Widowed
- 1.9%Divorced
Women who did not give birth in the past 12 months
| Now married: | 96.7% (30) |
| Unmarried: | 3.3% (1) |
Marital status - Other race population 15 years and over
- Males
- 2.8%Never married
- 42.5%Now married
- 0.0%Separated
- 0.0%Widowed
- 54.7%Divorced
- Females
- 0.0%Never married
- 49.5%Now married
- 0.0%Separated
- 50.5%Widowed
- 0.0%Divorced
Women who did not give birth in the past 12 months
| Now married: | 16.7% (8) |
| Unmarried: | 83.3% (40) |
Marital status - Two or more races population 15 years and over
- Males
- 48.1%Never married
- 38.6%Now married
- 0.0%Separated
- 1.9%Widowed
- 11.4%Divorced
- Females
- 36.9%Never married
- 35.0%Now married
- 0.0%Separated
- 14.3%Widowed
- 13.8%Divorced
Women who gave birth in the past 12 months
| Now married: | 0.0% (0) |
| Unmarried: | 100.0% (19) |
Women who did not give birth in the past 12 months
| Now married: | 43.0% (65) |
| Unmarried: | 57.0% (86) |
Marital status - White alone, not Hispanic / Latino population 15 years and over
- Males
- 38.3%Never married
- 46.7%Now married
- 1.4%Separated
- 2.8%Widowed
- 10.9%Divorced
- Females
- 27.7%Never married
- 42.7%Now married
- 1.5%Separated
- 12.2%Widowed
- 15.9%Divorced
Women who gave birth in the past 12 months
| Now married: | 100.0% (207) |
| Unmarried: | 0.0% (0) |
Women who did not give birth in the past 12 months
| Now married: | 37.2% (591) |
| Unmarried: | 62.8% (999) |
Marital status - Hispanic or Latino population 15 years and over
- Males
- 41.6%Never married
- 30.0%Now married
- 0.0%Separated
- 0.0%Widowed
- 28.4%Divorced
- Females
- 29.3%Never married
- 47.3%Now married
- 0.0%Separated
- 18.9%Widowed
- 4.4%Divorced
Women who gave birth in the past 12 months
| Now married: | 0.0% (0) |
| Unmarried: | 100.0% (20) |
Women who did not give birth in the past 12 months
| Now married: | 44.5% (117) |
| Unmarried: | 55.5% (146) |
Ancestries in Cottage Grove

- 40211.2%German
- 3489.7%Irish
- 3339.3%English
- 2948.2%American
- 2085.8%Norwegian
- 1714.8%European
- 1133.1%French
- 862.4%Swedish
- 712.0%Italian
- 561.6%Scottish
- 471.3%Scandinavian
- 351.0%British
- 240.7%Scotch-Irish
- 190.5%Danish
- 130.4%French Canadian
- 130.4%Pennsylvania German
- 120.3%Lithuanian
- 110.3%Austrian
- 80.2%Lebanese
- 80.2%Czech
- 70.2%Portuguese
- 60.2%Finnish
- 40.1%Ethiopian
- 30.08%Estonian

Geographical mobility in Cottage Grove

- Same house 1 year ago
- 7,01083.3%White (Caucasian)
- 114100.0%Black or African American
- 249100.0%American Indian / Alaska Native
- 7749.1%Asian
- 6100.0%Native Hawaiian / Pacific Islander
- 459100.0%Other race
- 93578.8%Two or more races
- 6,71984.3%White alone, not Hispanic / Latino
- 94185.6%Hispanic or Latino

-
- Moved within same county
- 94011.2%White / Caucasian
- 10.8%Black or African American
- 2314.8%Asian
- 71.5%Other race
- 14912.6%Two or more races
- 89111.2%White alone, not Hispanic / Latino
- 656.0%Hispanic or Latino

-
- Moved within same state
- 690.8%White / Caucasian
- 726.1%Two or more races
- 400.5%White alone, not Hispanic / Latino
- 353.2%Hispanic or Latino

-
- Moved from different state
- 2933.5%White / Caucasian
- 3622.9%Asian
- 282.3%Two or more races
- 2973.7%White alone, not Hispanic / Latino

-
- Moved from abroad
- 720.9%White
- 90.1%White alone, not Hispanic / Latino
- 777.0%Hispanic or Latino

Children Nativity (place of birth) in Cottage Grove
Place of birth for residents in Cottage Grove
![Place of birth for the foreign-born population - Regions]()
- 267Americas
- 257Latin America
- 257Central America
- 124Asia
- 65South Eastern Asia
- 35Europe
- 33Eastern Asia
- 33China
- 25Western Asia
- 22Western Europe
- 10Northern Europe
- 9Northern America
- 5Africa
- 5Eastern Africa
- 3Eastern Europe

![Place of birth for the foreign-born population - Countries]()
- 218Mexico
- 40Philippines
- 33China
- 25Turkey
- 24Vietnam
- 22Germany
- 10United Kingdom
- 9Canada
- 5Ethiopia

Grandparents responsible for own grandchildren in Cottage Grove
Zip codes: 97424.