Races in Cutlerville, Michigan (MI) Detailed Stats
Data:
Races - White alone (%)
Races - White alone (% change since 2000)
Races - Black alone (%)
Races - Black alone (% change since 2000)
Races - American Indian alone (%)
Races - American Indian alone (% change since 2000)
Races - Asian alone (%)
Races - Asian alone (% change since 2000)
Races - Hispanic (%)
Races - Hispanic (% change since 2000)
Races - Native Hawaiian and Other Pacific Islander alone (%)
Races - Native Hawaiian and Other Pacific Islander alone (% change since 2000)
Races - Two or more races(%)
Races - Two or more races(% change since 2000)
Races - Other race alone (%)
Races - Other race alone (% change since 2000)
Racial diversity
Place of birth - Born in state of residence (%)
Place of birth - Born in state of residence (%) - White
Place of birth - Born in state of residence (%) - Black or African American
Place of birth - Born in state of residence (%) - Asian
Place of birth - Born in state of residence (%) - Hispanic or Latino
Place of birth - Born in state of residence (%) - American Indian and Alaska Native
Place of birth - Born in state of residence (%) - Multirace
Place of birth - Born in state of residence (%) - Other Race
Place of birth - Born in other state (%)
Place of birth - Born in other state (%) - White
Place of birth - Born in other state (%) - Black or African American
Place of birth - Born in other state (%) - Asian
Place of birth - Born in other state (%) - Hispanic or Latino
Place of birth - Born in other state (%) - American Indian and Alaska Native
Place of birth - Born in other state (%) - Multirace
Place of birth - Born in other state (%) - Other Race
Place of birth - Native, outside of US (%)
Place of birth - Native, outside of US (%) - White
Place of birth - Native, outside of US (%) - Black or African American
Place of birth - Native, outside of US (%) - Asian
Place of birth - Native, outside of US (%) - Hispanic or Latino
Place of birth - Native, outside of US (%) - American Indian and Alaska Native
Place of birth - Native, outside of US (%) - Multirace
Place of birth - Native, outside of US (%) - Other Race
Place of birth - Foreign born (%)
Place of birth - Foreign born (%) - White
Place of birth - Foreign born (%) - Black or African American
Place of birth - Foreign born (%) - Asian
Place of birth - Foreign born (%) - Hispanic or Latino
Place of birth - Foreign born (%) - American Indian and Alaska Native
Place of birth - Foreign born (%) - Multirace
Place of birth - Foreign born (%) - Other Race
Residents speaking English at home (%)
Residents speaking English at home - Born in the United States (%)
Residents speaking English at home - Native, born elsewhere (%)
Residents speaking English at home - Foreign born (%)
Residents speaking Spanish at home (%)
Residents speaking Spanish at home - Born in the United States (%)
Residents speaking Spanish at home - Native, born elsewhere (%)
Residents speaking Spanish at home - Foreign born (%)
Residents speaking other language at home (%)
Residents speaking other language at home - Born in the United States (%)
Residents speaking other language at home - Native, born elsewhere (%)
Residents speaking other language at home - Foreign born (%)
Marital status - Never married (%)
Marital status - Now married (%)
Marital status - Separated (%)
Marital status - Widowed (%)
Marital status - Divorced (%)
Ancestries Reported - Arab (%)
Ancestries Reported - Czech (%)
Ancestries Reported - Danish (%)
Ancestries Reported - Dutch (%)
Ancestries Reported - English (%)
Ancestries Reported - French (%)
Ancestries Reported - French Canadian (%)
Ancestries Reported - German (%)
Ancestries Reported - Greek (%)
Ancestries Reported - Hungarian (%)
Ancestries Reported - Irish (%)
Ancestries Reported - Italian (%)
Ancestries Reported - Lithuanian (%)
Ancestries Reported - Norwegian (%)
Ancestries Reported - Polish (%)
Ancestries Reported - Portuguese (%)
Ancestries Reported - Russian (%)
Ancestries Reported - Scotch-Irish (%)
Ancestries Reported - Scottish (%)
Ancestries Reported - Slovak (%)
Ancestries Reported - Subsaharan African (%)
Ancestries Reported - Swedish (%)
Ancestries Reported - Swiss (%)
Ancestries Reported - Ukrainian (%)
Ancestries Reported - United States (%)
Ancestries Reported - Welsh (%)
Ancestries Reported - West Indian (%)
Ancestries Reported - Other (%)
Geographical mobility - Same house 1 year ago (%)
Geographical mobility - Same house 1 year ago (%) - White
Geographical mobility - Same house 1 year ago (%) - Black or African American
Geographical mobility - Same house 1 year ago (%) - Asian
Geographical mobility - Same house 1 year ago (%) - Hispanic or Latino
Geographical mobility - Same house 1 year ago (%) - American Indian and Alaska Native
Geographical mobility - Same house 1 year ago (%) - Multirace
Geographical mobility - Same house 1 year ago (%) - Other Race
Geographical mobility - Moved within same county (%)
Geographical mobility - Moved within same county (%) - White
Geographical mobility - Moved within same county (%) - Black or African American
Geographical mobility - Moved within same county (%) - Asian
Geographical mobility - Moved within same county (%) - Hispanic or Latino
Geographical mobility - Moved within same county (%) - American Indian and Alaska Native
Geographical mobility - Moved within same county (%) - Multirace
Geographical mobility - Moved within same county (%) - Other Race
Geographical mobility - Moved from different county within same state (%)
Geographical mobility - Moved from different county within same state (%) - White
Geographical mobility - Moved from different county within same state (%) - Black or African American
Geographical mobility - Moved from different county within same state (%) - Asian
Geographical mobility - Moved from different county within same state (%) - Hispanic or Latino
Geographical mobility - Moved from different county within same state (%) - American Indian and Alaska Native
Geographical mobility - Moved from different county within same state (%) - Multirace
Geographical mobility - Moved from different county within same state (%) - Other Race
Geographical mobility - Moved from different state (%)
Geographical mobility - Moved from different state (%) - White
Geographical mobility - Moved from different state (%) - Black or African American
Geographical mobility - Moved from different state (%) - Asian
Geographical mobility - Moved from different state (%) - Hispanic or Latino
Geographical mobility - Moved from different state (%) - American Indian and Alaska Native
Geographical mobility - Moved from different state (%) - Multirace
Geographical mobility - Moved from different state (%) - Other Race
Geographical mobility - Moved from abroad (%)
Geographical mobility - Moved from abroad (%) - White
Geographical mobility - Moved from abroad (%) - Black or African American
Geographical mobility - Moved from abroad (%) - Asian
Geographical mobility - Moved from abroad (%) - Hispanic or Latino
Geographical mobility - Moved from abroad (%) - American Indian and Alaska Native
Geographical mobility - Moved from abroad (%) - Multirace
Geographical mobility - Moved from abroad (%) - Other Race
Place of birth for the foreign-born population - Ireland (%)
Place of birth for the foreign-born population - Denmark (%)
Place of birth for the foreign-born population - Norway (%)
Place of birth for the foreign-born population - Sweden (%)
Place of birth for the foreign-born population - United Kingdom (%)
Place of birth for the foreign-born population - England (%)
Place of birth for the foreign-born population - Scotland (%)
Place of birth for the foreign-born population - Other Northern Europe (%)
Place of birth for the foreign-born population - Austria (%)
Place of birth for the foreign-born population - Belgium (%)
Place of birth for the foreign-born population - France (%)
Place of birth for the foreign-born population - Germany (%)
Place of birth for the foreign-born population - Netherlands (%)
Place of birth for the foreign-born population - Switzerland (%)
Place of birth for the foreign-born population - Other Western Europe (%)
Place of birth for the foreign-born population - Greece (%)
Place of birth for the foreign-born population - Italy (%)
Place of birth for the foreign-born population - Portugal (%)
Place of birth for the foreign-born population - Spain (%)
Place of birth for the foreign-born population - Other Southern Europe (%)
Place of birth for the foreign-born population - Albania (%)
Place of birth for the foreign-born population - Belarus (%)
Place of birth for the foreign-born population - Bosnia and Herzegovina (%)
Place of birth for the foreign-born population - Bulgaria (%)
Place of birth for the foreign-born population - Croatia (%)
Place of birth for the foreign-born population - Czechoslovakia (%)
Place of birth for the foreign-born population - Hungary (%)
Place of birth for the foreign-born population - Latvia (%)
Place of birth for the foreign-born population - Lithuania (%)
Place of birth for the foreign-born population - North Macedonia (Macedonia) (%)
Place of birth for the foreign-born population - Moldova (%)
Place of birth for the foreign-born population - Poland (%)
Place of birth for the foreign-born population - Romania (%)
Place of birth for the foreign-born population - Russia (%)
Place of birth for the foreign-born population - Serbia (%)
Place of birth for the foreign-born population - Ukraine (%)
Place of birth for the foreign-born population - Other Eastern Europe (%)
Place of birth for the foreign-born population - China (%)
Place of birth for the foreign-born population - Hong Kong (%)
Place of birth for the foreign-born population - Taiwan (%)
Place of birth for the foreign-born population - Japan (%)
Place of birth for the foreign-born population - Korea (%)
Place of birth for the foreign-born population - Other Eastern Asia (%)
Place of birth for the foreign-born population - Afghanistan (%)
Place of birth for the foreign-born population - Bangladesh (%)
Place of birth for the foreign-born population - India (%)
Place of birth for the foreign-born population - Iran (%)
Place of birth for the foreign-born population - Kazakhstan (%)
Place of birth for the foreign-born population - Nepal (%)
Place of birth for the foreign-born population - Pakistan (%)
Place of birth for the foreign-born population - Sri Lanka (%)
Place of birth for the foreign-born population - Uzbekistan (%)
Place of birth for the foreign-born population - Other South Central Asia (%)
Place of birth for the foreign-born population - Burma (%)
Place of birth for the foreign-born population - Cambodia (%)
Place of birth for the foreign-born population - Indonesia (%)
Place of birth for the foreign-born population - Laos (%)
Place of birth for the foreign-born population - Malaysia (%)
Place of birth for the foreign-born population - Philippines (%)
Place of birth for the foreign-born population - Singapore (%)
Place of birth for the foreign-born population - Thailand (%)
Place of birth for the foreign-born population - Vietnam (%)
Place of birth for the foreign-born population - Other South Eastern Asia (%)
Place of birth for the foreign-born population - Armenia (%)
Place of birth for the foreign-born population - Iraq (%)
Place of birth for the foreign-born population - Israel (%)
Place of birth for the foreign-born population - Jordan (%)
Place of birth for the foreign-born population - Kuwait (%)
Place of birth for the foreign-born population - Lebanon (%)
Place of birth for the foreign-born population - Saudi Arabia (%)
Place of birth for the foreign-born population - Syria (%)
Place of birth for the foreign-born population - Turkey (%)
Place of birth for the foreign-born population - Yemen (%)
Place of birth for the foreign-born population - Other Western Asia (%)
Place of birth for the foreign-born population - Eritrea (%)
Place of birth for the foreign-born population - Ethiopia (%)
Place of birth for the foreign-born population - Kenya (%)
Place of birth for the foreign-born population - Somalia (%)
Place of birth for the foreign-born population - Uganda (%)
Place of birth for the foreign-born population - Zimbabwe (%)
Place of birth for the foreign-born population - Other Eastern Africa (%)
Place of birth for the foreign-born population - Cameroon (%)
Place of birth for the foreign-born population - Congo (%)
Place of birth for the foreign-born population - Democratic Republic of Congo (Zaire) (%)
Place of birth for the foreign-born population - Other Middle Africa (%)
Place of birth for the foreign-born population - Egypt (%)
Place of birth for the foreign-born population - Morocco (%)
Place of birth for the foreign-born population - Sudan (%)
Place of birth for the foreign-born population - Other Northern Africa (%)
Place of birth for the foreign-born population - South Africa (%)
Place of birth for the foreign-born population - Other Southern Africa (%)
Place of birth for the foreign-born population - Cabo Verde (%)
Place of birth for the foreign-born population - Ghana (%)
Place of birth for the foreign-born population - Liberia (%)
Place of birth for the foreign-born population - Nigeria (%)
Place of birth for the foreign-born population - Senegal (%)
Place of birth for the foreign-born population - Sierra Leone (%)
Place of birth for the foreign-born population - Other Western Africa (%)
Place of birth for the foreign-born population - Australia (%)
Place of birth for the foreign-born population - New Zealand (%)
Place of birth for the foreign-born population - Fiji (%)
Place of birth for the foreign-born population - Micronesia (%)
Place of birth for the foreign-born population - Bahamas (%)
Place of birth for the foreign-born population - Barbados (%)
Place of birth for the foreign-born population - Cuba (%)
Place of birth for the foreign-born population - Dominica (%)
Place of birth for the foreign-born population - Dominican Republic (%)
Place of birth for the foreign-born population - Grenada (%)
Place of birth for the foreign-born population - Haiti (%)
Place of birth for the foreign-born population - Jamaica (%)
Place of birth for the foreign-born population - St. Vincent and the Grenadines (%)
Place of birth for the foreign-born population - Trinidad and Tobago (%)
Place of birth for the foreign-born population - West Indies (%)
Place of birth for the foreign-born population - Other Caribbean (%)
Place of birth for the foreign-born population - Belize (%)
Place of birth for the foreign-born population - Costa Rica (%)
Place of birth for the foreign-born population - El Salvador (%)
Place of birth for the foreign-born population - Guatemala (%)
Place of birth for the foreign-born population - Honduras (%)
Place of birth for the foreign-born population - Mexico (%)
Place of birth for the foreign-born population - Nicaragua (%)
Place of birth for the foreign-born population - Panama (%)
Place of birth for the foreign-born population - Other Central America (%)
Place of birth for the foreign-born population - Argentina (%)
Place of birth for the foreign-born population - Bolivia (%)
Place of birth for the foreign-born population - Brazil (%)
Place of birth for the foreign-born population - Chile (%)
Place of birth for the foreign-born population - Colombia (%)
Place of birth for the foreign-born population - Ecuador (%)
Place of birth for the foreign-born population - Guyana (%)
Place of birth for the foreign-born population - Peru (%)
Place of birth for the foreign-born population - Uruguay (%)
Place of birth for the foreign-born population - Venezuela (%)
Place of birth for the foreign-born population - Other South America (%)
Place of birth for the foreign-born population - Canada (%)
Place of birth for the foreign-born population - Other Northern America (%)
Place of birth for the foreign-born population - Other (%)
Latest news about races in Cutlerville, MI collected exclusively by city-data.com from local newspapers, TV, and radio stations
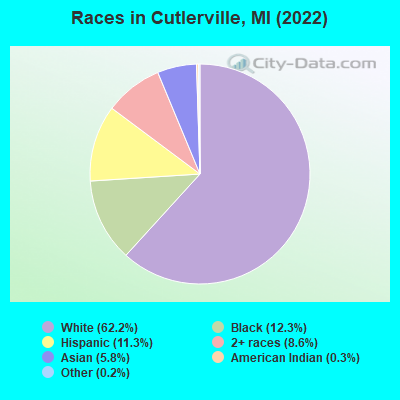
According to 2022 data, the most numerous races in Cutlerville, MI are White alone (12,018 residents), Black alone (2,375 residents), and Hispanic (2,193 residents). 83.6% of Cutlerville residents speak English at home. 8.1% of Cutlerville, MI residents are foreign-born (3.7% born in Asia, 1.9% born in Africa, 1.8% born in Latin America), which is 25.7% greater than the foreign-born rate of 6.0% across the entire state of Michigan.
Race distribution in Cutlerville
2000 2022
7,806,691 78.6% White alone 1,402,047 14.1% Black alone 323,877 3.3% Hispanic 175,311 1.8% Asian alone 163,487 1.6% Two or more races 53,421 0.5% American Indian alone 11,465 0.1% Other race alone 2,145 0.02% Native Hawaiian and Other
7,289,051 72.6% White alone 1,310,464 13.1% Black alone 572,405 5.7% Hispanic 450,031 4.5% Two or more races 335,732 3.3% Asian alone 45,217 0.5% Other race alone 29,011 0.3% American Indian alone 2,207 0.02% Native Hawaiian and Other
Income and house value in Cutlerville Median household income in 2022 $66,532 White non-Hispanic householders$50,098 Black householders$87,494 American Indian and Alaska Native householders$72,047 Asian householders$67,239 Some other race householders$74,458 Two or more races householders$57,427 Hispanic or Latino race householdersMedian 2022 house value $342,459 White Non-Hispanic householders$188,164 Black or African American householders $377,487 Asian householders$275,009 Some other race householders$253,877 Two or more races householders$213,928 Hispanic or Latino householders
Median age by race in Cutlerville
38.4 Median age for White residents38.3 38.3 26.0 Median age for Black or African American residents29.5 24.3 48.2 Median age for American Indian / Alaska Native residents25.3 47.1 28.2 Median age for Asian residents29.6 26.8 -670,531,400.3 Median age for Native Hawaiian / Pacific Islander residents-674,772,035.8 -699,588,476.7 12.6 Median age for Other race residents9.7 29.2 22.4 Median age for Two or more races residents21.7 19.9 39.5 Median age for White alone residents38.8 39.7 18.3 Median age for Hispanic or Latino residents21.1 17.9
Owner/renter occupied households by race in Cutlerville
House owners and renters - White residents 3,796 72.2% Owner occupied1,460 27.8% Renter occupiedHouse owners and renters - Black or African American residents 185 26.5% Owner occupied511 73.5% Renter occupiedHouse owners and renters - American Indian / Alaska Native residents 26 55.8% Owner occupied21 44.2% Renter occupiedHouse owners and renters - Asian residents 260 81.6% Owner occupied59 18.4% Renter occupiedHouse owners and renters - Other race residents 126 87.1% Owner occupied19 12.9% Renter occupiedHouse owners and renters - Two or more races residents 363 66.6% Owner occupied182 33.4% Renter occupiedHouse owners and renters - White alone residents 3,753 72.8% Owner occupied1,402 27.2% Renter occupiedHouse owners and renters - Hispanic or Latino residents 362 60.6% Owner occupied235 39.4% Renter occupied
Language usage in Cutlerville
English speakers - Total 83.6% of residents of Cutlerville speak English at home.
7.7% of residents speak Spanish at home 881 63.7% Speak English very well503 36.3% Speak English less than very well8.6% of residents speak other language at home 794 51.5% Speak English very well747 48.5% Speak English less than very well
English speakers - Born in the United States 87.5% of residents of Cutlerville speak English at home.
9.5% of residents speak Spanish at home 185 79.1% Speak English very well49 20.9% Speak English less than very well1.2% of residents speak other language at home 20 69.0% Speak English very well9 31.0% Speak English less than very well
English speakers - Native, born elsewhere 23.6% of residents of Cutlerville speak English at home.
47.5% of residents speak Spanish at home 84 57.9% Speak English very well61 42.1% Speak English less than very well4.3% of residents speak other language at home 13 100.0% Speak English very well
English speakers - Foreign-born 13.2% of residents of Cutlerville speak English at home.
19.9% of residents speak Spanish at home 118 37.1% Speak English very well200 62.9% Speak English less than very well67.3% of residents speak other language at home 398 37.0% Speak English very well677 63.0% Speak English less than very well
White (Caucasian) - Speak only English Native:
95.6% (11,371)Foreign-born:
43.2% (70)
White (Caucasian) - Speak another language Native:
4.2% (499)Foreign-born:
57.6% (93)
Black or African American - Speak another language Native:
13.4% (239)Foreign-born:
100.0% (303)
American Indian / Alaska Native - Speak another language Native:
95.1% (87)Foreign-born:
100.0% (7)
Asian - Speak only English Native:
59.3% (79)Foreign-born:
14.8% (109)
Asian - Speak another language Native:
40.7% (54)Foreign-born:
85.2% (628)
Other race - Speak only English Native:
5.5% (22)Foreign-born:
17.0% (19)
Other race - Speak another language Native:
79.8% (318)Foreign-born:
83.3% (92)
Two or more races - Speak only English Native:
85.7% (1,779)Foreign-born:
14.8% (35)
Two or more races - Speak another language Native:
12.3% (256)Foreign-born:
85.2% (202)
White alone - Speak only English Native:
96.7% (10,872)Foreign-born:
48.5% (66)
White alone - Speak another language Native:
3.5% (395)Foreign-born:
47.1% (64)
Hispanic or Latino - Speak only English Native:
52.8% (845)Foreign-born:
14.5% (53)
Hispanic or Latino - Speak another language Native:
46.4% (742)Foreign-born:
85.7% (310)
Foreign-born residents in Cutlerville 1,562 residents are foreign born (3.7% Asia , 1.9% Africa , 1.8% Latin America ).
This city:
8.1%Michigan:
6.9%
Marital status for residents in Cutlerville Marital status - White (Caucasian) population 15 years and over
Males 35.2% Never married49.5% Now married0.5% Separated0.9% Widowed13.9% DivorcedFemales 25.2% Never married45.8% Now married1.4% Separated7.6% Widowed20.0% DivorcedWomen who gave birth in the past 12 months Now married:
66.7% (46)Unmarried:
33.3% (23)
Women who did not give birth in the past 12 months Now married:
43.0% (1,201)Unmarried:
57.0% (1,595)
Marital status - Black or African American population 15 years and over
Males 46.7% Never married30.8% Now married3.1% Separated0.0% Widowed19.5% DivorcedFemales 47.8% Never married28.4% Now married4.3% Separated5.1% Widowed14.4% DivorcedWomen who gave birth in the past 12 months Now married:
56.7% (72)Unmarried:
43.3% (55)
Women who did not give birth in the past 12 months Now married:
23.5% (109)Unmarried:
76.5% (353)
Marital status - American Indian / Alaska Native population 15 years and over
Males 69.6% Never married30.4% Now married0.0% Separated0.0% Widowed0.0% DivorcedFemales 8.0% Never married60.0% Now married0.0% Separated20.0% Widowed12.0% DivorcedWomen who did not give birth in the past 12 months Now married:
67.7% (22)Unmarried:
32.3% (10)
Marital status - Asian population 15 years and over
Males 37.6% Never married62.4% Now married0.0% Separated0.0% Widowed0.0% DivorcedFemales 33.9% Never married51.9% Now married2.0% Separated7.4% Widowed4.8% DivorcedWomen who gave birth in the past 12 months Now married:
100.0% (6)Unmarried:
0.0% (0)
Women who did not give birth in the past 12 months Now married:
57.0% (166)Unmarried:
43.0% (125)
Marital status - Other race population 15 years and over
Males 57.5% Never married29.1% Now married0.0% Separated0.0% Widowed13.4% DivorcedFemales 63.7% Never married8.9% Now married0.0% Separated15.1% Widowed12.3% DivorcedWomen who did not give birth in the past 12 months Now married:
12.3% (13)Unmarried:
87.7% (91)
Marital status - Two or more races population 15 years and over
Males 62.0% Never married26.3% Now married5.6% Separated0.0% Widowed6.2% DivorcedFemales 39.3% Never married47.8% Now married8.0% Separated0.0% Widowed4.9% DivorcedWomen who did not give birth in the past 12 months Now married:
54.4% (260)Unmarried:
45.6% (218)
Marital status - White alone, not Hispanic / Latino population 15 years and over
Males 34.2% Never married50.0% Now married0.6% Separated0.9% Widowed14.3% DivorcedFemales 23.7% Never married45.8% Now married1.5% Separated7.9% Widowed21.0% DivorcedWomen who gave birth in the past 12 months Now married:
66.7% (47)Unmarried:
33.3% (23)
Women who did not give birth in the past 12 months Now married:
42.8% (1,110)Unmarried:
57.2% (1,482)
Marital status - Hispanic or Latino population 15 years and over
Males 56.9% Never married31.6% Now married0.0% Separated0.0% Widowed11.6% DivorcedFemales 45.8% Never married37.4% Now married6.8% Separated5.5% Widowed4.5% DivorcedWomen who did not give birth in the past 12 months Now married:
44.0% (183)Unmarried:
56.0% (234)
Ancestries in Cutlerville
1,569 16.3% Dutch886 9.2% English873 9.1% German736 7.7% American381 4.0% African270 2.8% Irish169 1.8% European164 1.7% Polish156 1.6% German Russian70 0.7% Italian59 0.6% French40 0.4% Hungarian32 0.3% Czech32 0.3% Greek31 0.3% Swedish31 0.3% Yugoslavian27 0.3% Liberian25 0.3% Scottish22 0.2% Norwegian19 0.2% French Canadian17 0.2% Latvian15 0.2% Lithuanian12 0.1% Canadian12 0.1% Croatian12 0.1% Finnish9 0.09% Celtic9 0.09% Danish8 0.08% Scotch-Irish7 0.07% British3 0.03% Portuguese
Geographical mobility in Cutlerville Same house 1 year ago 11,114 88.4% White (Caucasian)1,691 73.4% Black or African American41 40.4% American Indian / Alaska Native894 81.2% Asian598 93.8% Other race2,133 83.2% Two or more races10,526 88.0% White alone, not Hispanic / Latino1,925 87.9% Hispanic or LatinoMoved within same county 1,020 8.1% White / Caucasian505 21.9% Black or African American50 50.2% American Indian / Alaska Native165 15.0% Asian34 5.4% Other race266 10.4% Two or more races1,029 8.6% White alone, not Hispanic / Latino251 11.4% Hispanic or LatinoMoved within same state 283 2.2% White / Caucasian56 2.5% Black or African American207 8.1% Two or more races253 2.1% White alone, not Hispanic / Latino30 1.4% Hispanic or LatinoMoved from different state 149 1.2% White / Caucasian32 1.4% Black or African American157 1.3% White alone, not Hispanic / LatinoMoved from abroad 14 0.1% White30 2.7% Asian14 0.1% White alone, not Hispanic / Latino
Children Nativity (place of birth) in Cutlerville
Children under 6 years - Living with two parents Both parents native 661 97.8% Native15 2.2% Foreign-bornBoth parents foreign-born 269 100.0% NativeOne native, one foreign-born parent 21 100.0% NativeChildren under 6 years - Living with one parent Native parent 532 95.5% Native25 4.5% Foreign-bornForeign-born parent 20 100.0% NativeChildren 6 to 17 years - Living with two parents Both parents native 1,539 97.9% Native32 2.1% Foreign-bornBoth parents foreign-born 45 19.5% Native184 80.5% Foreign-bornOne native, one foreign-born parent 191 100.0% NativeChildren 6 to 17 years - Living with one parent Native parent 1,309 100.0% NativeForeign-born parent 17 51.4% Native16 48.6% Foreign-born
Grandparents responsible for own grandchildren in Cutlerville
Grandparents (30 to 59 years) White / Caucasian 40 24.6% Responsible for grandchildren124 75.4% Not responsible for grandchildrenAsian 22 100.0% Not responsible for grandchildrenWhite alone, not Hispanic / Latino 32 20.5% Responsible for grandchildren123 79.5% Not responsible for grandchildrenGrandparents (60 years and over) White / Caucasian 19 20.4% Responsible for grandchildren76 79.6% Not responsible for grandchildrenAsian 14 100.0% Not responsible for grandchildrenWhite alone, not Hispanic / Latino 19 18.9% Responsible for grandchildren83 81.1% Not responsible for grandchildren