Races in D'Iberville, Mississippi (MS) Detailed Stats
Data:
Races - White alone (%)
Races - White alone (% change since 2000)
Races - Black alone (%)
Races - Black alone (% change since 2000)
Races - American Indian alone (%)
Races - American Indian alone (% change since 2000)
Races - Asian alone (%)
Races - Asian alone (% change since 2000)
Races - Hispanic (%)
Races - Hispanic (% change since 2000)
Races - Native Hawaiian and Other Pacific Islander alone (%)
Races - Native Hawaiian and Other Pacific Islander alone (% change since 2000)
Races - Two or more races(%)
Races - Two or more races(% change since 2000)
Races - Other race alone (%)
Races - Other race alone (% change since 2000)
Racial diversity
Place of birth - Born in state of residence (%)
Place of birth - Born in state of residence (%) - White
Place of birth - Born in state of residence (%) - Black or African American
Place of birth - Born in state of residence (%) - Asian
Place of birth - Born in state of residence (%) - Hispanic or Latino
Place of birth - Born in state of residence (%) - American Indian and Alaska Native
Place of birth - Born in state of residence (%) - Multirace
Place of birth - Born in state of residence (%) - Other Race
Place of birth - Born in other state (%)
Place of birth - Born in other state (%) - White
Place of birth - Born in other state (%) - Black or African American
Place of birth - Born in other state (%) - Asian
Place of birth - Born in other state (%) - Hispanic or Latino
Place of birth - Born in other state (%) - American Indian and Alaska Native
Place of birth - Born in other state (%) - Multirace
Place of birth - Born in other state (%) - Other Race
Place of birth - Native, outside of US (%)
Place of birth - Native, outside of US (%) - White
Place of birth - Native, outside of US (%) - Black or African American
Place of birth - Native, outside of US (%) - Asian
Place of birth - Native, outside of US (%) - Hispanic or Latino
Place of birth - Native, outside of US (%) - American Indian and Alaska Native
Place of birth - Native, outside of US (%) - Multirace
Place of birth - Native, outside of US (%) - Other Race
Place of birth - Foreign born (%)
Place of birth - Foreign born (%) - White
Place of birth - Foreign born (%) - Black or African American
Place of birth - Foreign born (%) - Asian
Place of birth - Foreign born (%) - Hispanic or Latino
Place of birth - Foreign born (%) - American Indian and Alaska Native
Place of birth - Foreign born (%) - Multirace
Place of birth - Foreign born (%) - Other Race
Residents speaking English at home (%)
Residents speaking English at home - Born in the United States (%)
Residents speaking English at home - Native, born elsewhere (%)
Residents speaking English at home - Foreign born (%)
Residents speaking Spanish at home (%)
Residents speaking Spanish at home - Born in the United States (%)
Residents speaking Spanish at home - Native, born elsewhere (%)
Residents speaking Spanish at home - Foreign born (%)
Residents speaking other language at home (%)
Residents speaking other language at home - Born in the United States (%)
Residents speaking other language at home - Native, born elsewhere (%)
Residents speaking other language at home - Foreign born (%)
Marital status - Never married (%)
Marital status - Now married (%)
Marital status - Separated (%)
Marital status - Widowed (%)
Marital status - Divorced (%)
Ancestries Reported - Arab (%)
Ancestries Reported - Czech (%)
Ancestries Reported - Danish (%)
Ancestries Reported - Dutch (%)
Ancestries Reported - English (%)
Ancestries Reported - French (%)
Ancestries Reported - French Canadian (%)
Ancestries Reported - German (%)
Ancestries Reported - Greek (%)
Ancestries Reported - Hungarian (%)
Ancestries Reported - Irish (%)
Ancestries Reported - Italian (%)
Ancestries Reported - Lithuanian (%)
Ancestries Reported - Norwegian (%)
Ancestries Reported - Polish (%)
Ancestries Reported - Portuguese (%)
Ancestries Reported - Russian (%)
Ancestries Reported - Scotch-Irish (%)
Ancestries Reported - Scottish (%)
Ancestries Reported - Slovak (%)
Ancestries Reported - Subsaharan African (%)
Ancestries Reported - Swedish (%)
Ancestries Reported - Swiss (%)
Ancestries Reported - Ukrainian (%)
Ancestries Reported - United States (%)
Ancestries Reported - Welsh (%)
Ancestries Reported - West Indian (%)
Ancestries Reported - Other (%)
Geographical mobility - Same house 1 year ago (%)
Geographical mobility - Same house 1 year ago (%) - White
Geographical mobility - Same house 1 year ago (%) - Black or African American
Geographical mobility - Same house 1 year ago (%) - Asian
Geographical mobility - Same house 1 year ago (%) - Hispanic or Latino
Geographical mobility - Same house 1 year ago (%) - American Indian and Alaska Native
Geographical mobility - Same house 1 year ago (%) - Multirace
Geographical mobility - Same house 1 year ago (%) - Other Race
Geographical mobility - Moved within same county (%)
Geographical mobility - Moved within same county (%) - White
Geographical mobility - Moved within same county (%) - Black or African American
Geographical mobility - Moved within same county (%) - Asian
Geographical mobility - Moved within same county (%) - Hispanic or Latino
Geographical mobility - Moved within same county (%) - American Indian and Alaska Native
Geographical mobility - Moved within same county (%) - Multirace
Geographical mobility - Moved within same county (%) - Other Race
Geographical mobility - Moved from different county within same state (%)
Geographical mobility - Moved from different county within same state (%) - White
Geographical mobility - Moved from different county within same state (%) - Black or African American
Geographical mobility - Moved from different county within same state (%) - Asian
Geographical mobility - Moved from different county within same state (%) - Hispanic or Latino
Geographical mobility - Moved from different county within same state (%) - American Indian and Alaska Native
Geographical mobility - Moved from different county within same state (%) - Multirace
Geographical mobility - Moved from different county within same state (%) - Other Race
Geographical mobility - Moved from different state (%)
Geographical mobility - Moved from different state (%) - White
Geographical mobility - Moved from different state (%) - Black or African American
Geographical mobility - Moved from different state (%) - Asian
Geographical mobility - Moved from different state (%) - Hispanic or Latino
Geographical mobility - Moved from different state (%) - American Indian and Alaska Native
Geographical mobility - Moved from different state (%) - Multirace
Geographical mobility - Moved from different state (%) - Other Race
Geographical mobility - Moved from abroad (%)
Geographical mobility - Moved from abroad (%) - White
Geographical mobility - Moved from abroad (%) - Black or African American
Geographical mobility - Moved from abroad (%) - Asian
Geographical mobility - Moved from abroad (%) - Hispanic or Latino
Geographical mobility - Moved from abroad (%) - American Indian and Alaska Native
Geographical mobility - Moved from abroad (%) - Multirace
Geographical mobility - Moved from abroad (%) - Other Race
Place of birth for the foreign-born population - Ireland (%)
Place of birth for the foreign-born population - Denmark (%)
Place of birth for the foreign-born population - Norway (%)
Place of birth for the foreign-born population - Sweden (%)
Place of birth for the foreign-born population - United Kingdom (%)
Place of birth for the foreign-born population - England (%)
Place of birth for the foreign-born population - Scotland (%)
Place of birth for the foreign-born population - Other Northern Europe (%)
Place of birth for the foreign-born population - Austria (%)
Place of birth for the foreign-born population - Belgium (%)
Place of birth for the foreign-born population - France (%)
Place of birth for the foreign-born population - Germany (%)
Place of birth for the foreign-born population - Netherlands (%)
Place of birth for the foreign-born population - Switzerland (%)
Place of birth for the foreign-born population - Other Western Europe (%)
Place of birth for the foreign-born population - Greece (%)
Place of birth for the foreign-born population - Italy (%)
Place of birth for the foreign-born population - Portugal (%)
Place of birth for the foreign-born population - Spain (%)
Place of birth for the foreign-born population - Other Southern Europe (%)
Place of birth for the foreign-born population - Albania (%)
Place of birth for the foreign-born population - Belarus (%)
Place of birth for the foreign-born population - Bosnia and Herzegovina (%)
Place of birth for the foreign-born population - Bulgaria (%)
Place of birth for the foreign-born population - Croatia (%)
Place of birth for the foreign-born population - Czechoslovakia (%)
Place of birth for the foreign-born population - Hungary (%)
Place of birth for the foreign-born population - Latvia (%)
Place of birth for the foreign-born population - Lithuania (%)
Place of birth for the foreign-born population - North Macedonia (Macedonia) (%)
Place of birth for the foreign-born population - Moldova (%)
Place of birth for the foreign-born population - Poland (%)
Place of birth for the foreign-born population - Romania (%)
Place of birth for the foreign-born population - Russia (%)
Place of birth for the foreign-born population - Serbia (%)
Place of birth for the foreign-born population - Ukraine (%)
Place of birth for the foreign-born population - Other Eastern Europe (%)
Place of birth for the foreign-born population - China (%)
Place of birth for the foreign-born population - Hong Kong (%)
Place of birth for the foreign-born population - Taiwan (%)
Place of birth for the foreign-born population - Japan (%)
Place of birth for the foreign-born population - Korea (%)
Place of birth for the foreign-born population - Other Eastern Asia (%)
Place of birth for the foreign-born population - Afghanistan (%)
Place of birth for the foreign-born population - Bangladesh (%)
Place of birth for the foreign-born population - India (%)
Place of birth for the foreign-born population - Iran (%)
Place of birth for the foreign-born population - Kazakhstan (%)
Place of birth for the foreign-born population - Nepal (%)
Place of birth for the foreign-born population - Pakistan (%)
Place of birth for the foreign-born population - Sri Lanka (%)
Place of birth for the foreign-born population - Uzbekistan (%)
Place of birth for the foreign-born population - Other South Central Asia (%)
Place of birth for the foreign-born population - Burma (%)
Place of birth for the foreign-born population - Cambodia (%)
Place of birth for the foreign-born population - Indonesia (%)
Place of birth for the foreign-born population - Laos (%)
Place of birth for the foreign-born population - Malaysia (%)
Place of birth for the foreign-born population - Philippines (%)
Place of birth for the foreign-born population - Singapore (%)
Place of birth for the foreign-born population - Thailand (%)
Place of birth for the foreign-born population - Vietnam (%)
Place of birth for the foreign-born population - Other South Eastern Asia (%)
Place of birth for the foreign-born population - Armenia (%)
Place of birth for the foreign-born population - Iraq (%)
Place of birth for the foreign-born population - Israel (%)
Place of birth for the foreign-born population - Jordan (%)
Place of birth for the foreign-born population - Kuwait (%)
Place of birth for the foreign-born population - Lebanon (%)
Place of birth for the foreign-born population - Saudi Arabia (%)
Place of birth for the foreign-born population - Syria (%)
Place of birth for the foreign-born population - Turkey (%)
Place of birth for the foreign-born population - Yemen (%)
Place of birth for the foreign-born population - Other Western Asia (%)
Place of birth for the foreign-born population - Eritrea (%)
Place of birth for the foreign-born population - Ethiopia (%)
Place of birth for the foreign-born population - Kenya (%)
Place of birth for the foreign-born population - Somalia (%)
Place of birth for the foreign-born population - Uganda (%)
Place of birth for the foreign-born population - Zimbabwe (%)
Place of birth for the foreign-born population - Other Eastern Africa (%)
Place of birth for the foreign-born population - Cameroon (%)
Place of birth for the foreign-born population - Congo (%)
Place of birth for the foreign-born population - Democratic Republic of Congo (Zaire) (%)
Place of birth for the foreign-born population - Other Middle Africa (%)
Place of birth for the foreign-born population - Egypt (%)
Place of birth for the foreign-born population - Morocco (%)
Place of birth for the foreign-born population - Sudan (%)
Place of birth for the foreign-born population - Other Northern Africa (%)
Place of birth for the foreign-born population - South Africa (%)
Place of birth for the foreign-born population - Other Southern Africa (%)
Place of birth for the foreign-born population - Cabo Verde (%)
Place of birth for the foreign-born population - Ghana (%)
Place of birth for the foreign-born population - Liberia (%)
Place of birth for the foreign-born population - Nigeria (%)
Place of birth for the foreign-born population - Senegal (%)
Place of birth for the foreign-born population - Sierra Leone (%)
Place of birth for the foreign-born population - Other Western Africa (%)
Place of birth for the foreign-born population - Australia (%)
Place of birth for the foreign-born population - New Zealand (%)
Place of birth for the foreign-born population - Fiji (%)
Place of birth for the foreign-born population - Micronesia (%)
Place of birth for the foreign-born population - Bahamas (%)
Place of birth for the foreign-born population - Barbados (%)
Place of birth for the foreign-born population - Cuba (%)
Place of birth for the foreign-born population - Dominica (%)
Place of birth for the foreign-born population - Dominican Republic (%)
Place of birth for the foreign-born population - Grenada (%)
Place of birth for the foreign-born population - Haiti (%)
Place of birth for the foreign-born population - Jamaica (%)
Place of birth for the foreign-born population - St. Vincent and the Grenadines (%)
Place of birth for the foreign-born population - Trinidad and Tobago (%)
Place of birth for the foreign-born population - West Indies (%)
Place of birth for the foreign-born population - Other Caribbean (%)
Place of birth for the foreign-born population - Belize (%)
Place of birth for the foreign-born population - Costa Rica (%)
Place of birth for the foreign-born population - El Salvador (%)
Place of birth for the foreign-born population - Guatemala (%)
Place of birth for the foreign-born population - Honduras (%)
Place of birth for the foreign-born population - Mexico (%)
Place of birth for the foreign-born population - Nicaragua (%)
Place of birth for the foreign-born population - Panama (%)
Place of birth for the foreign-born population - Other Central America (%)
Place of birth for the foreign-born population - Argentina (%)
Place of birth for the foreign-born population - Bolivia (%)
Place of birth for the foreign-born population - Brazil (%)
Place of birth for the foreign-born population - Chile (%)
Place of birth for the foreign-born population - Colombia (%)
Place of birth for the foreign-born population - Ecuador (%)
Place of birth for the foreign-born population - Guyana (%)
Place of birth for the foreign-born population - Peru (%)
Place of birth for the foreign-born population - Uruguay (%)
Place of birth for the foreign-born population - Venezuela (%)
Place of birth for the foreign-born population - Other South America (%)
Place of birth for the foreign-born population - Canada (%)
Place of birth for the foreign-born population - Other Northern America (%)
Place of birth for the foreign-born population - Other (%)
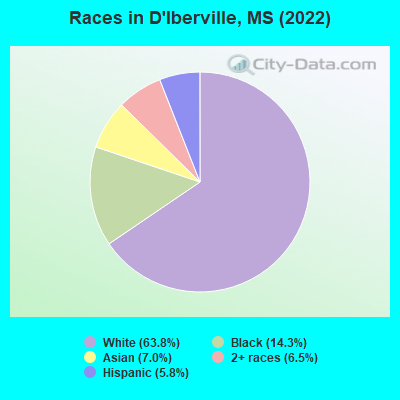
According to 2022 data, the most numerous races in D'Iberville, MS are White alone (8,335 residents), Black alone (1,864 residents), and Hispanic (758 residents). 88.5% of D'Iberville residents speak English at home. 8.2% of D'Iberville, MS residents are foreign-born (4.2% born in Asia, 3.2% born in Latin America), which is 75.6% greater than the foreign-born rate of 2.0% across the entire state of Mississippi.
Race distribution in D'Iberville
2000 2022
1,727,908 60.7% White alone 1,028,473 36.2% Black alone 39,569 1.4% Hispanic 17,272 0.6% Two or more races 18,349 0.6% Asian alone 11,224 0.4% American Indian alone 1,294 0.05% Other race alone 569 0.02% Native Hawaiian and Other
1,625,979 55.3% White alone 1,072,962 36.5% Black alone 97,177 3.3% Hispanic 96,367 3.3% Two or more races 25,217 0.9% Asian alone 12,457 0.4% American Indian alone 9,501 0.3% Other race alone 397 0.01% Native Hawaiian and Other
Income and house value in D'Iberville Median household income in 2022 $67,907 White non-Hispanic householders$39,402 Black householders$22,544 Asian householders$55,014 Two or more races householdersMedian 2022 house value $204,749 White Non-Hispanic householders$209,129 Black or African American householders$251,283 American Indian or Alaska Native householders $205,297 Asian householders$205,297 Two or more races householders$150,551 Hispanic or Latino householders
Median age by race in D'Iberville
45.4 Median age for White residents48.7 35.3 41.3 Median age for Black or African American residents25.7 40.5 -656,504,064.4 Median age for American Indian / Alaska Native residents-661,654,134.7 -624,521,072.2 33.0 Median age for Asian residents33.2 32.5 -666,666,666.0 Median age for Native Hawaiian / Pacific Islander residents-668,724,279.2 -670,599,802.7 -529,976,018.7 Median age for Other race residents-606,837,606.2 -416,326,530.2 11.7 Median age for Two or more races residents17.5 11.4 45.0 Median age for White alone residents48.2 35.1 20.2 Median age for Hispanic or Latino residents29.0 10.2
Owner/renter occupied households by race in D'Iberville
House owners and renters - White residents 2,079 57.3% Owner occupied1,552 42.7% Renter occupiedHouse owners and renters - Black or African American residents 436 59.9% Owner occupied291 40.1% Renter occupiedHouse owners and renters - American Indian / Alaska Native residents 10 100.0% Owner occupiedHouse owners and renters - Asian residents 311 74.1% Owner occupied109 25.9% Renter occupiedHouse owners and renters - Other race residents 7 100.0% Owner occupiedHouse owners and renters - Two or more races residents 218 60.9% Owner occupied140 39.1% Renter occupiedHouse owners and renters - White alone residents 2,048 56.3% Owner occupied1,589 43.7% Renter occupiedHouse owners and renters - Hispanic or Latino residents 114 100.0% Owner occupied
Language usage in D'Iberville
English speakers - Total 88.5% of residents of D'Iberville speak English at home.
3.1% of residents speak Spanish at home 220 57.4% Speak English very well163 42.6% Speak English less than very well9.7% of residents speak other language at home 941 79.6% Speak English very well241 20.4% Speak English less than very well
English speakers - Born in the United States 95.4% of residents of D'Iberville speak English at home.
0.6% of residents speak Spanish at home 30 100.0% Speak English very well1.7% of residents speak other language at home 83 100.0% Speak English very well
English speakers - Native, born elsewhere 99.3% of residents of D'Iberville speak English at home.
English speakers - Foreign-born 8.5% of residents of D'Iberville speak English at home.
38.7% of residents speak Spanish at home 152 51.4% Speak English very well144 48.6% Speak English less than very well48.3% of residents speak other language at home 266 72.1% Speak English very well103 27.9% Speak English less than very well
White (Caucasian) - Speak only English Native:
99.8% (7,987)Foreign-born:
30.1% (43)
White (Caucasian) - Speak another language Native:
0.4% (31)Foreign-born:
61.1% (87)
Black or African American - Speak only English Native:
98.9% (1,695)Foreign-born:
100.0% (5)
Asian - Speak another language Native:
86.6% (300)Foreign-born:
89.5% (368)
Two or more races - Speak only English Native:
93.2% (755)Foreign-born:
5.7% (11)
White alone - Speak only English Native:
100.0% (7,955)Foreign-born:
56.1% (47)
White alone - Speak another language Native:
0.1% (12)Foreign-born:
44.2% (37)
Hispanic or Latino - Speak another language Native:
12.5% (28)Foreign-born:
100.0% (263)
Foreign-born residents in D'Iberville 1,069 residents are foreign born (4.2% Asia , 3.2% Latin America ).
This city:
8.2%Mississippi:
2.3%
Marital status for residents in D'Iberville Marital status - White (Caucasian) population 15 years and over
Males 20.7% Never married58.1% Now married1.6% Separated8.1% Widowed11.5% DivorcedFemales 30.7% Never married46.8% Now married2.8% Separated6.7% Widowed13.0% DivorcedWomen who gave birth in the past 12 months Now married:
76.8% (42)Unmarried:
23.2% (13)
Women who did not give birth in the past 12 months Now married:
43.5% (915)Unmarried:
56.5% (1,190)
Marital status - Black or African American population 15 years and over
Males 45.7% Never married31.6% Now married0.0% Separated5.7% Widowed17.0% DivorcedFemales 51.6% Never married11.6% Now married1.0% Separated24.0% Widowed11.8% DivorcedWomen who did not give birth in the past 12 months Now married:
14.9% (73)Unmarried:
85.1% (418)
Marital status - American Indian / Alaska Native population 15 years and over
Males 100.0% Never married0.0% Now married0.0% Separated0.0% Widowed0.0% DivorcedFemales 0.0% Never married100.0% Now married0.0% Separated0.0% Widowed0.0% DivorcedMarital status - Asian population 15 years and over
Males 28.0% Never married72.0% Now married0.0% Separated0.0% Widowed0.0% DivorcedFemales 12.2% Never married65.0% Now married0.0% Separated5.7% Widowed17.0% DivorcedWomen who gave birth in the past 12 months Now married:
100.0% (58)Unmarried:
0.0% (0)
Women who did not give birth in the past 12 months Now married:
62.4% (179)Unmarried:
37.6% (108)
Marital status - Two or more races population 15 years and over
Males 49.2% Never married50.8% Now married0.0% Separated0.0% Widowed0.0% DivorcedFemales 8.3% Never married84.3% Now married0.0% Separated2.3% Widowed5.1% DivorcedWomen who did not give birth in the past 12 months Now married:
81.6% (265)Unmarried:
18.4% (60)
Marital status - White alone, not Hispanic / Latino population 15 years and over
Males 20.5% Never married57.6% Now married1.7% Separated8.4% Widowed11.9% DivorcedFemales 30.2% Never married46.6% Now married2.9% Separated6.9% Widowed13.4% DivorcedWomen who gave birth in the past 12 months Now married:
76.8% (42)Unmarried:
23.2% (13)
Women who did not give birth in the past 12 months Now married:
43.9% (900)Unmarried:
56.1% (1,150)
Marital status - Hispanic or Latino population 15 years and over
Males 37.1% Never married62.9% Now married0.0% Separated0.0% Widowed0.0% DivorcedFemales 32.8% Never married67.2% Now married0.0% Separated0.0% Widowed0.0% DivorcedWomen who did not give birth in the past 12 months Now married:
58.2% (98)Unmarried:
41.8% (70)
Ancestries in D'Iberville
1,158 15.5% American523 7.0% English406 5.4% German223 3.0% Slovak211 2.8% French205 2.7% Scottish145 1.9% Irish98 1.3% Italian72 1.0% Scandinavian59 0.8% Portuguese47 0.6% Croatian42 0.6% Scotch-Irish36 0.5% French Canadian5 0.07% British3 0.04% Danish
Geographical mobility in D'Iberville Same house 1 year ago 6,160 73.1% White (Caucasian)1,885 99.9% Black or African American42 99.4% American Indian / Alaska Native594 57.7% Asian21 100.0% Other race1,285 83.5% Two or more races6,032 72.5% White alone, not Hispanic / Latino678 94.7% Hispanic or LatinoMoved within same county 987 11.7% White / Caucasian56 3.0% Black or African American20 1.9% Asian219 14.3% Two or more races1,032 12.4% White alone, not Hispanic / LatinoMoved within same state 440 5.2% White / Caucasian10 0.5% Black or African American289 28.1% Asian448 5.4% White alone, not Hispanic / LatinoMoved from different state 549 6.5% White / Caucasian13 0.9% Two or more races537 6.5% White alone, not Hispanic / Latino27 3.7% Hispanic or LatinoMoved from abroad 40 0.5% White217 21.1% Asian33 0.4% White alone, not Hispanic / Latino17 2.4% Hispanic or Latino
Children Nativity (place of birth) in D'Iberville
Children under 6 years - Living with two parents Both parents native 743 100.0% NativeBoth parents foreign-born 87 44.9% Native107 55.1% Foreign-bornChildren under 6 years - Living with one parent Native parent 211 100.0% NativeChildren 6 to 17 years - Living with two parents Both parents native 901 100.0% NativeBoth parents foreign-born 128 100.0% Foreign-bornOne native, one foreign-born parent 104 77.9% Native30 22.1% Foreign-bornChildren 6 to 17 years - Living with one parent Native parent 606 100.0% Native
Grandparents responsible for own grandchildren in D'Iberville
Grandparents (30 to 59 years) White / Caucasian 74 76.0% Responsible for grandchildren23 24.0% Not responsible for grandchildrenBlack or African American 19 19.7% Responsible for grandchildren77 80.3% Not responsible for grandchildrenWhite alone, not Hispanic / Latino 75 76.0% Responsible for grandchildren24 24.0% Not responsible for grandchildren
Grandparents (60 years and over) White / Caucasian 4 3.7% Responsible for grandchildren99 96.3% Not responsible for grandchildrenBlack or African American 14 100.0% Responsible for grandchildrenWhite alone, not Hispanic / Latino 4 3.7% Responsible for grandchildren100 96.3% Not responsible for grandchildren