Races in Danbury, Connecticut (CT) Detailed Stats
Data:
Races - White alone (%)
Races - White alone (% change since 2000)
Races - Black alone (%)
Races - Black alone (% change since 2000)
Races - American Indian alone (%)
Races - American Indian alone (% change since 2000)
Races - Asian alone (%)
Races - Asian alone (% change since 2000)
Races - Hispanic (%)
Races - Hispanic (% change since 2000)
Races - Native Hawaiian and Other Pacific Islander alone (%)
Races - Native Hawaiian and Other Pacific Islander alone (% change since 2000)
Races - Two or more races(%)
Races - Two or more races(% change since 2000)
Races - Other race alone (%)
Races - Other race alone (% change since 2000)
Racial diversity
Place of birth - Born in state of residence (%)
Place of birth - Born in state of residence (%) - White
Place of birth - Born in state of residence (%) - Black or African American
Place of birth - Born in state of residence (%) - Asian
Place of birth - Born in state of residence (%) - Hispanic or Latino
Place of birth - Born in state of residence (%) - American Indian and Alaska Native
Place of birth - Born in state of residence (%) - Multirace
Place of birth - Born in state of residence (%) - Other Race
Place of birth - Born in other state (%)
Place of birth - Born in other state (%) - White
Place of birth - Born in other state (%) - Black or African American
Place of birth - Born in other state (%) - Asian
Place of birth - Born in other state (%) - Hispanic or Latino
Place of birth - Born in other state (%) - American Indian and Alaska Native
Place of birth - Born in other state (%) - Multirace
Place of birth - Born in other state (%) - Other Race
Place of birth - Native, outside of US (%)
Place of birth - Native, outside of US (%) - White
Place of birth - Native, outside of US (%) - Black or African American
Place of birth - Native, outside of US (%) - Asian
Place of birth - Native, outside of US (%) - Hispanic or Latino
Place of birth - Native, outside of US (%) - American Indian and Alaska Native
Place of birth - Native, outside of US (%) - Multirace
Place of birth - Native, outside of US (%) - Other Race
Place of birth - Foreign born (%)
Place of birth - Foreign born (%) - White
Place of birth - Foreign born (%) - Black or African American
Place of birth - Foreign born (%) - Asian
Place of birth - Foreign born (%) - Hispanic or Latino
Place of birth - Foreign born (%) - American Indian and Alaska Native
Place of birth - Foreign born (%) - Multirace
Place of birth - Foreign born (%) - Other Race
Residents speaking English at home (%)
Residents speaking English at home - Born in the United States (%)
Residents speaking English at home - Native, born elsewhere (%)
Residents speaking English at home - Foreign born (%)
Residents speaking Spanish at home (%)
Residents speaking Spanish at home - Born in the United States (%)
Residents speaking Spanish at home - Native, born elsewhere (%)
Residents speaking Spanish at home - Foreign born (%)
Residents speaking other language at home (%)
Residents speaking other language at home - Born in the United States (%)
Residents speaking other language at home - Native, born elsewhere (%)
Residents speaking other language at home - Foreign born (%)
Marital status - Never married (%)
Marital status - Now married (%)
Marital status - Separated (%)
Marital status - Widowed (%)
Marital status - Divorced (%)
Ancestries Reported - Arab (%)
Ancestries Reported - Czech (%)
Ancestries Reported - Danish (%)
Ancestries Reported - Dutch (%)
Ancestries Reported - English (%)
Ancestries Reported - French (%)
Ancestries Reported - French Canadian (%)
Ancestries Reported - German (%)
Ancestries Reported - Greek (%)
Ancestries Reported - Hungarian (%)
Ancestries Reported - Irish (%)
Ancestries Reported - Italian (%)
Ancestries Reported - Lithuanian (%)
Ancestries Reported - Norwegian (%)
Ancestries Reported - Polish (%)
Ancestries Reported - Portuguese (%)
Ancestries Reported - Russian (%)
Ancestries Reported - Scotch-Irish (%)
Ancestries Reported - Scottish (%)
Ancestries Reported - Slovak (%)
Ancestries Reported - Subsaharan African (%)
Ancestries Reported - Swedish (%)
Ancestries Reported - Swiss (%)
Ancestries Reported - Ukrainian (%)
Ancestries Reported - United States (%)
Ancestries Reported - Welsh (%)
Ancestries Reported - West Indian (%)
Ancestries Reported - Other (%)
Geographical mobility - Same house 1 year ago (%)
Geographical mobility - Same house 1 year ago (%) - White
Geographical mobility - Same house 1 year ago (%) - Black or African American
Geographical mobility - Same house 1 year ago (%) - Asian
Geographical mobility - Same house 1 year ago (%) - Hispanic or Latino
Geographical mobility - Same house 1 year ago (%) - American Indian and Alaska Native
Geographical mobility - Same house 1 year ago (%) - Multirace
Geographical mobility - Same house 1 year ago (%) - Other Race
Geographical mobility - Moved within same county (%)
Geographical mobility - Moved within same county (%) - White
Geographical mobility - Moved within same county (%) - Black or African American
Geographical mobility - Moved within same county (%) - Asian
Geographical mobility - Moved within same county (%) - Hispanic or Latino
Geographical mobility - Moved within same county (%) - American Indian and Alaska Native
Geographical mobility - Moved within same county (%) - Multirace
Geographical mobility - Moved within same county (%) - Other Race
Geographical mobility - Moved from different county within same state (%)
Geographical mobility - Moved from different county within same state (%) - White
Geographical mobility - Moved from different county within same state (%) - Black or African American
Geographical mobility - Moved from different county within same state (%) - Asian
Geographical mobility - Moved from different county within same state (%) - Hispanic or Latino
Geographical mobility - Moved from different county within same state (%) - American Indian and Alaska Native
Geographical mobility - Moved from different county within same state (%) - Multirace
Geographical mobility - Moved from different county within same state (%) - Other Race
Geographical mobility - Moved from different state (%)
Geographical mobility - Moved from different state (%) - White
Geographical mobility - Moved from different state (%) - Black or African American
Geographical mobility - Moved from different state (%) - Asian
Geographical mobility - Moved from different state (%) - Hispanic or Latino
Geographical mobility - Moved from different state (%) - American Indian and Alaska Native
Geographical mobility - Moved from different state (%) - Multirace
Geographical mobility - Moved from different state (%) - Other Race
Geographical mobility - Moved from abroad (%)
Geographical mobility - Moved from abroad (%) - White
Geographical mobility - Moved from abroad (%) - Black or African American
Geographical mobility - Moved from abroad (%) - Asian
Geographical mobility - Moved from abroad (%) - Hispanic or Latino
Geographical mobility - Moved from abroad (%) - American Indian and Alaska Native
Geographical mobility - Moved from abroad (%) - Multirace
Geographical mobility - Moved from abroad (%) - Other Race
Place of birth for the foreign-born population - Ireland (%)
Place of birth for the foreign-born population - Denmark (%)
Place of birth for the foreign-born population - Norway (%)
Place of birth for the foreign-born population - Sweden (%)
Place of birth for the foreign-born population - United Kingdom (%)
Place of birth for the foreign-born population - England (%)
Place of birth for the foreign-born population - Scotland (%)
Place of birth for the foreign-born population - Other Northern Europe (%)
Place of birth for the foreign-born population - Austria (%)
Place of birth for the foreign-born population - Belgium (%)
Place of birth for the foreign-born population - France (%)
Place of birth for the foreign-born population - Germany (%)
Place of birth for the foreign-born population - Netherlands (%)
Place of birth for the foreign-born population - Switzerland (%)
Place of birth for the foreign-born population - Other Western Europe (%)
Place of birth for the foreign-born population - Greece (%)
Place of birth for the foreign-born population - Italy (%)
Place of birth for the foreign-born population - Portugal (%)
Place of birth for the foreign-born population - Spain (%)
Place of birth for the foreign-born population - Other Southern Europe (%)
Place of birth for the foreign-born population - Albania (%)
Place of birth for the foreign-born population - Belarus (%)
Place of birth for the foreign-born population - Bosnia and Herzegovina (%)
Place of birth for the foreign-born population - Bulgaria (%)
Place of birth for the foreign-born population - Croatia (%)
Place of birth for the foreign-born population - Czechoslovakia (%)
Place of birth for the foreign-born population - Hungary (%)
Place of birth for the foreign-born population - Latvia (%)
Place of birth for the foreign-born population - Lithuania (%)
Place of birth for the foreign-born population - North Macedonia (Macedonia) (%)
Place of birth for the foreign-born population - Moldova (%)
Place of birth for the foreign-born population - Poland (%)
Place of birth for the foreign-born population - Romania (%)
Place of birth for the foreign-born population - Russia (%)
Place of birth for the foreign-born population - Serbia (%)
Place of birth for the foreign-born population - Ukraine (%)
Place of birth for the foreign-born population - Other Eastern Europe (%)
Place of birth for the foreign-born population - China (%)
Place of birth for the foreign-born population - Hong Kong (%)
Place of birth for the foreign-born population - Taiwan (%)
Place of birth for the foreign-born population - Japan (%)
Place of birth for the foreign-born population - Korea (%)
Place of birth for the foreign-born population - Other Eastern Asia (%)
Place of birth for the foreign-born population - Afghanistan (%)
Place of birth for the foreign-born population - Bangladesh (%)
Place of birth for the foreign-born population - India (%)
Place of birth for the foreign-born population - Iran (%)
Place of birth for the foreign-born population - Kazakhstan (%)
Place of birth for the foreign-born population - Nepal (%)
Place of birth for the foreign-born population - Pakistan (%)
Place of birth for the foreign-born population - Sri Lanka (%)
Place of birth for the foreign-born population - Uzbekistan (%)
Place of birth for the foreign-born population - Other South Central Asia (%)
Place of birth for the foreign-born population - Burma (%)
Place of birth for the foreign-born population - Cambodia (%)
Place of birth for the foreign-born population - Indonesia (%)
Place of birth for the foreign-born population - Laos (%)
Place of birth for the foreign-born population - Malaysia (%)
Place of birth for the foreign-born population - Philippines (%)
Place of birth for the foreign-born population - Singapore (%)
Place of birth for the foreign-born population - Thailand (%)
Place of birth for the foreign-born population - Vietnam (%)
Place of birth for the foreign-born population - Other South Eastern Asia (%)
Place of birth for the foreign-born population - Armenia (%)
Place of birth for the foreign-born population - Iraq (%)
Place of birth for the foreign-born population - Israel (%)
Place of birth for the foreign-born population - Jordan (%)
Place of birth for the foreign-born population - Kuwait (%)
Place of birth for the foreign-born population - Lebanon (%)
Place of birth for the foreign-born population - Saudi Arabia (%)
Place of birth for the foreign-born population - Syria (%)
Place of birth for the foreign-born population - Turkey (%)
Place of birth for the foreign-born population - Yemen (%)
Place of birth for the foreign-born population - Other Western Asia (%)
Place of birth for the foreign-born population - Eritrea (%)
Place of birth for the foreign-born population - Ethiopia (%)
Place of birth for the foreign-born population - Kenya (%)
Place of birth for the foreign-born population - Somalia (%)
Place of birth for the foreign-born population - Uganda (%)
Place of birth for the foreign-born population - Zimbabwe (%)
Place of birth for the foreign-born population - Other Eastern Africa (%)
Place of birth for the foreign-born population - Cameroon (%)
Place of birth for the foreign-born population - Congo (%)
Place of birth for the foreign-born population - Democratic Republic of Congo (Zaire) (%)
Place of birth for the foreign-born population - Other Middle Africa (%)
Place of birth for the foreign-born population - Egypt (%)
Place of birth for the foreign-born population - Morocco (%)
Place of birth for the foreign-born population - Sudan (%)
Place of birth for the foreign-born population - Other Northern Africa (%)
Place of birth for the foreign-born population - South Africa (%)
Place of birth for the foreign-born population - Other Southern Africa (%)
Place of birth for the foreign-born population - Cabo Verde (%)
Place of birth for the foreign-born population - Ghana (%)
Place of birth for the foreign-born population - Liberia (%)
Place of birth for the foreign-born population - Nigeria (%)
Place of birth for the foreign-born population - Senegal (%)
Place of birth for the foreign-born population - Sierra Leone (%)
Place of birth for the foreign-born population - Other Western Africa (%)
Place of birth for the foreign-born population - Australia (%)
Place of birth for the foreign-born population - New Zealand (%)
Place of birth for the foreign-born population - Fiji (%)
Place of birth for the foreign-born population - Micronesia (%)
Place of birth for the foreign-born population - Bahamas (%)
Place of birth for the foreign-born population - Barbados (%)
Place of birth for the foreign-born population - Cuba (%)
Place of birth for the foreign-born population - Dominica (%)
Place of birth for the foreign-born population - Dominican Republic (%)
Place of birth for the foreign-born population - Grenada (%)
Place of birth for the foreign-born population - Haiti (%)
Place of birth for the foreign-born population - Jamaica (%)
Place of birth for the foreign-born population - St. Vincent and the Grenadines (%)
Place of birth for the foreign-born population - Trinidad and Tobago (%)
Place of birth for the foreign-born population - West Indies (%)
Place of birth for the foreign-born population - Other Caribbean (%)
Place of birth for the foreign-born population - Belize (%)
Place of birth for the foreign-born population - Costa Rica (%)
Place of birth for the foreign-born population - El Salvador (%)
Place of birth for the foreign-born population - Guatemala (%)
Place of birth for the foreign-born population - Honduras (%)
Place of birth for the foreign-born population - Mexico (%)
Place of birth for the foreign-born population - Nicaragua (%)
Place of birth for the foreign-born population - Panama (%)
Place of birth for the foreign-born population - Other Central America (%)
Place of birth for the foreign-born population - Argentina (%)
Place of birth for the foreign-born population - Bolivia (%)
Place of birth for the foreign-born population - Brazil (%)
Place of birth for the foreign-born population - Chile (%)
Place of birth for the foreign-born population - Colombia (%)
Place of birth for the foreign-born population - Ecuador (%)
Place of birth for the foreign-born population - Guyana (%)
Place of birth for the foreign-born population - Peru (%)
Place of birth for the foreign-born population - Uruguay (%)
Place of birth for the foreign-born population - Venezuela (%)
Place of birth for the foreign-born population - Other South America (%)
Place of birth for the foreign-born population - Canada (%)
Place of birth for the foreign-born population - Other Northern America (%)
Place of birth for the foreign-born population - Other (%)
Latest news about races in Danbury, CT collected exclusively by city-data.com from local newspapers, TV, and radio stations
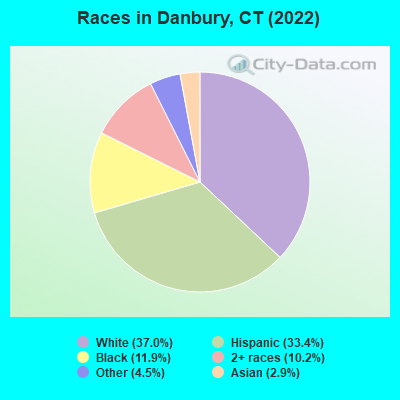
According to 2022 data, the most numerous races in Danbury, CT are White alone (32,221 residents), Hispanic (29,080 residents), and Black alone (10,357 residents). 54.3% of Danbury residents speak English at home. 34.1% of Danbury, CT residents are foreign-born (24.7% born in Latin America, 3.6% born in Asia), which is 56.0% greater than the foreign-born rate of 15.0% across the entire state of Connecticut.
Race distribution in Danbury
2000 2022
50,945 68.1% White alone 11,791 15.8% Hispanic 4,743 6.3% Black alone 4,068 5.4% Asian alone 2,061 2.8% Two or more races 1,096 1.5% Other race alone 131 0.2% American Indian alone 13 0.02% Native Hawaiian and Other
32,221 37.0% White alone 29,080 33.4% Hispanic 10,357 11.9% Black alone 8,890 10.2% Two or more races 3,895 4.5% Other race alone 2,516 2.9% Asian alone 12 0.01% American Indian alone
2000 2022
2,638,845 77.5% White alone 320,323 9.4% Hispanic 295,571 8.7% Black alone 81,564 2.4% Asian alone 52,896 1.6% Two or more races 8,141 0.2% Other race alone 7,267 0.2% American Indian alone 958 0.03% Native Hawaiian and Other
2,246,913 62.0% White alone 658,978 18.2% Hispanic 353,973 9.8% Black alone 172,929 4.8% Asian alone 159,631 4.4% Two or more races 29,761 0.8% Other race alone 3,428 0.09% American Indian alone 592 0.02% Native Hawaiian and Other
Income and house value in Danbury Median household income in 2022 $89,323 White non-Hispanic householders$126,406 Black householders$79,784 Asian householders$58,993 Some other race householders$95,428 Two or more races householders$72,417 Hispanic or Latino race householdersMedian 2022 house value $451,022 White Non-Hispanic householders$409,455 Black or African American householders$427,133 American Indian or Alaska Native householders $401,333 Asian householders$354,750 Some other race householders$420,444 Two or more races householders$440,988 Hispanic or Latino householders
Median age by race in Danbury
50.8 Median age for White residents48.7 52.2 32.3 Median age for Black or African American residents25.8 43.3 -666,666,666.0 Median age for American Indian / Alaska Native residents-666,666,666.0 -666,666,666.0 32.1 Median age for Asian residents32.9 27.8 -666,666,666.0 Median age for Native Hawaiian / Pacific Islander residents-666,666,666.0 -666,666,666.0 29.3 Median age for Other race residents29.3 32.3 25.3 Median age for Two or more races residents23.1 26.4 53.5 Median age for White alone residents50.9 55.3 27.8 Median age for Hispanic or Latino residents29.8 27.3
Owner/renter occupied households by race in Danbury
House owners and renters - White residents 10,474 65.8% Owner occupied5,436 34.2% Renter occupiedHouse owners and renters - Black or African American residents 1,719 56.5% Owner occupied1,326 43.5% Renter occupiedHouse owners and renters - American Indian / Alaska Native residents 11 9.8% Owner occupied103 90.2% Renter occupiedHouse owners and renters - Asian residents 562 50.5% Owner occupied550 49.5% Renter occupiedHouse owners and renters - Native Hawaiian / Pacific Islander residents 20 100.0% Owner occupiedHouse owners and renters - Other race residents 2,149 43.3% Owner occupied2,809 56.7% Renter occupiedHouse owners and renters - Two or more races residents 2,821 54.1% Owner occupied2,392 45.9% Renter occupiedHouse owners and renters - White alone residents 10,098 69.9% Owner occupied4,349 30.1% Renter occupiedHouse owners and renters - Hispanic or Latino residents 3,817 43.9% Owner occupied4,877 56.1% Renter occupied
Language usage in Danbury
English speakers - Total 54.3% of residents of Danbury speak English at home.
26.9% of residents speak Spanish at home 10,627 47.8% Speak English very well11,584 52.2% Speak English less than very well18.7% of residents speak other language at home 8,292 53.6% Speak English very well7,173 46.4% Speak English less than very well
English speakers - Born in the United States 83.9% of residents of Danbury speak English at home.
10.7% of residents speak Spanish at home 1,618 71.7% Speak English very well638 28.3% Speak English less than very well5.4% of residents speak other language at home 1,144 100.0% Speak English very well
English speakers - Native, born elsewhere 41.7% of residents of Danbury speak English at home.
39.2% of residents speak Spanish at home 363 38.6% Speak English very well578 61.4% Speak English less than very well19.0% of residents speak other language at home 392 85.8% Speak English very well65 14.2% Speak English less than very well
English speakers - Foreign-born 14.6% of residents of Danbury speak English at home.
47.1% of residents speak Spanish at home 3,356 25.4% Speak English very well9,836 74.6% Speak English less than very well38.4% of residents speak other language at home 4,093 38.0% Speak English very well6,667 62.0% Speak English less than very well
White (Caucasian) - Speak only English Native:
90.9% (27,086)Foreign-born:
12.2% (449)
White (Caucasian) - Speak another language Native:
9.1% (2,721)Foreign-born:
87.8% (3,241)
Black or African American - Speak only English Native:
86.4% (6,232)Foreign-born:
49.9% (1,883)
Black or African American - Speak another language Native:
14.2% (1,023)Foreign-born:
46.1% (1,740)
American Indian / Alaska Native - Speak another language Native:
31.7% (30)Foreign-born:
92.6% (95)
Asian - Speak only English Native:
30.3% (330)Foreign-born:
7.6% (239)
Asian - Speak another language Native:
68.4% (745)Foreign-born:
92.9% (2,904)
Other race - Speak only English Native:
27.7% (2,434)Foreign-born:
6.5% (582)
Other race - Speak another language Native:
72.3% (6,359)Foreign-born:
93.5% (8,438)
Two or more races - Speak only English Native:
49.2% (4,023)Foreign-born:
3.5% (360)
Two or more races - Speak another language Native:
50.8% (4,151)Foreign-born:
96.5% (9,897)
White alone - Speak only English Native:
91.7% (25,773)Foreign-born:
13.4% (449)
White alone - Speak another language Native:
8.3% (2,336)Foreign-born:
86.6% (2,900)
Hispanic or Latino - Speak only English Native:
36.6% (4,846)Foreign-born:
2.7% (365)
Hispanic or Latino - Speak another language Native:
63.4% (8,390)Foreign-born:
97.3% (13,057)
Foreign-born residents in Danbury 29,569 residents are foreign born (24.7% Latin America , 3.6% Asia ).
This city:
34.1%Connecticut:
15.0%
Marital status for residents in Danbury Marital status - White (Caucasian) population 15 years and over
Males 35.8% Never married49.0% Now married2.0% Separated3.6% Widowed9.5% DivorcedFemales 31.5% Never married48.9% Now married1.2% Separated6.8% Widowed11.6% DivorcedWomen who gave birth in the past 12 months Now married:
70.7% (183)Unmarried:
29.3% (76)
Women who did not give birth in the past 12 months Now married:
33.4% (2,402)Unmarried:
66.6% (4,779)
Marital status - Black or African American population 15 years and over
Males 52.4% Never married37.4% Now married0.0% Separated0.0% Widowed10.2% DivorcedFemales 32.3% Never married44.0% Now married0.0% Separated2.4% Widowed21.3% DivorcedWomen who gave birth in the past 12 months Now married:
71.6% (47)Unmarried:
28.4% (19)
Women who did not give birth in the past 12 months Now married:
31.5% (824)Unmarried:
68.5% (1,792)
Marital status - American Indian / Alaska Native population 15 years and over
Males 12.9% Never married30.7% Now married0.0% Separated0.0% Widowed56.4% DivorcedFemales 52.2% Never married13.4% Now married0.0% Separated16.4% Widowed17.9% DivorcedWomen who did not give birth in the past 12 months Now married:
50.0% (9)Unmarried:
50.0% (9)
Marital status - Asian population 15 years and over
Males 37.2% Never married59.3% Now married0.7% Separated0.0% Widowed2.8% DivorcedFemales 30.9% Never married57.0% Now married0.9% Separated6.6% Widowed4.6% DivorcedWomen who gave birth in the past 12 months Now married:
74.8% (99)Unmarried:
25.2% (33)
Women who did not give birth in the past 12 months Now married:
50.9% (623)Unmarried:
49.1% (600)
Marital status - Other race population 15 years and over
Males 33.3% Never married45.9% Now married12.2% Separated1.6% Widowed7.0% DivorcedFemales 40.8% Never married37.3% Now married6.7% Separated9.1% Widowed6.1% DivorcedWomen who gave birth in the past 12 months Now married:
91.8% (275)Unmarried:
8.2% (25)
Women who did not give birth in the past 12 months Now married:
39.5% (2,172)Unmarried:
60.5% (3,323)
Marital status - Two or more races population 15 years and over
Males 41.1% Never married48.3% Now married2.7% Separated2.0% Widowed5.9% DivorcedFemales 40.3% Never married49.0% Now married2.6% Separated0.7% Widowed7.3% DivorcedWomen who gave birth in the past 12 months Now married:
100.0% (692)Unmarried:
0.0% (0)
Women who did not give birth in the past 12 months Now married:
45.6% (2,189)Unmarried:
54.4% (2,616)
Marital status - White alone, not Hispanic / Latino population 15 years and over
Males 35.1% Never married49.1% Now married2.1% Separated3.8% Widowed10.0% DivorcedFemales 28.1% Never married51.2% Now married1.3% Separated6.8% Widowed12.6% DivorcedWomen who gave birth in the past 12 months Now married:
35.6% (42)Unmarried:
64.4% (76)
Women who did not give birth in the past 12 months Now married:
37.8% (2,339)Unmarried:
62.2% (3,852)
Marital status - Hispanic or Latino population 15 years and over
Males 34.8% Never married44.7% Now married10.3% Separated3.8% Widowed6.4% DivorcedFemales 47.8% Never married33.8% Now married7.5% Separated6.2% Widowed4.7% DivorcedWomen who gave birth in the past 12 months Now married:
85.6% (794)Unmarried:
14.4% (134)
Women who did not give birth in the past 12 months Now married:
34.8% (2,914)Unmarried:
65.2% (5,465)
Ancestries in Danbury
3,949 8.6% Brazilian3,573 7.8% Italian1,936 4.2% Irish1,739 3.8% Portuguese1,472 3.2% German1,361 3.0% American1,176 2.6% Jamaican677 1.5% English672 1.5% Polish601 1.3% Ghanaian555 1.2% Lebanese491 1.1% Ugandan461 1.0% European321 0.7% Russian270 0.6% Guyanese246 0.5% Czechoslovakian240 0.5% Macedonian235 0.5% Scottish226 0.5% Hungarian219 0.5% African208 0.5% Latvian187 0.4% Greek173 0.4% French Canadian153 0.3% Haitian148 0.3% Slovak146 0.3% Ukrainian122 0.3% West Indian118 0.3% Swedish109 0.2% South African99 0.2% Norwegian98 0.2% Armenian93 0.2% Eastern European72 0.2% Syrian71 0.2% Slavic67 0.1% Welsh61 0.1% Cape Verdean61 0.1% Austrian57 0.1% British54 0.1% Scotch-Irish54 0.1% Barbadian53 0.1% Croatian52 0.1% French48 0.1% Bulgarian46 0.1% Australian33 0.07% Danish33 0.07% Palestinian32 0.07% Canadian29 0.06% Lithuanian26 0.06% Nigerian23 0.05% Swiss20 0.04% Serbian20 0.04% British West Indian18 0.04% Northern European18 0.04% Dutch16 0.03% Trinidadian and Tobagonian14 0.03% Scandinavian12 0.03% Pennsylvania German11 0.02% Czech10 0.02% Belizean9 0.02% Romanian5 0.01% Arab5 0.01% Carpatho Rusyn3 0.01% Iranian3 0.01% Afghan
Geographical mobility in Danbury Same house 1 year ago 30,343 88.0% White (Caucasian)8,628 76.4% Black or African American156 78.0% American Indian / Alaska Native3,886 90.4% Asian18 50.5% Native Hawaiian / Pacific Islander15,962 86.6% Other race14,085 94.2% Two or more races28,333 88.0% White alone, not Hispanic / Latino23,794 83.8% Hispanic or LatinoMoved within same county 1,864 5.4% White / Caucasian944 8.4% Black or African American22 10.8% American Indian / Alaska Native82 1.9% Asian521 2.8% Other race528 3.5% Two or more races1,698 5.3% White alone, not Hispanic / Latino2,387 8.4% Hispanic or LatinoMoved within same state 252 0.7% White / Caucasian137 1.2% Black or African American4 2.2% American Indian / Alaska Native114 2.7% Asian47 0.3% Two or more races252 0.8% White alone, not Hispanic / LatinoMoved from different state 1,480 4.3% White / Caucasian1,434 12.7% Black or African American2 1.0% American Indian / Alaska Native137 3.2% Asian18 49.7% Native Hawaiian / Pacific Islander846 4.6% Other race129 0.9% Two or more races1,370 4.3% White alone, not Hispanic / Latino1,086 3.8% Hispanic or LatinoMoved from abroad 529 1.5% White528 4.7% Black or African American75 1.7% Asian1,110 6.0% Other race169 1.1% Two or more races529 1.6% White alone, not Hispanic / Latino1,110 3.9% Hispanic or Latino
Children Nativity (place of birth) in Danbury
Children under 6 years - Living with two parents Both parents native 866 100.0% NativeBoth parents foreign-born 1,356 89.0% Native168 11.0% Foreign-bornOne native, one foreign-born parent 348 100.0% NativeChildren under 6 years - Living with one parent Native parent 1,153 100.0% NativeForeign-born parent 980 85.6% Native165 14.4% Foreign-bornChildren 6 to 17 years - Living with two parents Both parents native 1,575 100.0% NativeBoth parents foreign-born 4,503 78.5% Native1,235 21.5% Foreign-bornOne native, one foreign-born parent 653 100.0% NativeChildren 6 to 17 years - Living with one parent Native parent 2,541 100.0% NativeForeign-born parent 3,226 53.7% Native2,777 46.3% Foreign-born
Place of birth for residents in Danbury 22,573 Americas22,390 Latin America13,128 South America5,392 Caribbean3,868 Central America3,270 Asia2,764 Europe1,607 South Central Asia1,428 Southern Europe995 South Eastern Asia889 Africa790 Eastern Europe543 Western Africa482 Eastern Asia361 China338 Northern Europe194 Western Europe192 Eastern Africa185 Western Asia183 Northern America71 Oceania71 Australia and New Zealand Subregion68 Southern Africa40 Middle Africa8 Northern Africa6,333 Ecuador5,222 Brazil3,802 Dominican Republic2,091 Mexico1,054 India1,041 Guatemala1,033 Jamaica935 Portugal558 Philippines539 Peru371 Pakistan323 China305 Ghana276 Colombia275 El Salvador273 Italy266 Argentina240 Venezuela234 Costa Rica210 Cambodia183 Canada182 Guyana180 Uganda174 Hungary174 Bangladesh143 Haiti137 Spain135 Dominica131 Vietnam130 Nigeria126 England108 Russia105 Germany102 Romania100 Honduras95 Cuba92 North Macedonia (Macedonia)91 West Indies90 Ireland88 Nicaragua82 Greece81 Scotland77 Poland75 Barbados75 Japan68 Switzerland68 South Africa58 Israel57 Chile56 Thailand54 Australia51 Bosnia and Herzegovina51 Lebanon46 Korea46 Ukraine37 Serbia37 Sierra Leone36 Turkey35 Malaysia33 Bulgaria33 Taiwan28 Belize28 Cabo Verde23 United Kingdom18 Czechoslovakia18 Belarus16 New Zealand16 Trinidad and Tobago15 Croatia14 Azores Islands13 Jordan12 Tanzania12 United Arab Emirates11 Sweden10 France10 Uruguay10 Netherlands8 Sudan8 Panama5 Iran4 Hong Kong4 Iraq3 Liberia2 Afghanistan2 Laos
Grandparents responsible for own grandchildren in Danbury
Grandparents (30 to 59 years) White / Caucasian 72 46.6% Responsible for grandchildren83 53.4% Not responsible for grandchildrenAsian 118 100.0% Not responsible for grandchildrenOther race 50 16.7% Responsible for grandchildren249 83.3% Not responsible for grandchildrenTwo or more races 83 50.0% Responsible for grandchildren83 50.0% Not responsible for grandchildrenWhite alone, not Hispanic / Latino 67 46.8% Responsible for grandchildren76 53.2% Not responsible for grandchildrenHispanic or Latino 152 38.4% Responsible for grandchildren243 61.6% Not responsible for grandchildrenGrandparents (60 years and over) White / Caucasian 74 10.7% Responsible for grandchildren618 89.3% Not responsible for grandchildrenAsian 137 100.0% Not responsible for grandchildrenOther race 83 41.5% Responsible for grandchildren117 58.5% Not responsible for grandchildrenTwo or more races 122 51.8% Responsible for grandchildren114 48.2% Not responsible for grandchildrenWhite alone, not Hispanic / Latino 78 11.7% Responsible for grandchildren590 88.3% Not responsible for grandchildrenHispanic or Latino 103 25.6% Responsible for grandchildren300 74.4% Not responsible for grandchildren