Races in De Pere, Wisconsin (WI) Detailed Stats
Data:
Races - White alone (%)
Races - White alone (% change since 2000)
Races - Black alone (%)
Races - Black alone (% change since 2000)
Races - American Indian alone (%)
Races - American Indian alone (% change since 2000)
Races - Asian alone (%)
Races - Asian alone (% change since 2000)
Races - Hispanic (%)
Races - Hispanic (% change since 2000)
Races - Native Hawaiian and Other Pacific Islander alone (%)
Races - Native Hawaiian and Other Pacific Islander alone (% change since 2000)
Races - Two or more races(%)
Races - Two or more races(% change since 2000)
Races - Other race alone (%)
Races - Other race alone (% change since 2000)
Racial diversity
Place of birth - Born in state of residence (%)
Place of birth - Born in state of residence (%) - White
Place of birth - Born in state of residence (%) - Black or African American
Place of birth - Born in state of residence (%) - Asian
Place of birth - Born in state of residence (%) - Hispanic or Latino
Place of birth - Born in state of residence (%) - American Indian and Alaska Native
Place of birth - Born in state of residence (%) - Multirace
Place of birth - Born in state of residence (%) - Other Race
Place of birth - Born in other state (%)
Place of birth - Born in other state (%) - White
Place of birth - Born in other state (%) - Black or African American
Place of birth - Born in other state (%) - Asian
Place of birth - Born in other state (%) - Hispanic or Latino
Place of birth - Born in other state (%) - American Indian and Alaska Native
Place of birth - Born in other state (%) - Multirace
Place of birth - Born in other state (%) - Other Race
Place of birth - Native, outside of US (%)
Place of birth - Native, outside of US (%) - White
Place of birth - Native, outside of US (%) - Black or African American
Place of birth - Native, outside of US (%) - Asian
Place of birth - Native, outside of US (%) - Hispanic or Latino
Place of birth - Native, outside of US (%) - American Indian and Alaska Native
Place of birth - Native, outside of US (%) - Multirace
Place of birth - Native, outside of US (%) - Other Race
Place of birth - Foreign born (%)
Place of birth - Foreign born (%) - White
Place of birth - Foreign born (%) - Black or African American
Place of birth - Foreign born (%) - Asian
Place of birth - Foreign born (%) - Hispanic or Latino
Place of birth - Foreign born (%) - American Indian and Alaska Native
Place of birth - Foreign born (%) - Multirace
Place of birth - Foreign born (%) - Other Race
Residents speaking English at home (%)
Residents speaking English at home - Born in the United States (%)
Residents speaking English at home - Native, born elsewhere (%)
Residents speaking English at home - Foreign born (%)
Residents speaking Spanish at home (%)
Residents speaking Spanish at home - Born in the United States (%)
Residents speaking Spanish at home - Native, born elsewhere (%)
Residents speaking Spanish at home - Foreign born (%)
Residents speaking other language at home (%)
Residents speaking other language at home - Born in the United States (%)
Residents speaking other language at home - Native, born elsewhere (%)
Residents speaking other language at home - Foreign born (%)
Marital status - Never married (%)
Marital status - Now married (%)
Marital status - Separated (%)
Marital status - Widowed (%)
Marital status - Divorced (%)
Ancestries Reported - Arab (%)
Ancestries Reported - Czech (%)
Ancestries Reported - Danish (%)
Ancestries Reported - Dutch (%)
Ancestries Reported - English (%)
Ancestries Reported - French (%)
Ancestries Reported - French Canadian (%)
Ancestries Reported - German (%)
Ancestries Reported - Greek (%)
Ancestries Reported - Hungarian (%)
Ancestries Reported - Irish (%)
Ancestries Reported - Italian (%)
Ancestries Reported - Lithuanian (%)
Ancestries Reported - Norwegian (%)
Ancestries Reported - Polish (%)
Ancestries Reported - Portuguese (%)
Ancestries Reported - Russian (%)
Ancestries Reported - Scotch-Irish (%)
Ancestries Reported - Scottish (%)
Ancestries Reported - Slovak (%)
Ancestries Reported - Subsaharan African (%)
Ancestries Reported - Swedish (%)
Ancestries Reported - Swiss (%)
Ancestries Reported - Ukrainian (%)
Ancestries Reported - United States (%)
Ancestries Reported - Welsh (%)
Ancestries Reported - West Indian (%)
Ancestries Reported - Other (%)
Geographical mobility - Same house 1 year ago (%)
Geographical mobility - Same house 1 year ago (%) - White
Geographical mobility - Same house 1 year ago (%) - Black or African American
Geographical mobility - Same house 1 year ago (%) - Asian
Geographical mobility - Same house 1 year ago (%) - Hispanic or Latino
Geographical mobility - Same house 1 year ago (%) - American Indian and Alaska Native
Geographical mobility - Same house 1 year ago (%) - Multirace
Geographical mobility - Same house 1 year ago (%) - Other Race
Geographical mobility - Moved within same county (%)
Geographical mobility - Moved within same county (%) - White
Geographical mobility - Moved within same county (%) - Black or African American
Geographical mobility - Moved within same county (%) - Asian
Geographical mobility - Moved within same county (%) - Hispanic or Latino
Geographical mobility - Moved within same county (%) - American Indian and Alaska Native
Geographical mobility - Moved within same county (%) - Multirace
Geographical mobility - Moved within same county (%) - Other Race
Geographical mobility - Moved from different county within same state (%)
Geographical mobility - Moved from different county within same state (%) - White
Geographical mobility - Moved from different county within same state (%) - Black or African American
Geographical mobility - Moved from different county within same state (%) - Asian
Geographical mobility - Moved from different county within same state (%) - Hispanic or Latino
Geographical mobility - Moved from different county within same state (%) - American Indian and Alaska Native
Geographical mobility - Moved from different county within same state (%) - Multirace
Geographical mobility - Moved from different county within same state (%) - Other Race
Geographical mobility - Moved from different state (%)
Geographical mobility - Moved from different state (%) - White
Geographical mobility - Moved from different state (%) - Black or African American
Geographical mobility - Moved from different state (%) - Asian
Geographical mobility - Moved from different state (%) - Hispanic or Latino
Geographical mobility - Moved from different state (%) - American Indian and Alaska Native
Geographical mobility - Moved from different state (%) - Multirace
Geographical mobility - Moved from different state (%) - Other Race
Geographical mobility - Moved from abroad (%)
Geographical mobility - Moved from abroad (%) - White
Geographical mobility - Moved from abroad (%) - Black or African American
Geographical mobility - Moved from abroad (%) - Asian
Geographical mobility - Moved from abroad (%) - Hispanic or Latino
Geographical mobility - Moved from abroad (%) - American Indian and Alaska Native
Geographical mobility - Moved from abroad (%) - Multirace
Geographical mobility - Moved from abroad (%) - Other Race
Place of birth for the foreign-born population - Ireland (%)
Place of birth for the foreign-born population - Denmark (%)
Place of birth for the foreign-born population - Norway (%)
Place of birth for the foreign-born population - Sweden (%)
Place of birth for the foreign-born population - United Kingdom (%)
Place of birth for the foreign-born population - England (%)
Place of birth for the foreign-born population - Scotland (%)
Place of birth for the foreign-born population - Other Northern Europe (%)
Place of birth for the foreign-born population - Austria (%)
Place of birth for the foreign-born population - Belgium (%)
Place of birth for the foreign-born population - France (%)
Place of birth for the foreign-born population - Germany (%)
Place of birth for the foreign-born population - Netherlands (%)
Place of birth for the foreign-born population - Switzerland (%)
Place of birth for the foreign-born population - Other Western Europe (%)
Place of birth for the foreign-born population - Greece (%)
Place of birth for the foreign-born population - Italy (%)
Place of birth for the foreign-born population - Portugal (%)
Place of birth for the foreign-born population - Spain (%)
Place of birth for the foreign-born population - Other Southern Europe (%)
Place of birth for the foreign-born population - Albania (%)
Place of birth for the foreign-born population - Belarus (%)
Place of birth for the foreign-born population - Bosnia and Herzegovina (%)
Place of birth for the foreign-born population - Bulgaria (%)
Place of birth for the foreign-born population - Croatia (%)
Place of birth for the foreign-born population - Czechoslovakia (%)
Place of birth for the foreign-born population - Hungary (%)
Place of birth for the foreign-born population - Latvia (%)
Place of birth for the foreign-born population - Lithuania (%)
Place of birth for the foreign-born population - North Macedonia (Macedonia) (%)
Place of birth for the foreign-born population - Moldova (%)
Place of birth for the foreign-born population - Poland (%)
Place of birth for the foreign-born population - Romania (%)
Place of birth for the foreign-born population - Russia (%)
Place of birth for the foreign-born population - Serbia (%)
Place of birth for the foreign-born population - Ukraine (%)
Place of birth for the foreign-born population - Other Eastern Europe (%)
Place of birth for the foreign-born population - China (%)
Place of birth for the foreign-born population - Hong Kong (%)
Place of birth for the foreign-born population - Taiwan (%)
Place of birth for the foreign-born population - Japan (%)
Place of birth for the foreign-born population - Korea (%)
Place of birth for the foreign-born population - Other Eastern Asia (%)
Place of birth for the foreign-born population - Afghanistan (%)
Place of birth for the foreign-born population - Bangladesh (%)
Place of birth for the foreign-born population - India (%)
Place of birth for the foreign-born population - Iran (%)
Place of birth for the foreign-born population - Kazakhstan (%)
Place of birth for the foreign-born population - Nepal (%)
Place of birth for the foreign-born population - Pakistan (%)
Place of birth for the foreign-born population - Sri Lanka (%)
Place of birth for the foreign-born population - Uzbekistan (%)
Place of birth for the foreign-born population - Other South Central Asia (%)
Place of birth for the foreign-born population - Burma (%)
Place of birth for the foreign-born population - Cambodia (%)
Place of birth for the foreign-born population - Indonesia (%)
Place of birth for the foreign-born population - Laos (%)
Place of birth for the foreign-born population - Malaysia (%)
Place of birth for the foreign-born population - Philippines (%)
Place of birth for the foreign-born population - Singapore (%)
Place of birth for the foreign-born population - Thailand (%)
Place of birth for the foreign-born population - Vietnam (%)
Place of birth for the foreign-born population - Other South Eastern Asia (%)
Place of birth for the foreign-born population - Armenia (%)
Place of birth for the foreign-born population - Iraq (%)
Place of birth for the foreign-born population - Israel (%)
Place of birth for the foreign-born population - Jordan (%)
Place of birth for the foreign-born population - Kuwait (%)
Place of birth for the foreign-born population - Lebanon (%)
Place of birth for the foreign-born population - Saudi Arabia (%)
Place of birth for the foreign-born population - Syria (%)
Place of birth for the foreign-born population - Turkey (%)
Place of birth for the foreign-born population - Yemen (%)
Place of birth for the foreign-born population - Other Western Asia (%)
Place of birth for the foreign-born population - Eritrea (%)
Place of birth for the foreign-born population - Ethiopia (%)
Place of birth for the foreign-born population - Kenya (%)
Place of birth for the foreign-born population - Somalia (%)
Place of birth for the foreign-born population - Uganda (%)
Place of birth for the foreign-born population - Zimbabwe (%)
Place of birth for the foreign-born population - Other Eastern Africa (%)
Place of birth for the foreign-born population - Cameroon (%)
Place of birth for the foreign-born population - Congo (%)
Place of birth for the foreign-born population - Democratic Republic of Congo (Zaire) (%)
Place of birth for the foreign-born population - Other Middle Africa (%)
Place of birth for the foreign-born population - Egypt (%)
Place of birth for the foreign-born population - Morocco (%)
Place of birth for the foreign-born population - Sudan (%)
Place of birth for the foreign-born population - Other Northern Africa (%)
Place of birth for the foreign-born population - South Africa (%)
Place of birth for the foreign-born population - Other Southern Africa (%)
Place of birth for the foreign-born population - Cabo Verde (%)
Place of birth for the foreign-born population - Ghana (%)
Place of birth for the foreign-born population - Liberia (%)
Place of birth for the foreign-born population - Nigeria (%)
Place of birth for the foreign-born population - Senegal (%)
Place of birth for the foreign-born population - Sierra Leone (%)
Place of birth for the foreign-born population - Other Western Africa (%)
Place of birth for the foreign-born population - Australia (%)
Place of birth for the foreign-born population - New Zealand (%)
Place of birth for the foreign-born population - Fiji (%)
Place of birth for the foreign-born population - Micronesia (%)
Place of birth for the foreign-born population - Bahamas (%)
Place of birth for the foreign-born population - Barbados (%)
Place of birth for the foreign-born population - Cuba (%)
Place of birth for the foreign-born population - Dominica (%)
Place of birth for the foreign-born population - Dominican Republic (%)
Place of birth for the foreign-born population - Grenada (%)
Place of birth for the foreign-born population - Haiti (%)
Place of birth for the foreign-born population - Jamaica (%)
Place of birth for the foreign-born population - St. Vincent and the Grenadines (%)
Place of birth for the foreign-born population - Trinidad and Tobago (%)
Place of birth for the foreign-born population - West Indies (%)
Place of birth for the foreign-born population - Other Caribbean (%)
Place of birth for the foreign-born population - Belize (%)
Place of birth for the foreign-born population - Costa Rica (%)
Place of birth for the foreign-born population - El Salvador (%)
Place of birth for the foreign-born population - Guatemala (%)
Place of birth for the foreign-born population - Honduras (%)
Place of birth for the foreign-born population - Mexico (%)
Place of birth for the foreign-born population - Nicaragua (%)
Place of birth for the foreign-born population - Panama (%)
Place of birth for the foreign-born population - Other Central America (%)
Place of birth for the foreign-born population - Argentina (%)
Place of birth for the foreign-born population - Bolivia (%)
Place of birth for the foreign-born population - Brazil (%)
Place of birth for the foreign-born population - Chile (%)
Place of birth for the foreign-born population - Colombia (%)
Place of birth for the foreign-born population - Ecuador (%)
Place of birth for the foreign-born population - Guyana (%)
Place of birth for the foreign-born population - Peru (%)
Place of birth for the foreign-born population - Uruguay (%)
Place of birth for the foreign-born population - Venezuela (%)
Place of birth for the foreign-born population - Other South America (%)
Place of birth for the foreign-born population - Canada (%)
Place of birth for the foreign-born population - Other Northern America (%)
Place of birth for the foreign-born population - Other (%)
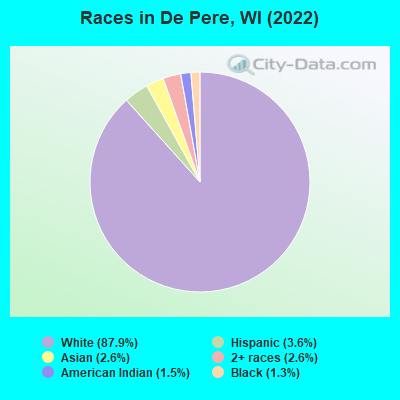
According to 2022 data, the most numerous races in De Pere, WI are White alone (22,439 residents), Hispanic (916 residents), and Black alone (331 residents). 95.9% of De Pere residents speak English at home. 3.1% of De Pere, WI residents are foreign-born (2.0% born in Asia, 0.5% born in Europe, 0.5% born in Latin America), which is 63.0% less than the foreign-born rate of 5.0% across the entire state of Wisconsin.
Race distribution in De Pere
2000 2022
4,681,630 87.3% White alone 300,245 5.6% Black alone 192,921 3.6% Hispanic 87,995 1.6% Asian alone 51,921 1.0% Two or more races 43,980 0.8% American Indian alone 3,637 0.07% Other race alone 1,346 0.03% Native Hawaiian and Other
4,654,031 79.0% White alone 447,022 7.6% Hispanic 345,678 5.9% Black alone 217,532 3.7% Two or more races 172,242 2.9% Asian alone 33,762 0.6% American Indian alone 19,680 0.3% Other race alone 2,592 0.04% Native Hawaiian and Other
Income and house value in De Pere Median household income in 2022 $75,879 White non-Hispanic householders$92,181 American Indian and Alaska Native householders$101,837 Asian householders$129,501 Some other race householders$73,647 Two or more races householders$114,647 Hispanic or Latino race householdersMedian 2022 house value $256,751 White Non-Hispanic householders$289,847 American Indian or Alaska Native householders $371,847 Asian householders$342,546 Two or more races householders
Median age by race in De Pere
39.0 Median age for White residents36.3 40.5 33.2 Median age for Black or African American residents22.9 35.2 28.6 Median age for American Indian / Alaska Native residents15.1 44.5 30.0 Median age for Asian residents34.7 28.9 -825,688,072.6 Median age for Native Hawaiian / Pacific Islander residents-862,745,097.2 -732,444,443.7 37.5 Median age for Other race residents41.6 9.4 19.0 Median age for Two or more races residents21.4 20.2 39.3 Median age for White alone residents36.7 41.0 16.4 Median age for Hispanic or Latino residents19.8 11.3
Owner/renter occupied households by race in De Pere
House owners and renters - White residents 6,401 68.2% Owner occupied2,985 31.8% Renter occupiedHouse owners and renters - Black or African American residents 93 100.0% Renter occupiedHouse owners and renters - American Indian / Alaska Native residents 85 49.7% Owner occupied86 50.3% Renter occupiedHouse owners and renters - Asian residents 94 35.0% Owner occupied174 65.0% Renter occupiedHouse owners and renters - Other race residents 35 56.8% Owner occupied27 43.2% Renter occupiedHouse owners and renters - Two or more races residents 42 14.1% Owner occupied256 85.9% Renter occupiedHouse owners and renters - White alone residents 6,431 68.3% Owner occupied2,983 31.7% Renter occupiedHouse owners and renters - Hispanic or Latino residents 37 32.0% Owner occupied78 68.0% Renter occupied
Language usage in De Pere
English speakers - Total 95.9% of residents of De Pere speak English at home.
1.7% of residents speak Spanish at home 333 78.2% Speak English very well93 21.8% Speak English less than very well2.7% of residents speak other language at home 415 62.3% Speak English very well251 37.7% Speak English less than very well
English speakers - Born in the United States 97.5% of residents of De Pere speak English at home.
1.0% of residents speak Spanish at home 45 100.0% Speak English very well1.1% of residents speak other language at home 16 30.2% Speak English very well37 69.8% Speak English less than very well
English speakers - Native, born elsewhere 64.0% of residents of De Pere speak English at home.
7.1% of residents speak Spanish at home 9 64.3% Speak English very well5 35.7% Speak English less than very well
English speakers - Foreign-born 30.5% of residents of De Pere speak English at home.
10.6% of residents speak Spanish at home 34 50.0% Speak English very well34 50.0% Speak English less than very well64.8% of residents speak other language at home 205 49.4% Speak English very well210 50.6% Speak English less than very well
White (Caucasian) - Speak only English Native:
98.5% (21,250)Foreign-born:
78.4% (103)
White (Caucasian) - Speak another language Native:
1.5% (319)Foreign-born:
39.2% (51)
Black or African American - Speak only English Native:
86.5% (301)Foreign-born:
76.6% (3)
Asian - Speak only English Native:
73.7% (121)Foreign-born:
3.7% (14)
Asian - Speak another language Native:
30.6% (50)Foreign-born:
88.8% (337)
Other race - Speak only English Native:
22.2% (35)Foreign-born:
22.4% (19)
Other race - Speak another language Native:
77.1% (121)Foreign-born:
80.3% (69)
Two or more races - Speak only English Native:
96.1% (953)Foreign-born:
100.0% (37)
Two or more races - Speak another language Native:
4.4% (43)Foreign-born:
52.1% (19)
White alone - Speak only English Native:
98.6% (21,025)Foreign-born:
52.7% (81)
White alone - Speak another language Native:
1.4% (308)Foreign-born:
47.4% (73)
Hispanic or Latino - Speak only English Native:
80.5% (717)Foreign-born:
57.2% (40)
Hispanic or Latino - Speak another language Native:
23.4% (208)Foreign-born:
63.0% (44)
Foreign-born residents in De Pere 783 residents are foreign born (2.0% Asia , 0.5% Europe , 0.5% Latin America ).
This city:
3.1%Wisconsin:
5.0%
Marital status for residents in De Pere Marital status - White (Caucasian) population 15 years and over
Males 33.0% Never married50.3% Now married0.7% Separated2.4% Widowed13.7% DivorcedFemales 32.3% Never married47.5% Now married0.1% Separated7.4% Widowed12.7% DivorcedWomen who gave birth in the past 12 months Now married:
65.2% (144)Unmarried:
34.8% (77)
Women who did not give birth in the past 12 months Now married:
41.7% (2,349)Unmarried:
58.3% (3,278)
Marital status - Black or African American population 15 years and over
Males 79.7% Never married20.3% Now married0.0% Separated0.0% Widowed0.0% DivorcedFemales 47.7% Never married46.8% Now married0.0% Separated5.5% Widowed0.0% DivorcedWomen who did not give birth in the past 12 months Now married:
49.5% (49)Unmarried:
50.5% (50)
Marital status - American Indian / Alaska Native population 15 years and over
Males 93.6% Never married0.0% Now married0.0% Separated0.0% Widowed6.4% DivorcedFemales 60.0% Never married2.9% Now married0.0% Separated24.0% Widowed13.1% DivorcedWomen who did not give birth in the past 12 months Now married:
0.0% (0)Unmarried:
100.0% (161)
Marital status - Asian population 15 years and over
Males 42.2% Never married57.8% Now married0.0% Separated0.0% Widowed0.0% DivorcedFemales 25.5% Never married74.5% Now married0.0% Separated0.0% Widowed0.0% DivorcedWomen who gave birth in the past 12 months Now married:
0.0% (0)Unmarried:
100.0% (12)
Women who did not give birth in the past 12 months Now married:
76.9% (131)Unmarried:
23.1% (39)
Marital status - Other race population 15 years and over
Males 40.7% Never married59.3% Now married0.0% Separated0.0% Widowed0.0% DivorcedFemales 45.2% Never married54.8% Now married0.0% Separated0.0% Widowed0.0% DivorcedWomen who did not give birth in the past 12 months Now married:
54.8% (15)Unmarried:
45.2% (13)
Marital status - Two or more races population 15 years and over
Males 68.4% Never married13.6% Now married0.0% Separated0.0% Widowed17.9% DivorcedFemales 51.2% Never married35.0% Now married0.0% Separated0.0% Widowed13.7% DivorcedWomen who did not give birth in the past 12 months Now married:
29.6% (82)Unmarried:
70.4% (195)
Marital status - White alone, not Hispanic / Latino population 15 years and over
Males 32.7% Never married50.5% Now married0.7% Separated2.4% Widowed13.7% DivorcedFemales 32.3% Never married47.5% Now married0.1% Separated7.4% Widowed12.7% DivorcedWomen who gave birth in the past 12 months Now married:
63.3% (134)Unmarried:
36.7% (78)
Women who did not give birth in the past 12 months Now married:
41.9% (2,378)Unmarried:
58.1% (3,291)
Marital status - Hispanic or Latino population 15 years and over
Males 66.0% Never married31.9% Now married0.0% Separated0.0% Widowed2.1% DivorcedFemales 52.7% Never married44.9% Now married0.0% Separated0.0% Widowed2.4% DivorcedWomen who gave birth in the past 12 months Now married:
100.0% (13)Unmarried:
0.0% (0)
Women who did not give birth in the past 12 months Now married:
35.2% (56)Unmarried:
64.8% (102)
Ancestries in De Pere
3,319 32.9% German745 7.4% Polish669 6.6% American568 5.6% English542 5.4% Irish390 3.9% Italian368 3.6% European275 2.7% Dutch231 2.3% Belgian231 2.3% French173 1.7% Northern European165 1.6% Norwegian86 0.9% Finnish62 0.6% Danish57 0.6% Czech57 0.6% French Canadian55 0.5% Swedish40 0.4% Russian25 0.2% Arab23 0.2% Scottish20 0.2% Bulgarian20 0.2% Canadian20 0.2% Croatian16 0.2% Austrian14 0.1% Ukrainian12 0.1% Swiss12 0.1% Turkish11 0.1% Eastern European8 0.08% Slovak7 0.07% Scandinavian7 0.07% Slavic2 0.02% Ethiopian
Geographical mobility in De Pere Same house 1 year ago 19,739 88.2% White (Caucasian)169 47.9% Black or African American357 91.4% American Indian / Alaska Native459 71.0% Asian4 100.0% Native Hawaiian / Pacific Islander145 75.5% Other race758 73.4% Two or more races19,624 88.0% White alone, not Hispanic / Latino547 60.9% Hispanic or LatinoMoved within same county 1,047 4.7% White / Caucasian59 16.7% Black or African American25 6.4% American Indian / Alaska Native76 11.7% Asian42 21.7% Other race17 1.7% Two or more races1,031 4.6% White alone, not Hispanic / Latino112 12.4% Hispanic or LatinoMoved within same state 1,207 5.4% White / Caucasian53 15.2% Black or African American12 3.1% American Indian / Alaska Native63 9.8% Asian1,241 5.6% White alone, not Hispanic / Latino2 0.2% Hispanic or LatinoMoved from different state 350 1.6% White / Caucasian86 24.6% Black or African American305 29.5% Two or more races360 1.6% White alone, not Hispanic / Latino244 27.1% Hispanic or LatinoMoved from abroad 31 0.1% White33 0.2% White alone, not Hispanic / Latino
Children Nativity (place of birth) in De Pere
Children under 6 years - Living with two parents Both parents native 941 100.0% NativeBoth parents foreign-born 15 25.6% Native44 74.4% Foreign-bornOne native, one foreign-born parent 31 100.0% NativeChildren under 6 years - Living with one parent Native parent 256 100.0% NativeForeign-born parent 25 100.0% NativeChildren 6 to 17 years - Living with two parents Both parents native 2,939 100.0% NativeBoth parents foreign-born 31 100.0% NativeOne native, one foreign-born parent 31 100.0% NativeChildren 6 to 17 years - Living with one parent Native parent 938 100.0% NativeForeign-born parent 28 48.4% Native30 51.6% Foreign-born