Races in Decatur, Illinois (IL) Detailed Stats
Data:
Races - White alone (%)
Races - White alone (% change since 2000)
Races - Black alone (%)
Races - Black alone (% change since 2000)
Races - American Indian alone (%)
Races - American Indian alone (% change since 2000)
Races - Asian alone (%)
Races - Asian alone (% change since 2000)
Races - Hispanic (%)
Races - Hispanic (% change since 2000)
Races - Native Hawaiian and Other Pacific Islander alone (%)
Races - Native Hawaiian and Other Pacific Islander alone (% change since 2000)
Races - Two or more races(%)
Races - Two or more races(% change since 2000)
Races - Other race alone (%)
Races - Other race alone (% change since 2000)
Racial diversity
Place of birth - Born in state of residence (%)
Place of birth - Born in state of residence (%) - White
Place of birth - Born in state of residence (%) - Black or African American
Place of birth - Born in state of residence (%) - Asian
Place of birth - Born in state of residence (%) - Hispanic or Latino
Place of birth - Born in state of residence (%) - American Indian and Alaska Native
Place of birth - Born in state of residence (%) - Multirace
Place of birth - Born in state of residence (%) - Other Race
Place of birth - Born in other state (%)
Place of birth - Born in other state (%) - White
Place of birth - Born in other state (%) - Black or African American
Place of birth - Born in other state (%) - Asian
Place of birth - Born in other state (%) - Hispanic or Latino
Place of birth - Born in other state (%) - American Indian and Alaska Native
Place of birth - Born in other state (%) - Multirace
Place of birth - Born in other state (%) - Other Race
Place of birth - Native, outside of US (%)
Place of birth - Native, outside of US (%) - White
Place of birth - Native, outside of US (%) - Black or African American
Place of birth - Native, outside of US (%) - Asian
Place of birth - Native, outside of US (%) - Hispanic or Latino
Place of birth - Native, outside of US (%) - American Indian and Alaska Native
Place of birth - Native, outside of US (%) - Multirace
Place of birth - Native, outside of US (%) - Other Race
Place of birth - Foreign born (%)
Place of birth - Foreign born (%) - White
Place of birth - Foreign born (%) - Black or African American
Place of birth - Foreign born (%) - Asian
Place of birth - Foreign born (%) - Hispanic or Latino
Place of birth - Foreign born (%) - American Indian and Alaska Native
Place of birth - Foreign born (%) - Multirace
Place of birth - Foreign born (%) - Other Race
Residents speaking English at home (%)
Residents speaking English at home - Born in the United States (%)
Residents speaking English at home - Native, born elsewhere (%)
Residents speaking English at home - Foreign born (%)
Residents speaking Spanish at home (%)
Residents speaking Spanish at home - Born in the United States (%)
Residents speaking Spanish at home - Native, born elsewhere (%)
Residents speaking Spanish at home - Foreign born (%)
Residents speaking other language at home (%)
Residents speaking other language at home - Born in the United States (%)
Residents speaking other language at home - Native, born elsewhere (%)
Residents speaking other language at home - Foreign born (%)
Marital status - Never married (%)
Marital status - Now married (%)
Marital status - Separated (%)
Marital status - Widowed (%)
Marital status - Divorced (%)
Ancestries Reported - Arab (%)
Ancestries Reported - Czech (%)
Ancestries Reported - Danish (%)
Ancestries Reported - Dutch (%)
Ancestries Reported - English (%)
Ancestries Reported - French (%)
Ancestries Reported - French Canadian (%)
Ancestries Reported - German (%)
Ancestries Reported - Greek (%)
Ancestries Reported - Hungarian (%)
Ancestries Reported - Irish (%)
Ancestries Reported - Italian (%)
Ancestries Reported - Lithuanian (%)
Ancestries Reported - Norwegian (%)
Ancestries Reported - Polish (%)
Ancestries Reported - Portuguese (%)
Ancestries Reported - Russian (%)
Ancestries Reported - Scotch-Irish (%)
Ancestries Reported - Scottish (%)
Ancestries Reported - Slovak (%)
Ancestries Reported - Subsaharan African (%)
Ancestries Reported - Swedish (%)
Ancestries Reported - Swiss (%)
Ancestries Reported - Ukrainian (%)
Ancestries Reported - United States (%)
Ancestries Reported - Welsh (%)
Ancestries Reported - West Indian (%)
Ancestries Reported - Other (%)
Geographical mobility - Same house 1 year ago (%)
Geographical mobility - Same house 1 year ago (%) - White
Geographical mobility - Same house 1 year ago (%) - Black or African American
Geographical mobility - Same house 1 year ago (%) - Asian
Geographical mobility - Same house 1 year ago (%) - Hispanic or Latino
Geographical mobility - Same house 1 year ago (%) - American Indian and Alaska Native
Geographical mobility - Same house 1 year ago (%) - Multirace
Geographical mobility - Same house 1 year ago (%) - Other Race
Geographical mobility - Moved within same county (%)
Geographical mobility - Moved within same county (%) - White
Geographical mobility - Moved within same county (%) - Black or African American
Geographical mobility - Moved within same county (%) - Asian
Geographical mobility - Moved within same county (%) - Hispanic or Latino
Geographical mobility - Moved within same county (%) - American Indian and Alaska Native
Geographical mobility - Moved within same county (%) - Multirace
Geographical mobility - Moved within same county (%) - Other Race
Geographical mobility - Moved from different county within same state (%)
Geographical mobility - Moved from different county within same state (%) - White
Geographical mobility - Moved from different county within same state (%) - Black or African American
Geographical mobility - Moved from different county within same state (%) - Asian
Geographical mobility - Moved from different county within same state (%) - Hispanic or Latino
Geographical mobility - Moved from different county within same state (%) - American Indian and Alaska Native
Geographical mobility - Moved from different county within same state (%) - Multirace
Geographical mobility - Moved from different county within same state (%) - Other Race
Geographical mobility - Moved from different state (%)
Geographical mobility - Moved from different state (%) - White
Geographical mobility - Moved from different state (%) - Black or African American
Geographical mobility - Moved from different state (%) - Asian
Geographical mobility - Moved from different state (%) - Hispanic or Latino
Geographical mobility - Moved from different state (%) - American Indian and Alaska Native
Geographical mobility - Moved from different state (%) - Multirace
Geographical mobility - Moved from different state (%) - Other Race
Geographical mobility - Moved from abroad (%)
Geographical mobility - Moved from abroad (%) - White
Geographical mobility - Moved from abroad (%) - Black or African American
Geographical mobility - Moved from abroad (%) - Asian
Geographical mobility - Moved from abroad (%) - Hispanic or Latino
Geographical mobility - Moved from abroad (%) - American Indian and Alaska Native
Geographical mobility - Moved from abroad (%) - Multirace
Geographical mobility - Moved from abroad (%) - Other Race
Place of birth for the foreign-born population - Ireland (%)
Place of birth for the foreign-born population - Denmark (%)
Place of birth for the foreign-born population - Norway (%)
Place of birth for the foreign-born population - Sweden (%)
Place of birth for the foreign-born population - United Kingdom (%)
Place of birth for the foreign-born population - England (%)
Place of birth for the foreign-born population - Scotland (%)
Place of birth for the foreign-born population - Other Northern Europe (%)
Place of birth for the foreign-born population - Austria (%)
Place of birth for the foreign-born population - Belgium (%)
Place of birth for the foreign-born population - France (%)
Place of birth for the foreign-born population - Germany (%)
Place of birth for the foreign-born population - Netherlands (%)
Place of birth for the foreign-born population - Switzerland (%)
Place of birth for the foreign-born population - Other Western Europe (%)
Place of birth for the foreign-born population - Greece (%)
Place of birth for the foreign-born population - Italy (%)
Place of birth for the foreign-born population - Portugal (%)
Place of birth for the foreign-born population - Spain (%)
Place of birth for the foreign-born population - Other Southern Europe (%)
Place of birth for the foreign-born population - Albania (%)
Place of birth for the foreign-born population - Belarus (%)
Place of birth for the foreign-born population - Bosnia and Herzegovina (%)
Place of birth for the foreign-born population - Bulgaria (%)
Place of birth for the foreign-born population - Croatia (%)
Place of birth for the foreign-born population - Czechoslovakia (%)
Place of birth for the foreign-born population - Hungary (%)
Place of birth for the foreign-born population - Latvia (%)
Place of birth for the foreign-born population - Lithuania (%)
Place of birth for the foreign-born population - North Macedonia (Macedonia) (%)
Place of birth for the foreign-born population - Moldova (%)
Place of birth for the foreign-born population - Poland (%)
Place of birth for the foreign-born population - Romania (%)
Place of birth for the foreign-born population - Russia (%)
Place of birth for the foreign-born population - Serbia (%)
Place of birth for the foreign-born population - Ukraine (%)
Place of birth for the foreign-born population - Other Eastern Europe (%)
Place of birth for the foreign-born population - China (%)
Place of birth for the foreign-born population - Hong Kong (%)
Place of birth for the foreign-born population - Taiwan (%)
Place of birth for the foreign-born population - Japan (%)
Place of birth for the foreign-born population - Korea (%)
Place of birth for the foreign-born population - Other Eastern Asia (%)
Place of birth for the foreign-born population - Afghanistan (%)
Place of birth for the foreign-born population - Bangladesh (%)
Place of birth for the foreign-born population - India (%)
Place of birth for the foreign-born population - Iran (%)
Place of birth for the foreign-born population - Kazakhstan (%)
Place of birth for the foreign-born population - Nepal (%)
Place of birth for the foreign-born population - Pakistan (%)
Place of birth for the foreign-born population - Sri Lanka (%)
Place of birth for the foreign-born population - Uzbekistan (%)
Place of birth for the foreign-born population - Other South Central Asia (%)
Place of birth for the foreign-born population - Burma (%)
Place of birth for the foreign-born population - Cambodia (%)
Place of birth for the foreign-born population - Indonesia (%)
Place of birth for the foreign-born population - Laos (%)
Place of birth for the foreign-born population - Malaysia (%)
Place of birth for the foreign-born population - Philippines (%)
Place of birth for the foreign-born population - Singapore (%)
Place of birth for the foreign-born population - Thailand (%)
Place of birth for the foreign-born population - Vietnam (%)
Place of birth for the foreign-born population - Other South Eastern Asia (%)
Place of birth for the foreign-born population - Armenia (%)
Place of birth for the foreign-born population - Iraq (%)
Place of birth for the foreign-born population - Israel (%)
Place of birth for the foreign-born population - Jordan (%)
Place of birth for the foreign-born population - Kuwait (%)
Place of birth for the foreign-born population - Lebanon (%)
Place of birth for the foreign-born population - Saudi Arabia (%)
Place of birth for the foreign-born population - Syria (%)
Place of birth for the foreign-born population - Turkey (%)
Place of birth for the foreign-born population - Yemen (%)
Place of birth for the foreign-born population - Other Western Asia (%)
Place of birth for the foreign-born population - Eritrea (%)
Place of birth for the foreign-born population - Ethiopia (%)
Place of birth for the foreign-born population - Kenya (%)
Place of birth for the foreign-born population - Somalia (%)
Place of birth for the foreign-born population - Uganda (%)
Place of birth for the foreign-born population - Zimbabwe (%)
Place of birth for the foreign-born population - Other Eastern Africa (%)
Place of birth for the foreign-born population - Cameroon (%)
Place of birth for the foreign-born population - Congo (%)
Place of birth for the foreign-born population - Democratic Republic of Congo (Zaire) (%)
Place of birth for the foreign-born population - Other Middle Africa (%)
Place of birth for the foreign-born population - Egypt (%)
Place of birth for the foreign-born population - Morocco (%)
Place of birth for the foreign-born population - Sudan (%)
Place of birth for the foreign-born population - Other Northern Africa (%)
Place of birth for the foreign-born population - South Africa (%)
Place of birth for the foreign-born population - Other Southern Africa (%)
Place of birth for the foreign-born population - Cabo Verde (%)
Place of birth for the foreign-born population - Ghana (%)
Place of birth for the foreign-born population - Liberia (%)
Place of birth for the foreign-born population - Nigeria (%)
Place of birth for the foreign-born population - Senegal (%)
Place of birth for the foreign-born population - Sierra Leone (%)
Place of birth for the foreign-born population - Other Western Africa (%)
Place of birth for the foreign-born population - Australia (%)
Place of birth for the foreign-born population - New Zealand (%)
Place of birth for the foreign-born population - Fiji (%)
Place of birth for the foreign-born population - Micronesia (%)
Place of birth for the foreign-born population - Bahamas (%)
Place of birth for the foreign-born population - Barbados (%)
Place of birth for the foreign-born population - Cuba (%)
Place of birth for the foreign-born population - Dominica (%)
Place of birth for the foreign-born population - Dominican Republic (%)
Place of birth for the foreign-born population - Grenada (%)
Place of birth for the foreign-born population - Haiti (%)
Place of birth for the foreign-born population - Jamaica (%)
Place of birth for the foreign-born population - St. Vincent and the Grenadines (%)
Place of birth for the foreign-born population - Trinidad and Tobago (%)
Place of birth for the foreign-born population - West Indies (%)
Place of birth for the foreign-born population - Other Caribbean (%)
Place of birth for the foreign-born population - Belize (%)
Place of birth for the foreign-born population - Costa Rica (%)
Place of birth for the foreign-born population - El Salvador (%)
Place of birth for the foreign-born population - Guatemala (%)
Place of birth for the foreign-born population - Honduras (%)
Place of birth for the foreign-born population - Mexico (%)
Place of birth for the foreign-born population - Nicaragua (%)
Place of birth for the foreign-born population - Panama (%)
Place of birth for the foreign-born population - Other Central America (%)
Place of birth for the foreign-born population - Argentina (%)
Place of birth for the foreign-born population - Bolivia (%)
Place of birth for the foreign-born population - Brazil (%)
Place of birth for the foreign-born population - Chile (%)
Place of birth for the foreign-born population - Colombia (%)
Place of birth for the foreign-born population - Ecuador (%)
Place of birth for the foreign-born population - Guyana (%)
Place of birth for the foreign-born population - Peru (%)
Place of birth for the foreign-born population - Uruguay (%)
Place of birth for the foreign-born population - Venezuela (%)
Place of birth for the foreign-born population - Other South America (%)
Place of birth for the foreign-born population - Canada (%)
Place of birth for the foreign-born population - Other Northern America (%)
Place of birth for the foreign-born population - Other (%)
Latest news about races in Decatur, IL collected exclusively by city-data.com from local newspapers, TV, and radio stations
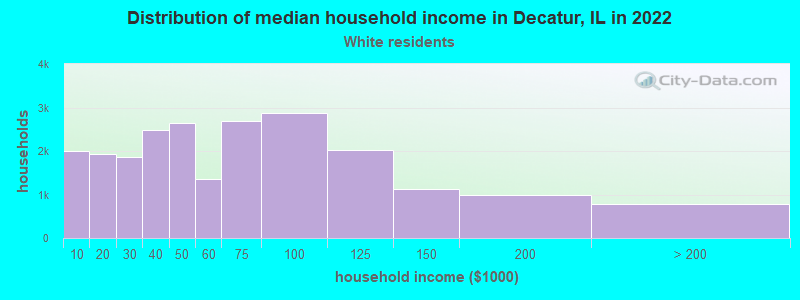
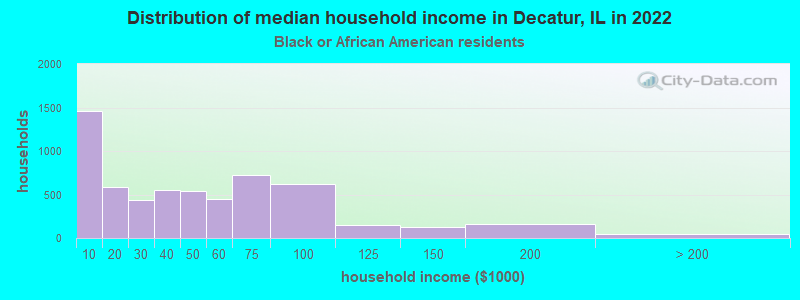
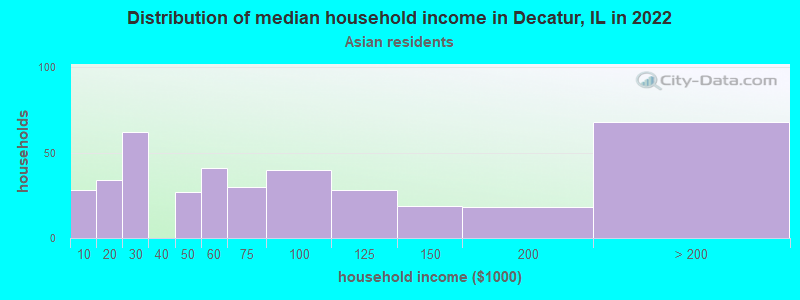
According to 2022 data, the most numerous races in Decatur, IL are White alone (46,311 residents), Hispanic (2,368 residents), and Black alone (16,456 residents). 94.8% of Decatur residents speak English at home. 2.8% of Decatur, IL residents are foreign-born (1.0% born in Latin America, 1.0% born in Asia, 0.4% born in Africa), which is 404.1% less than the foreign-born rate of 14.0% across the entire state of Illinois.
Race distribution in Decatur
2000 2022
8,424,140 67.8% White alone 1,856,152 14.9% Black alone 1,530,262 12.3% Hispanic 419,916 3.4% Asian alone 153,996 1.2% Two or more races 13,479 0.1% Other race alone 18,232 0.1% American Indian alone 3,116 0.03% Native Hawaiian and Other
7,356,301 58.5% White alone 2,299,726 18.3% Hispanic 1,660,423 13.2% Black alone 747,296 5.9% Asian alone 458,599 3.6% Two or more races 45,386 0.4% Other race alone 10,405 0.08% American Indian alone 3,896 0.03% Native Hawaiian and Other
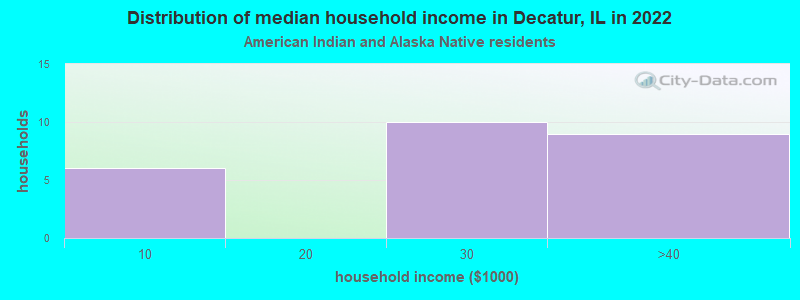
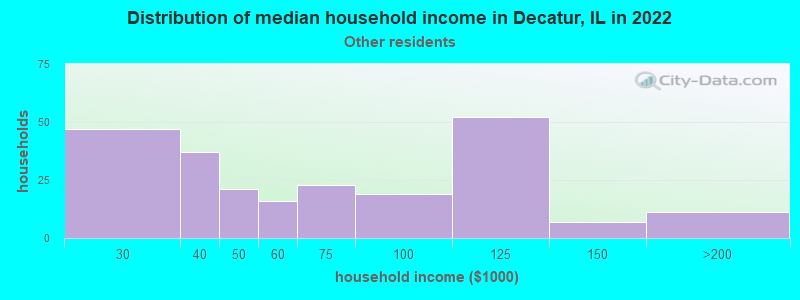
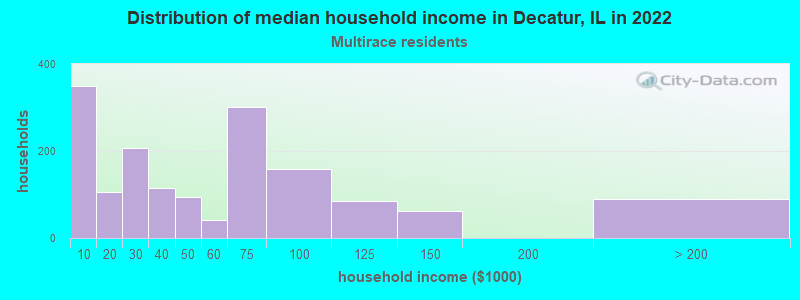
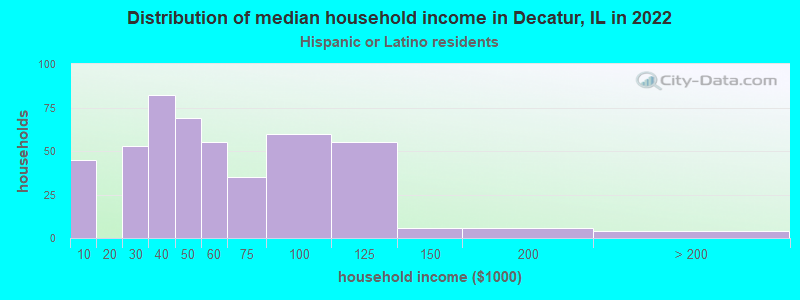
Income and house value in Decatur Median household income in 2022 $52,448 White non-Hispanic householders$37,339 Black householders$61,775 Asian householders$106,154 Some other race householders$41,787 Two or more races householders$83,220 Hispanic or Latino race householdersMedian 2022 house value $100,567 White Non-Hispanic householders$61,314 Black or African American householders$60,249 American Indian or Alaska Native householders $192,920 Asian householders$49,447 Native Hawaiian and other Pacific Islander householders$209,199 Some other race householders$70,138 Two or more races householders$82,766 Hispanic or Latino householders
Median age by race in Decatur
45.8 Median age for White residents44.5 46.5 29.9 Median age for Black or African American residents29.6 31.4 -666,666,666.0 Median age for American Indian / Alaska Native residents-666,666,666.0 -666,666,666.0 29.7 Median age for Asian residents-666,666,666.0 20.4 -666,666,666.0 Median age for Native Hawaiian / Pacific Islander residents-666,666,666.0 -666,666,666.0 48.1 Median age for Other race residents32.1 74.6 27.2 Median age for Two or more races residents22.3 29.4 46.3 Median age for White alone residents46.2 46.5 29.8 Median age for Hispanic or Latino residents24.0 37.3
Owner/renter occupied households by race in Decatur
House owners and renters - White residents 16,773 73.7% Owner occupied5,972 26.3% Renter occupiedHouse owners and renters - Black or African American residents 2,363 40.4% Owner occupied3,484 59.6% Renter occupiedHouse owners and renters - American Indian / Alaska Native residents 10 35.8% Owner occupied18 64.2% Renter occupiedHouse owners and renters - Asian residents 153 44.5% Owner occupied191 55.5% Renter occupiedHouse owners and renters - Native Hawaiian / Pacific Islander residents 50 100.0% Owner occupiedHouse owners and renters - Other race residents 168 68.0% Owner occupied79 32.0% Renter occupiedHouse owners and renters - Two or more races residents 1,449 77.0% Owner occupied434 23.0% Renter occupiedHouse owners and renters - White alone residents 16,658 74.2% Owner occupied5,781 25.8% Renter occupiedHouse owners and renters - Hispanic or Latino residents 272 37.7% Owner occupied449 62.3% Renter occupied
Language usage in Decatur
English speakers - Total 94.8% of residents of Decatur speak English at home.
2.4% of residents speak Spanish at home 1,339 83.2% Speak English very well271 16.8% Speak English less than very well2.2% of residents speak other language at home 1,152 77.9% Speak English very well327 22.1% Speak English less than very well
English speakers - Born in the United States 97.7% of residents of Decatur speak English at home.
1.5% of residents speak Spanish at home 191 95.5% Speak English very well9 4.5% Speak English less than very well0.3% of residents speak other language at home 22 50.0% Speak English very well22 50.0% Speak English less than very well
English speakers - Native, born elsewhere 73.1% of residents of Decatur speak English at home.
26.5% of residents speak Spanish at home 70 100.0% Speak English very well1.9% of residents speak other language at home 5 100.0% Speak English very well
English speakers - Foreign-born 19.3% of residents of Decatur speak English at home.
30.8% of residents speak Spanish at home 372 64.6% Speak English very well204 35.4% Speak English less than very well49.1% of residents speak other language at home 684 74.5% Speak English very well234 25.5% Speak English less than very well
White (Caucasian) - Speak only English Native:
99.9% (42,803)Foreign-born:
40.1% (125)
White (Caucasian) - Speak another language Native:
1.6% (701)Foreign-born:
62.6% (194)
Black or African American - Speak only English Native:
99.5% (14,623)Foreign-born:
4.2% (10)
Black or African American - Speak another language Native:
0.5% (72)Foreign-born:
91.6% (224)
American Indian / Alaska Native - Speak only English Native:
58.8% (25)Foreign-born:
71.3% (2)
Asian - Speak only English Native:
15.2% (41)Foreign-born:
13.2% (81)
Asian - Speak another language Native:
85.9% (232)Foreign-born:
86.5% (527)
Other race - Speak only English Native:
67.2% (233)Foreign-born:
3.6% (15)
Other race - Speak another language Native:
37.0% (128)Foreign-born:
96.4% (421)
Two or more races - Speak only English Native:
93.5% (3,982)Foreign-born:
53.5% (167)
Two or more races - Speak another language Native:
4.5% (193)Foreign-born:
44.0% (137)
White alone - Speak only English Native:
98.5% (42,919)Foreign-born:
43.5% (109)
White alone - Speak another language Native:
1.5% (636)Foreign-born:
54.2% (136)
Hispanic or Latino - Speak another language Native:
19.1% (223)Foreign-born:
100.0% (677)
Foreign-born residents in Decatur 1,932 residents are foreign born (1.0% Latin America , 1.0% Asia , 0.4% Africa ).
This city:
2.8%Illinois:
14.1%
Marital status for residents in Decatur Marital status - White (Caucasian) population 15 years and over
Males 35.9% Never married45.2% Now married0.6% Separated5.5% Widowed12.7% DivorcedFemales 31.6% Never married42.3% Now married2.0% Separated9.5% Widowed14.6% DivorcedWomen who gave birth in the past 12 months Now married:
47.8% (569)Unmarried:
52.2% (621)
Women who did not give birth in the past 12 months Now married:
34.5% (3,235)Unmarried:
65.5% (6,154)
Marital status - Black or African American population 15 years and over
Males 48.3% Never married35.3% Now married3.4% Separated2.9% Widowed10.1% DivorcedFemales 53.8% Never married28.6% Now married1.5% Separated7.5% Widowed8.6% DivorcedWomen who gave birth in the past 12 months Now married:
21.8% (92)Unmarried:
78.2% (329)
Women who did not give birth in the past 12 months Now married:
17.9% (686)Unmarried:
82.1% (3,156)
Marital status - American Indian / Alaska Native population 15 years and over
Males 37.5% Never married37.5% Now married0.0% Separated25.0% Widowed0.0% DivorcedFemales 100.0% Never married0.0% Now married0.0% Separated0.0% Widowed0.0% DivorcedMarital status - Asian population 15 years and over
Males 62.5% Never married37.5% Now married0.0% Separated0.0% Widowed0.0% DivorcedFemales 48.3% Never married39.2% Now married0.0% Separated6.2% Widowed6.2% DivorcedWomen who gave birth in the past 12 months Now married:
100.0% (32)Unmarried:
0.0% (0)
Women who did not give birth in the past 12 months Now married:
18.5% (50)Unmarried:
81.5% (222)
Marital status - Native Hawaiian / Pacific Islander population 15 years and over
Males 100.0% Never married0.0% Now married0.0% Separated0.0% Widowed0.0% DivorcedFemales 25.0% Never married0.0% Now married0.0% Separated0.0% Widowed75.0% DivorcedWomen who did not give birth in the past 12 months Now married:
0.0% (0)Unmarried:
100.0% (18)
Marital status - Other race population 15 years and over
Males 41.5% Never married58.5% Now married0.0% Separated0.0% Widowed0.0% DivorcedFemales 54.2% Never married36.6% Now married0.0% Separated1.5% Widowed7.7% DivorcedWomen who did not give birth in the past 12 months Now married:
40.0% (100)Unmarried:
60.0% (150)
Marital status - Two or more races population 15 years and over
Males 70.5% Never married16.4% Now married0.0% Separated9.8% Widowed3.3% DivorcedFemales 45.3% Never married30.8% Now married0.0% Separated8.9% Widowed15.0% DivorcedWomen who gave birth in the past 12 months Now married:
34.8% (58)Unmarried:
65.2% (109)
Women who did not give birth in the past 12 months Now married:
24.0% (202)Unmarried:
76.0% (639)
Marital status - White alone, not Hispanic / Latino population 15 years and over
Males 35.6% Never married45.6% Now married0.6% Separated5.6% Widowed12.6% DivorcedFemales 31.6% Never married41.9% Now married2.0% Separated9.7% Widowed14.8% DivorcedWomen who gave birth in the past 12 months Now married:
47.8% (569)Unmarried:
52.2% (621)
Women who did not give birth in the past 12 months Now married:
33.6% (3,055)Unmarried:
66.4% (6,040)
Marital status - Hispanic or Latino population 15 years and over
Males 37.9% Never married57.1% Now married0.0% Separated0.0% Widowed5.1% DivorcedFemales 46.5% Never married38.5% Now married0.0% Separated9.6% Widowed5.5% DivorcedWomen who gave birth in the past 12 months Now married:
100.0% (35)Unmarried:
0.0% (0)
Women who did not give birth in the past 12 months Now married:
44.1% (223)Unmarried:
55.9% (283)
Ancestries in Decatur
4,333 12.8% German4,031 11.9% American3,587 10.6% English1,859 5.5% Irish474 1.4% European428 1.3% Italian376 1.1% Scottish353 1.0% African298 0.9% Polish262 0.8% French212 0.6% Scotch-Irish188 0.6% Dutch123 0.4% British123 0.4% Norwegian114 0.3% Nigerian79 0.2% Greek75 0.2% Zimbabwean66 0.2% Eastern European63 0.2% Lebanese60 0.2% Swedish41 0.1% Swiss41 0.1% Welsh38 0.1% Arab32 0.09% Austrian32 0.09% Portuguese31 0.09% Ukrainian30 0.09% Czech25 0.07% Albanian21 0.06% Belgian20 0.06% Hungarian18 0.05% Latvian18 0.05% Somali14 0.04% Scandinavian14 0.04% Serbian13 0.04% Pennsylvania German12 0.04% Northern European12 0.04% French Canadian11 0.03% Canadian10 0.03% Russian9 0.03% Czechoslovakian9 0.03% Croatian8 0.02% New Zealander8 0.02% Danish4 0.01% Turkish
Geographical mobility in Decatur Same house 1 year ago 41,145 88.3% White (Caucasian)11,639 72.5% Black or African American39 83.1% American Indian / Alaska Native546 58.0% Asian61 83.5% Native Hawaiian / Pacific Islander670 85.6% Other race3,691 74.8% Two or more races40,590 88.9% White alone, not Hispanic / Latino1,471 67.4% Hispanic or LatinoMoved within same county 3,981 8.5% White / Caucasian3,965 24.7% Black or African American52 5.5% Asian62 7.9% Other race1,162 23.6% Two or more races3,611 7.9% White alone, not Hispanic / Latino640 29.3% Hispanic or LatinoMoved within same state 853 1.8% White / Caucasian430 2.7% Black or African American9 18.3% American Indian / Alaska Native35 3.7% Asian3 4.6% Native Hawaiian / Pacific Islander19 2.5% Other race80 1.6% Two or more races824 1.8% White alone, not Hispanic / Latino73 3.3% Hispanic or LatinoMoved from different state 639 1.4% White / Caucasian278 1.7% Black or African American106 11.3% Asian10 13.0% Native Hawaiian / Pacific Islander30 3.8% Other race639 1.4% White alone, not Hispanic / LatinoMoved from abroad 57 0.4% Black or African American209 22.2% Asian
Children Nativity (place of birth) in Decatur
Children under 6 years - Living with two parents Both parents native 2,218 100.0% NativeBoth parents foreign-born 78 56.9% Native59 43.1% Foreign-bornOne native, one foreign-born parent 97 100.0% NativeChildren under 6 years - Living with one parent Native parent 2,153 100.0% NativeForeign-born parent 21 100.0% NativeChildren 6 to 17 years - Living with two parents Both parents native 4,390 100.0% NativeBoth parents foreign-born 235 72.2% Native90 27.8% Foreign-bornOne native, one foreign-born parent 154 100.0% NativeChildren 6 to 17 years - Living with one parent Native parent 3,735 100.0% NativeForeign-born parent 56 49.8% Native56 50.2% Foreign-born
Grandparents responsible for own grandchildren in Decatur
Grandparents (30 to 59 years) White / Caucasian 245 64.3% Responsible for grandchildren136 35.7% Not responsible for grandchildrenBlack or African American 65 59.4% Responsible for grandchildren45 40.6% Not responsible for grandchildrenTwo or more races 3 8.2% Responsible for grandchildren38 91.8% Not responsible for grandchildrenWhite alone, not Hispanic / Latino 245 64.3% Responsible for grandchildren136 35.7% Not responsible for grandchildrenGrandparents (60 years and over) White / Caucasian 139 40.1% Responsible for grandchildren207 59.9% Not responsible for grandchildrenBlack or African American 102 58.2% Responsible for grandchildren73 41.8% Not responsible for grandchildrenTwo or more races 5 75.5% Responsible for grandchildren2 24.5% Not responsible for grandchildrenWhite alone, not Hispanic / Latino 112 35.2% Responsible for grandchildren207 64.8% Not responsible for grandchildren