Races in Defiance, Ohio (OH) Detailed Stats
Ancestries, Foreign-born residents, place of birth
Settings
X


Recent posts about races in Defiance, Ohio on our local forum with over 2,400,000 registered users:
 | Gay Life in Northwest Ohio (19 replies) |
| NW Ohio stuck in the '70s? - no smart growth, no master planning (30 replies) |
| Moving to Toledo, Ohio??? (21 replies) |
Latest news about races in Defiance, OH collected exclusively by city-data.com from local newspapers, TV, and radio stations
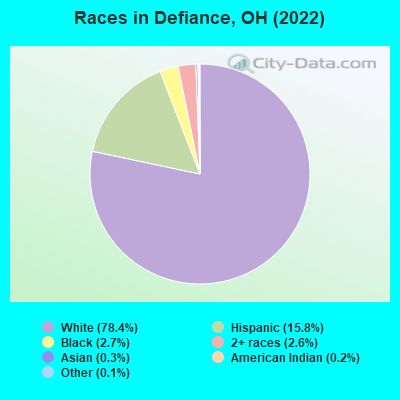
According to 2022 data, the most numerous races in Defiance, OH are White alone (13,185 residents), Black alone (454 residents), and Two or more races (443 residents). 92.6% of Defiance residents speak English at home. 2.3% of Defiance, OH residents are foreign-born (1.4% born in Latin America, 0.3% born in Europe), which is 75.3% less than the foreign-born rate of 4.0% across the entire state of Ohio.
Race distribution in Defiance
2000
2022

- 13,55782.3%White alone
- 2,10012.8%Hispanic
- 5323.2%Black alone
- 1711.0%Two or more races
- 600.4%Asian alone
- 380.2%American Indian alone
- 50.03%Other race alone
- 20.01%Native Hawaiian and Other
Pacific Islander alone

-
- 13,18578.4%White alone
- 2,65015.8%Hispanic
- 4542.7%Black alone
- 4432.6%Two or more races
- 430.3%Asian alone
- 340.2%American Indian alone
- 250.1%Other race alone
- 50.03%Native Hawaiian and Other
Pacific Islander alone
2000
2022
-
- 9,538,11184.0%White alone
- 1,290,66211.4%Black alone
- 217,1231.9%Hispanic
- 137,7701.2%Two or more races
- 131,6701.2%Asian alone
- 21,9850.2%American Indian alone
- 13,4830.1%Other race alone
- 2,3360.02%Native Hawaiian and Other
Pacific Islander alone

-
- 8,948,79376.1%White alone
- 1,401,40311.9%Black alone
- 529,2914.5%Two or more races
- 517,2324.4%Hispanic
- 293,3872.5%Asian alone
- 52,8050.4%Other race alone
- 9,7850.08%American Indian alone
- 3,3620.03%Native Hawaiian and Other
Pacific Islander alone

Income and house value in Defiance
- Median household income in 2022
- $60,357White non-Hispanic householders
- $37,034Some other race householders
- $81,981Two or more races householders
- $61,434Hispanic or Latino race householders
- Median 2022 house value
- $160,160White Non-Hispanic householders
- $172,158Black or African American householders
- $214,245American Indian or Alaska Native householders
- $361,075Asian householders
- $143,973Some other race householders
- $122,834Two or more races householders
- $131,594Hispanic or Latino householders
Household income for White non-Hispanic householders

Household income for Black householders

Household income for American Indian and Alaska Native householders

Household income for Asian householders

Household income for Some other race householders

Household income for Two or more races householders

Household income for Hispanic or Latino race householders

Median age by race in Defiance
- 43.9Median age for White residents
- 43.0Males
- 44.5Females
- 26.3Median age for Black or African American residents
- 33.4Males
- 25.7Females
- 49.5Median age for American Indian / Alaska Native residents
- -685,185,184.5Males
- 16.7Females
- 61.5Median age for Asian residents
- -674,486,802.8Males
- 61.7Females
- -800,387,596.1Median age for Native Hawaiian / Pacific Islander residents
- -750,242,953.6Males
- -805,394,989.6Females
- 37.8Median age for Other race residents
- 53.2Males
- 22.5Females
- 27.1Median age for Two or more races residents
- 31.0Males
- 23.6Females
- 44.2Median age for White alone residents
- 43.6Males
- 45.3Females
- 28.1Median age for Hispanic or Latino residents
- 28.3Males
- 22.5Females
Owner/renter occupied households by race in Defiance
- House owners and renters - White residents
- 4,48271.0%Owner occupied
- 1,83529.0%Renter occupied
- House owners and renters - Black or African American residents
- 9837.2%Owner occupied
- 16662.8%Renter occupied
- House owners and renters - American Indian / Alaska Native residents
- 1032.2%Owner occupied
- 2167.8%Renter occupied
- House owners and renters - Asian residents
- 540.1%Owner occupied
- 859.9%Renter occupied
- House owners and renters - Other race residents
- 14351.3%Owner occupied
- 13648.7%Renter occupied
- House owners and renters - Two or more races residents
- 34459.7%Owner occupied
- 23240.3%Renter occupied
- House owners and renters - White alone residents
- 4,33571.7%Owner occupied
- 1,71028.3%Renter occupied
- House owners and renters - Hispanic or Latino residents
- 47055.0%Owner occupied
- 38545.0%Renter occupied
Language usage in Defiance
- English speakers - Total
- 92.6% of residents of Defiance speak English at home.
- 6.3% of residents speak Spanish at home
- 63463.7%Speak English very well
- 36136.3%Speak English less than very well
- 1.1% of residents speak other language at home
- 15489.5%Speak English very well
- 1810.5%Speak English less than very well
- English speakers - Born in the United States
- 90.0% of residents of Defiance speak English at home.
- 8.0% of residents speak Spanish at home
- 23585.1%Speak English very well
- 4114.9%Speak English less than very well
- 2.3% of residents speak other language at home
- 78100.0%Speak English very well
- English speakers - Native, born elsewhere
- 24.4% of residents of Defiance speak English at home.
- 74.0% of residents speak Spanish at home
- 4243.3%Speak English very well
- 5556.7%Speak English less than very well
- English speakers - Foreign-born
- 24.4% of residents of Defiance speak English at home.
- 63.4% of residents speak Spanish at home
- 8233.6%Speak English very well
- 16266.4%Speak English less than very well
- 13.8% of residents speak other language at home
- 3667.9%Speak English very well
- 1732.1%Speak English less than very well
White (Caucasian) - Speak only English
| Native: | 97.1% (12,623) |
| Foreign-born: | 61.6% (76) |
White (Caucasian) - Speak another language
| Native: | 2.9% (375) |
| Foreign-born: | 41.9% (52) |
Asian - Speak only English
| Native: | 19.3% (6) |
| Foreign-born: | 35.7% (12) |
Asian - Speak another language
| Native: | 78.4% (26) |
| Foreign-born: | 62.1% (20) |
Other race - Speak another language
| Native: | 48.0% (337) |
| Foreign-born: | 100.0% (81) |
Two or more races - Speak another language
| Native: | 13.5% (187) |
| Foreign-born: | 100.0% (155) |
White alone - Speak only English
| Native: | 98.1% (12,240) |
| Foreign-born: | 89.6% (78) |
White alone - Speak another language
| Native: | 1.9% (233) |
| Foreign-born: | 11.7% (10) |
Hispanic or Latino - Speak another language
| Native: | 30.2% (655) |
| Foreign-born: | 100.0% (242) |
Foreign-born residents in Defiance
384 residents are foreign born (1.4% Latin America, 0.3% Europe).
| This city: | 2.3% |
| Ohio: | 4.9% |


Marital status for residents in Defiance
Marital status - White (Caucasian) population 15 years and over
- Males
- 36.7%Never married
- 48.4%Now married
- 3.0%Separated
- 3.6%Widowed
- 8.2%Divorced
- Females
- 25.3%Never married
- 50.2%Now married
- 2.5%Separated
- 8.5%Widowed
- 13.5%Divorced
Women who gave birth in the past 12 months
| Now married: | 69.4% (98) |
| Unmarried: | 30.6% (43) |
Women who did not give birth in the past 12 months
| Now married: | 43.5% (1,278) |
| Unmarried: | 56.5% (1,660) |
Marital status - Black or African American population 15 years and over
- Males
- 56.6%Never married
- 28.3%Now married
- 8.1%Separated
- 3.0%Widowed
- 3.9%Divorced
- Females
- 36.0%Never married
- 64.0%Now married
- 0.0%Separated
- 0.0%Widowed
- 0.0%Divorced
Women who gave birth in the past 12 months
| Now married: | 100.0% (78) |
| Unmarried: | 0.0% (0) |
Women who did not give birth in the past 12 months
| Now married: | 0.0% (0) |
| Unmarried: | 100.0% (38) |
Marital status - American Indian / Alaska Native population 15 years and over
- Males
- 0.0%Never married
- 0.0%Now married
- 0.0%Separated
- 46.7%Widowed
- 53.3%Divorced
- Females
- 54.1%Never married
- 21.6%Now married
- 0.0%Separated
- 0.0%Widowed
- 24.3%Divorced
Women who did not give birth in the past 12 months
| Now married: | 0.0% (0) |
| Unmarried: | 100.0% (35) |
Marital status - Asian population 15 years and over
- Males
- 50.0%Never married
- 50.0%Now married
- 0.0%Separated
- 0.0%Widowed
- 0.0%Divorced
- Females
- 19.1%Never married
- 36.2%Now married
- 0.0%Separated
- 0.0%Widowed
- 44.7%Divorced
Women who did not give birth in the past 12 months
| Now married: | 0.0% (0) |
| Unmarried: | 100.0% (9) |
Marital status - Other race population 15 years and over
- Males
- 12.6%Never married
- 72.1%Now married
- 0.0%Separated
- 0.0%Widowed
- 15.3%Divorced
- Females
- 35.0%Never married
- 33.3%Now married
- 0.0%Separated
- 3.0%Widowed
- 28.6%Divorced
Women who did not give birth in the past 12 months
| Now married: | 8.2% (17) |
| Unmarried: | 91.8% (193) |
Marital status - Two or more races population 15 years and over
- Males
- 52.2%Never married
- 30.1%Now married
- 1.0%Separated
- 1.3%Widowed
- 15.4%Divorced
- Females
- 44.3%Never married
- 32.6%Now married
- 5.5%Separated
- 2.9%Widowed
- 14.8%Divorced
Women who did not give birth in the past 12 months
| Now married: | 33.8% (132) |
| Unmarried: | 66.2% (259) |
Marital status - White alone, not Hispanic / Latino population 15 years and over
- Males
- 36.7%Never married
- 47.7%Now married
- 3.1%Separated
- 3.8%Widowed
- 8.6%Divorced
- Females
- 24.8%Never married
- 50.5%Now married
- 2.6%Separated
- 8.8%Widowed
- 13.4%Divorced
Women who gave birth in the past 12 months
| Now married: | 69.4% (99) |
| Unmarried: | 30.6% (44) |
Women who did not give birth in the past 12 months
| Now married: | 43.7% (1,204) |
| Unmarried: | 56.3% (1,550) |
Marital status - Hispanic or Latino population 15 years and over
- Males
- 38.3%Never married
- 47.8%Now married
- 1.4%Separated
- 0.7%Widowed
- 11.8%Divorced
- Females
- 41.3%Never married
- 37.1%Now married
- 0.0%Separated
- 3.2%Widowed
- 18.4%Divorced
Women who did not give birth in the past 12 months
| Now married: | 28.4% (181) |
| Unmarried: | 71.6% (457) |
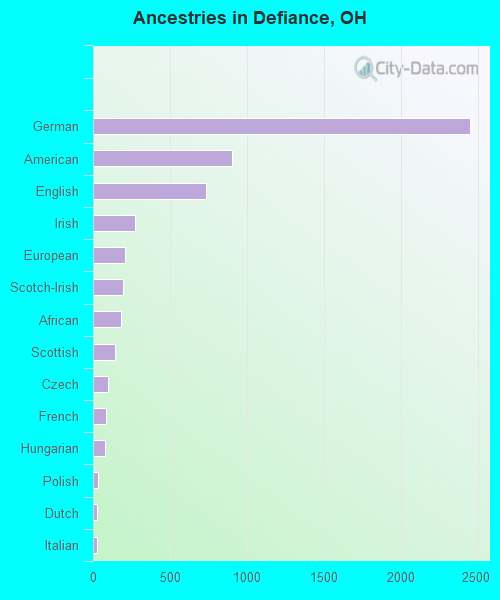
Ancestries in Defiance

- 2,45231.6%German
- 90611.7%American
- 7339.5%English
- 2763.6%Irish
- 2072.7%European
- 1932.5%Scotch-Irish
- 1792.3%African
- 1461.9%Scottish
- 951.2%Czech
- 831.1%French
- 771.0%Hungarian
- 330.4%Polish
- 260.3%Dutch
- 250.3%Italian
- 220.3%Welsh
- 170.2%Norwegian
- 140.2%Scandinavian
- 110.1%Slovak
- 90.1%British
- 90.1%Greek
- 80.1%Eastern European
- 70.09%Swedish
- 60.08%Swiss
Geographical mobility in Defiance

- Same house 1 year ago
- 12,22089.5%White (Caucasian)
- 44479.6%Black or African American
- 4265.4%American Indian / Alaska Native
- 6192.3%Asian
- 56972.9%Other race
- 1,33275.0%Two or more races
- 11,69389.4%White alone, not Hispanic / Latino
- 1,99977.7%Hispanic or Latino

-
- Moved within same county
- 6304.6%White / Caucasian
- 285.1%Black or African American
- 1422.2%American Indian / Alaska Native
- 69.0%Asian
- 14418.5%Other race
- 28215.9%Two or more races
- 6064.6%White alone, not Hispanic / Latino
- 37414.5%Hispanic or Latino

-
- Moved within same state
- 6044.4%White / Caucasian
- 81.4%Black or African American
- 7100.0%Native Hawaiian / Pacific Islander
- 212.7%Other race
- 100.5%Two or more races
- 6024.6%White alone, not Hispanic / Latino
- 160.6%Hispanic or Latino

-
- Moved from different state
- 2341.7%White / Caucasian
- 9016.1%Black or African American
- 243.1%Other race
- 1196.7%Two or more races
- 2051.6%White alone, not Hispanic / Latino
- 1224.7%Hispanic or Latino

-
- Moved from abroad
- 70.0%White
- 70.1%White alone, not Hispanic / Latino

Children Nativity (place of birth) in Defiance
Place of birth for residents in Defiance
![Place of birth for the foreign-born population - Regions]()
- 273Americas
- 234Latin America
- 173Central America
- 56Europe
- 48Western Europe
- 38Northern America
- 32Caribbean
- 31Asia
- 28South America
- 23Africa
- 23Eastern Africa
- 12South Eastern Asia
- 10South Central Asia
- 9Eastern Asia
- 8Eastern Europe

![Place of birth for the foreign-born population - Countries]()
- 162Mexico
- 38Canada
- 37Germany
- 32Dominican Republic
- 28Venezuela
- 15Eritrea
- 12Philippines
- 10France
- 10India
- 10Costa Rica
- 9Japan
- 8Croatia
- 8Ethiopia

Grandparents responsible for own grandchildren in Defiance
Zip codes: 43512.