Races in Delaware, Ohio (OH) Detailed Stats
Data:
Races - White alone (%)
Races - White alone (% change since 2000)
Races - Black alone (%)
Races - Black alone (% change since 2000)
Races - American Indian alone (%)
Races - American Indian alone (% change since 2000)
Races - Asian alone (%)
Races - Asian alone (% change since 2000)
Races - Hispanic (%)
Races - Hispanic (% change since 2000)
Races - Native Hawaiian and Other Pacific Islander alone (%)
Races - Native Hawaiian and Other Pacific Islander alone (% change since 2000)
Races - Two or more races(%)
Races - Two or more races(% change since 2000)
Races - Other race alone (%)
Races - Other race alone (% change since 2000)
Racial diversity
Place of birth - Born in state of residence (%)
Place of birth - Born in state of residence (%) - White
Place of birth - Born in state of residence (%) - Black or African American
Place of birth - Born in state of residence (%) - Asian
Place of birth - Born in state of residence (%) - Hispanic or Latino
Place of birth - Born in state of residence (%) - American Indian and Alaska Native
Place of birth - Born in state of residence (%) - Multirace
Place of birth - Born in state of residence (%) - Other Race
Place of birth - Born in other state (%)
Place of birth - Born in other state (%) - White
Place of birth - Born in other state (%) - Black or African American
Place of birth - Born in other state (%) - Asian
Place of birth - Born in other state (%) - Hispanic or Latino
Place of birth - Born in other state (%) - American Indian and Alaska Native
Place of birth - Born in other state (%) - Multirace
Place of birth - Born in other state (%) - Other Race
Place of birth - Native, outside of US (%)
Place of birth - Native, outside of US (%) - White
Place of birth - Native, outside of US (%) - Black or African American
Place of birth - Native, outside of US (%) - Asian
Place of birth - Native, outside of US (%) - Hispanic or Latino
Place of birth - Native, outside of US (%) - American Indian and Alaska Native
Place of birth - Native, outside of US (%) - Multirace
Place of birth - Native, outside of US (%) - Other Race
Place of birth - Foreign born (%)
Place of birth - Foreign born (%) - White
Place of birth - Foreign born (%) - Black or African American
Place of birth - Foreign born (%) - Asian
Place of birth - Foreign born (%) - Hispanic or Latino
Place of birth - Foreign born (%) - American Indian and Alaska Native
Place of birth - Foreign born (%) - Multirace
Place of birth - Foreign born (%) - Other Race
Residents speaking English at home (%)
Residents speaking English at home - Born in the United States (%)
Residents speaking English at home - Native, born elsewhere (%)
Residents speaking English at home - Foreign born (%)
Residents speaking Spanish at home (%)
Residents speaking Spanish at home - Born in the United States (%)
Residents speaking Spanish at home - Native, born elsewhere (%)
Residents speaking Spanish at home - Foreign born (%)
Residents speaking other language at home (%)
Residents speaking other language at home - Born in the United States (%)
Residents speaking other language at home - Native, born elsewhere (%)
Residents speaking other language at home - Foreign born (%)
Marital status - Never married (%)
Marital status - Now married (%)
Marital status - Separated (%)
Marital status - Widowed (%)
Marital status - Divorced (%)
Ancestries Reported - Arab (%)
Ancestries Reported - Czech (%)
Ancestries Reported - Danish (%)
Ancestries Reported - Dutch (%)
Ancestries Reported - English (%)
Ancestries Reported - French (%)
Ancestries Reported - French Canadian (%)
Ancestries Reported - German (%)
Ancestries Reported - Greek (%)
Ancestries Reported - Hungarian (%)
Ancestries Reported - Irish (%)
Ancestries Reported - Italian (%)
Ancestries Reported - Lithuanian (%)
Ancestries Reported - Norwegian (%)
Ancestries Reported - Polish (%)
Ancestries Reported - Portuguese (%)
Ancestries Reported - Russian (%)
Ancestries Reported - Scotch-Irish (%)
Ancestries Reported - Scottish (%)
Ancestries Reported - Slovak (%)
Ancestries Reported - Subsaharan African (%)
Ancestries Reported - Swedish (%)
Ancestries Reported - Swiss (%)
Ancestries Reported - Ukrainian (%)
Ancestries Reported - United States (%)
Ancestries Reported - Welsh (%)
Ancestries Reported - West Indian (%)
Ancestries Reported - Other (%)
Geographical mobility - Same house 1 year ago (%)
Geographical mobility - Same house 1 year ago (%) - White
Geographical mobility - Same house 1 year ago (%) - Black or African American
Geographical mobility - Same house 1 year ago (%) - Asian
Geographical mobility - Same house 1 year ago (%) - Hispanic or Latino
Geographical mobility - Same house 1 year ago (%) - American Indian and Alaska Native
Geographical mobility - Same house 1 year ago (%) - Multirace
Geographical mobility - Same house 1 year ago (%) - Other Race
Geographical mobility - Moved within same county (%)
Geographical mobility - Moved within same county (%) - White
Geographical mobility - Moved within same county (%) - Black or African American
Geographical mobility - Moved within same county (%) - Asian
Geographical mobility - Moved within same county (%) - Hispanic or Latino
Geographical mobility - Moved within same county (%) - American Indian and Alaska Native
Geographical mobility - Moved within same county (%) - Multirace
Geographical mobility - Moved within same county (%) - Other Race
Geographical mobility - Moved from different county within same state (%)
Geographical mobility - Moved from different county within same state (%) - White
Geographical mobility - Moved from different county within same state (%) - Black or African American
Geographical mobility - Moved from different county within same state (%) - Asian
Geographical mobility - Moved from different county within same state (%) - Hispanic or Latino
Geographical mobility - Moved from different county within same state (%) - American Indian and Alaska Native
Geographical mobility - Moved from different county within same state (%) - Multirace
Geographical mobility - Moved from different county within same state (%) - Other Race
Geographical mobility - Moved from different state (%)
Geographical mobility - Moved from different state (%) - White
Geographical mobility - Moved from different state (%) - Black or African American
Geographical mobility - Moved from different state (%) - Asian
Geographical mobility - Moved from different state (%) - Hispanic or Latino
Geographical mobility - Moved from different state (%) - American Indian and Alaska Native
Geographical mobility - Moved from different state (%) - Multirace
Geographical mobility - Moved from different state (%) - Other Race
Geographical mobility - Moved from abroad (%)
Geographical mobility - Moved from abroad (%) - White
Geographical mobility - Moved from abroad (%) - Black or African American
Geographical mobility - Moved from abroad (%) - Asian
Geographical mobility - Moved from abroad (%) - Hispanic or Latino
Geographical mobility - Moved from abroad (%) - American Indian and Alaska Native
Geographical mobility - Moved from abroad (%) - Multirace
Geographical mobility - Moved from abroad (%) - Other Race
Place of birth for the foreign-born population - Ireland (%)
Place of birth for the foreign-born population - Denmark (%)
Place of birth for the foreign-born population - Norway (%)
Place of birth for the foreign-born population - Sweden (%)
Place of birth for the foreign-born population - United Kingdom (%)
Place of birth for the foreign-born population - England (%)
Place of birth for the foreign-born population - Scotland (%)
Place of birth for the foreign-born population - Other Northern Europe (%)
Place of birth for the foreign-born population - Austria (%)
Place of birth for the foreign-born population - Belgium (%)
Place of birth for the foreign-born population - France (%)
Place of birth for the foreign-born population - Germany (%)
Place of birth for the foreign-born population - Netherlands (%)
Place of birth for the foreign-born population - Switzerland (%)
Place of birth for the foreign-born population - Other Western Europe (%)
Place of birth for the foreign-born population - Greece (%)
Place of birth for the foreign-born population - Italy (%)
Place of birth for the foreign-born population - Portugal (%)
Place of birth for the foreign-born population - Spain (%)
Place of birth for the foreign-born population - Other Southern Europe (%)
Place of birth for the foreign-born population - Albania (%)
Place of birth for the foreign-born population - Belarus (%)
Place of birth for the foreign-born population - Bosnia and Herzegovina (%)
Place of birth for the foreign-born population - Bulgaria (%)
Place of birth for the foreign-born population - Croatia (%)
Place of birth for the foreign-born population - Czechoslovakia (%)
Place of birth for the foreign-born population - Hungary (%)
Place of birth for the foreign-born population - Latvia (%)
Place of birth for the foreign-born population - Lithuania (%)
Place of birth for the foreign-born population - North Macedonia (Macedonia) (%)
Place of birth for the foreign-born population - Moldova (%)
Place of birth for the foreign-born population - Poland (%)
Place of birth for the foreign-born population - Romania (%)
Place of birth for the foreign-born population - Russia (%)
Place of birth for the foreign-born population - Serbia (%)
Place of birth for the foreign-born population - Ukraine (%)
Place of birth for the foreign-born population - Other Eastern Europe (%)
Place of birth for the foreign-born population - China (%)
Place of birth for the foreign-born population - Hong Kong (%)
Place of birth for the foreign-born population - Taiwan (%)
Place of birth for the foreign-born population - Japan (%)
Place of birth for the foreign-born population - Korea (%)
Place of birth for the foreign-born population - Other Eastern Asia (%)
Place of birth for the foreign-born population - Afghanistan (%)
Place of birth for the foreign-born population - Bangladesh (%)
Place of birth for the foreign-born population - India (%)
Place of birth for the foreign-born population - Iran (%)
Place of birth for the foreign-born population - Kazakhstan (%)
Place of birth for the foreign-born population - Nepal (%)
Place of birth for the foreign-born population - Pakistan (%)
Place of birth for the foreign-born population - Sri Lanka (%)
Place of birth for the foreign-born population - Uzbekistan (%)
Place of birth for the foreign-born population - Other South Central Asia (%)
Place of birth for the foreign-born population - Burma (%)
Place of birth for the foreign-born population - Cambodia (%)
Place of birth for the foreign-born population - Indonesia (%)
Place of birth for the foreign-born population - Laos (%)
Place of birth for the foreign-born population - Malaysia (%)
Place of birth for the foreign-born population - Philippines (%)
Place of birth for the foreign-born population - Singapore (%)
Place of birth for the foreign-born population - Thailand (%)
Place of birth for the foreign-born population - Vietnam (%)
Place of birth for the foreign-born population - Other South Eastern Asia (%)
Place of birth for the foreign-born population - Armenia (%)
Place of birth for the foreign-born population - Iraq (%)
Place of birth for the foreign-born population - Israel (%)
Place of birth for the foreign-born population - Jordan (%)
Place of birth for the foreign-born population - Kuwait (%)
Place of birth for the foreign-born population - Lebanon (%)
Place of birth for the foreign-born population - Saudi Arabia (%)
Place of birth for the foreign-born population - Syria (%)
Place of birth for the foreign-born population - Turkey (%)
Place of birth for the foreign-born population - Yemen (%)
Place of birth for the foreign-born population - Other Western Asia (%)
Place of birth for the foreign-born population - Eritrea (%)
Place of birth for the foreign-born population - Ethiopia (%)
Place of birth for the foreign-born population - Kenya (%)
Place of birth for the foreign-born population - Somalia (%)
Place of birth for the foreign-born population - Uganda (%)
Place of birth for the foreign-born population - Zimbabwe (%)
Place of birth for the foreign-born population - Other Eastern Africa (%)
Place of birth for the foreign-born population - Cameroon (%)
Place of birth for the foreign-born population - Congo (%)
Place of birth for the foreign-born population - Democratic Republic of Congo (Zaire) (%)
Place of birth for the foreign-born population - Other Middle Africa (%)
Place of birth for the foreign-born population - Egypt (%)
Place of birth for the foreign-born population - Morocco (%)
Place of birth for the foreign-born population - Sudan (%)
Place of birth for the foreign-born population - Other Northern Africa (%)
Place of birth for the foreign-born population - South Africa (%)
Place of birth for the foreign-born population - Other Southern Africa (%)
Place of birth for the foreign-born population - Cabo Verde (%)
Place of birth for the foreign-born population - Ghana (%)
Place of birth for the foreign-born population - Liberia (%)
Place of birth for the foreign-born population - Nigeria (%)
Place of birth for the foreign-born population - Senegal (%)
Place of birth for the foreign-born population - Sierra Leone (%)
Place of birth for the foreign-born population - Other Western Africa (%)
Place of birth for the foreign-born population - Australia (%)
Place of birth for the foreign-born population - New Zealand (%)
Place of birth for the foreign-born population - Fiji (%)
Place of birth for the foreign-born population - Micronesia (%)
Place of birth for the foreign-born population - Bahamas (%)
Place of birth for the foreign-born population - Barbados (%)
Place of birth for the foreign-born population - Cuba (%)
Place of birth for the foreign-born population - Dominica (%)
Place of birth for the foreign-born population - Dominican Republic (%)
Place of birth for the foreign-born population - Grenada (%)
Place of birth for the foreign-born population - Haiti (%)
Place of birth for the foreign-born population - Jamaica (%)
Place of birth for the foreign-born population - St. Vincent and the Grenadines (%)
Place of birth for the foreign-born population - Trinidad and Tobago (%)
Place of birth for the foreign-born population - West Indies (%)
Place of birth for the foreign-born population - Other Caribbean (%)
Place of birth for the foreign-born population - Belize (%)
Place of birth for the foreign-born population - Costa Rica (%)
Place of birth for the foreign-born population - El Salvador (%)
Place of birth for the foreign-born population - Guatemala (%)
Place of birth for the foreign-born population - Honduras (%)
Place of birth for the foreign-born population - Mexico (%)
Place of birth for the foreign-born population - Nicaragua (%)
Place of birth for the foreign-born population - Panama (%)
Place of birth for the foreign-born population - Other Central America (%)
Place of birth for the foreign-born population - Argentina (%)
Place of birth for the foreign-born population - Bolivia (%)
Place of birth for the foreign-born population - Brazil (%)
Place of birth for the foreign-born population - Chile (%)
Place of birth for the foreign-born population - Colombia (%)
Place of birth for the foreign-born population - Ecuador (%)
Place of birth for the foreign-born population - Guyana (%)
Place of birth for the foreign-born population - Peru (%)
Place of birth for the foreign-born population - Uruguay (%)
Place of birth for the foreign-born population - Venezuela (%)
Place of birth for the foreign-born population - Other South America (%)
Place of birth for the foreign-born population - Canada (%)
Place of birth for the foreign-born population - Other Northern America (%)
Place of birth for the foreign-born population - Other (%)
Latest news about races in Delaware, OH collected exclusively by city-data.com from local newspapers, TV, and radio stations
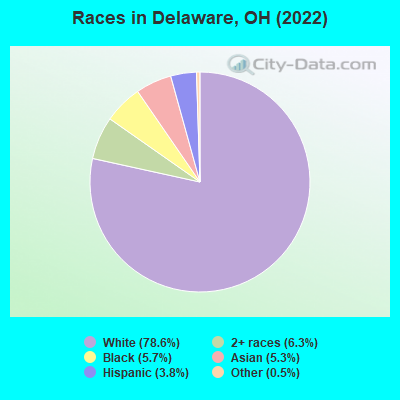
According to 2022 data, the most numerous races in Delaware, OH are White alone (34,505 residents), Black alone (2,505 residents), and Two or more races (2,769 residents). 92.0% of Delaware residents speak English at home. 4.9% of Delaware, OH residents are foreign-born (3.1% born in Asia, 0.7% born in Africa, 0.6% born in Latin America), which is 17.7% greater than the foreign-born rate of 4.0% across the entire state of Ohio.
Race distribution in Delaware
2000 2022
9,538,111 84.0% White alone 1,290,662 11.4% Black alone 217,123 1.9% Hispanic 137,770 1.2% Two or more races 131,670 1.2% Asian alone 21,985 0.2% American Indian alone 13,483 0.1% Other race alone 2,336 0.02% Native Hawaiian and Other
8,948,793 76.1% White alone 1,401,403 11.9% Black alone 529,291 4.5% Two or more races 517,232 4.4% Hispanic 293,387 2.5% Asian alone 52,805 0.4% Other race alone 9,785 0.08% American Indian alone 3,362 0.03% Native Hawaiian and Other
Income and house value in Delaware Median household income in 2022 $83,621 White non-Hispanic householders$58,001 Black householders$135,729 Asian householders$84,723 Some other race householders$62,166 Two or more races householders$49,790 Hispanic or Latino race householdersMedian 2022 house value $287,482 White Non-Hispanic householders$229,940 Black or African American householders$222,945 American Indian or Alaska Native householders $459,881 Asian householders$285,677 Some other race householders$265,142 Two or more races householders$143,515 Hispanic or Latino householders
Median age by race in Delaware
38.9 Median age for White residents37.9 40.2 25.2 Median age for Black or African American residents30.4 20.7 51.7 Median age for American Indian / Alaska Native residents-773,927,392.0 41.7 34.1 Median age for Asian residents35.4 31.4 -800,387,596.1 Median age for Native Hawaiian / Pacific Islander residents-666,666,666.0 -666,666,666.0 47.6 Median age for Other race residents43.3 43.6 28.9 Median age for Two or more races residents30.0 29.6 39.1 Median age for White alone residents38.0 40.3 32.1 Median age for Hispanic or Latino residents24.8 48.9
Owner/renter occupied households by race in Delaware
House owners and renters - White residents 8,631 59.8% Owner occupied5,810 40.2% Renter occupiedHouse owners and renters - Black or African American residents 206 37.9% Owner occupied338 62.1% Renter occupiedHouse owners and renters - Asian residents 693 98.8% Owner occupied9 1.2% Renter occupiedHouse owners and renters - Native Hawaiian / Pacific Islander residents 27 100.0% Renter occupiedHouse owners and renters - Other race residents 74 51.9% Owner occupied68 48.1% Renter occupiedHouse owners and renters - Two or more races residents 974 65.2% Owner occupied521 34.8% Renter occupiedHouse owners and renters - White alone residents 8,661 59.8% Owner occupied5,829 40.2% Renter occupiedHouse owners and renters - Hispanic or Latino residents 371 47.2% Owner occupied416 52.8% Renter occupied
Language usage in Delaware
English speakers - Total 92.0% of residents of Delaware speak English at home.
1.9% of residents speak Spanish at home 351 44.8% Speak English very well433 55.2% Speak English less than very well5.8% of residents speak other language at home 1,883 78.4% Speak English very well518 21.6% Speak English less than very well
English speakers - Born in the United States 97.1% of residents of Delaware speak English at home.
0.6% of residents speak Spanish at home 58 100.0% Speak English very well2.2% of residents speak other language at home 203 100.0% Speak English very well
English speakers - Native, born elsewhere 38.4% of residents of Delaware speak English at home.
32.5% of residents speak Spanish at home 48 39.0% Speak English very well75 61.0% Speak English less than very well24.3% of residents speak other language at home 92 100.0% Speak English very well
English speakers - Foreign-born 19.0% of residents of Delaware speak English at home.
13.3% of residents speak Spanish at home 91 27.3% Speak English very well242 72.7% Speak English less than very well70.1% of residents speak other language at home 1,277 72.7% Speak English very well480 27.3% Speak English less than very well
White (Caucasian) - Speak only English Native:
98.5% (32,049)Foreign-born:
75.4% (153)
White (Caucasian) - Speak another language Native:
1.5% (502)Foreign-born:
18.2% (37)
Black or African American - Speak only English Native:
87.2% (1,462)Foreign-born:
26.5% (133)
Black or African American - Speak another language Native:
4.0% (66)Foreign-born:
74.3% (374)
Asian - Speak only English Native:
78.8% (539)Foreign-born:
12.9% (198)
Asian - Speak another language Native:
23.8% (163)Foreign-born:
87.1% (1,331)
Other race - Speak only English Native:
80.1% (241)Foreign-born:
6.9% (9)
Other race - Speak another language Native:
18.2% (55)Foreign-born:
93.7% (117)
Two or more races - Speak another language Native:
3.8% (113)Foreign-born:
100.0% (166)
White alone - Speak only English Native:
98.6% (31,848)Foreign-born:
68.2% (125)
White alone - Speak another language Native:
1.4% (445)Foreign-born:
23.4% (43)
Hispanic or Latino - Speak only English Native:
74.8% (847)Foreign-born:
13.9% (43)
Hispanic or Latino - Speak another language Native:
24.5% (278)Foreign-born:
85.5% (267)
Foreign-born residents in Delaware 2,133 residents are foreign born (3.1% Asia , 0.7% Africa , 0.6% Latin America ).
Marital status for residents in Delaware Marital status - White (Caucasian) population 15 years and over
Males 32.5% Never married54.1% Now married0.6% Separated3.2% Widowed9.7% DivorcedFemales 24.7% Never married52.5% Now married1.5% Separated8.6% Widowed12.7% DivorcedWomen who gave birth in the past 12 months Now married:
82.7% (268)Unmarried:
17.3% (56)
Women who did not give birth in the past 12 months Now married:
53.8% (4,238)Unmarried:
46.2% (3,635)
Marital status - Black or African American population 15 years and over
Males 49.9% Never married34.9% Now married1.0% Separated0.0% Widowed14.1% DivorcedFemales 42.0% Never married35.7% Now married6.8% Separated6.5% Widowed8.9% DivorcedWomen who gave birth in the past 12 months Now married:
77.8% (41)Unmarried:
22.2% (12)
Women who did not give birth in the past 12 months Now married:
39.5% (140)Unmarried:
60.5% (214)
Marital status - Asian population 15 years and over
Males 23.3% Never married71.4% Now married0.0% Separated1.7% Widowed3.6% DivorcedFemales 36.2% Never married53.8% Now married6.1% Separated2.0% Widowed1.9% DivorcedWomen who gave birth in the past 12 months Now married:
100.0% (74)Unmarried:
0.0% (0)
Women who did not give birth in the past 12 months Now married:
52.2% (353)Unmarried:
47.8% (323)
Marital status - Other race population 15 years and over
Males 39.9% Never married60.1% Now married0.0% Separated0.0% Widowed0.0% DivorcedFemales 35.6% Never married50.0% Now married0.0% Separated14.4% Widowed0.0% DivorcedWomen who did not give birth in the past 12 months Now married:
59.4% (50)Unmarried:
40.6% (34)
Marital status - Two or more races population 15 years and over
Males 59.8% Never married35.6% Now married0.0% Separated0.0% Widowed4.6% DivorcedFemales 51.9% Never married34.6% Now married0.4% Separated5.4% Widowed7.7% DivorcedWomen who gave birth in the past 12 months Now married:
100.0% (23)Unmarried:
0.0% (0)
Women who did not give birth in the past 12 months Now married:
25.9% (260)Unmarried:
74.1% (741)
Marital status - White alone, not Hispanic / Latino population 15 years and over
Males 32.0% Never married54.5% Now married0.6% Separated3.2% Widowed9.8% DivorcedFemales 24.4% Never married53.0% Now married1.3% Separated8.7% Widowed12.5% DivorcedWomen who gave birth in the past 12 months Now married:
82.7% (268)Unmarried:
17.3% (56)
Women who did not give birth in the past 12 months Now married:
54.2% (4,223)Unmarried:
45.8% (3,569)
Marital status - Hispanic or Latino population 15 years and over
Males 60.7% Never married38.2% Now married0.0% Separated0.0% Widowed1.1% DivorcedFemales 54.3% Never married26.8% Now married5.4% Separated4.7% Widowed8.8% DivorcedWomen who did not give birth in the past 12 months Now married:
19.0% (55)Unmarried:
81.0% (234)
Ancestries in Delaware
3,070 17.9% German2,357 13.7% English1,738 10.1% Irish1,264 7.4% American878 5.1% European664 3.9% Italian297 1.7% Welsh281 1.6% Scottish181 1.1% British152 0.9% Polish150 0.9% Scotch-Irish124 0.7% African115 0.7% French113 0.7% Eastern European108 0.6% Norwegian104 0.6% Ghanaian99 0.6% Scandinavian93 0.5% Sierra Leonean92 0.5% Somali82 0.5% Kenyan81 0.5% Hungarian71 0.4% Dutch60 0.3% Greek54 0.3% Czechoslovakian52 0.3% Northern European41 0.2% Lithuanian29 0.2% Austrian24 0.1% Russian21 0.1% Swedish20 0.1% Czech19 0.1% Slovak18 0.1% French Canadian14 0.08% Swiss14 0.08% Haitian13 0.08% Cypriot11 0.06% Romanian11 0.06% Nigerian10 0.06% Canadian10 0.06% Slavic10 0.06% Yugoslavian9 0.05% Croatian8 0.05% Lebanese3 0.02% Ethiopian3 0.02% South African1 0.01% Jamaican
Geographical mobility in Delaware Same house 1 year ago 28,981 84.6% White (Caucasian)1,871 73.6% Black or African American21 100.0% American Indian / Alaska Native1,876 81.3% Asian23 100.0% Native Hawaiian / Pacific Islander359 84.3% Other race3,042 86.9% Two or more races28,876 84.8% White alone, not Hispanic / Latino1,356 87.6% Hispanic or LatinoMoved within same county 2,452 7.2% White / Caucasian140 5.5% Black or African American82 3.5% Asian250 7.1% Two or more races2,425 7.1% White alone, not Hispanic / Latino28 1.8% Hispanic or LatinoMoved within same state 2,057 6.0% White / Caucasian369 14.5% Black or African American142 6.1% Asian13 3.1% Other race170 4.8% Two or more races2,035 6.0% White alone, not Hispanic / Latino103 6.6% Hispanic or LatinoMoved from different state 544 1.6% White / Caucasian21 0.8% Black or African American7 0.3% Asian54 12.6% Other race26 0.7% Two or more races490 1.4% White alone, not Hispanic / Latino39 2.5% Hispanic or LatinoMoved from abroad 154 0.4% White9 0.4% Black or African American259 11.2% Asian137 0.4% White alone, not Hispanic / Latino64 4.1% Hispanic or Latino
Children Nativity (place of birth) in Delaware
Children under 6 years - Living with two parents Both parents native 2,271 100.0% NativeBoth parents foreign-born 158 92.2% Native13 7.8% Foreign-bornOne native, one foreign-born parent 49 100.0% NativeChildren under 6 years - Living with one parent Native parent 460 100.0% NativeForeign-born parent 80 100.0% NativeChildren 6 to 17 years - Living with two parents Both parents native 3,779 99.5% Native19 0.5% Foreign-bornBoth parents foreign-born 455 81.0% Native107 19.0% Foreign-bornOne native, one foreign-born parent 180 100.0% NativeChildren 6 to 17 years - Living with one parent Native parent 1,712 100.0% NativeForeign-born parent 97 51.2% Native92 48.8% Foreign-born
Grandparents responsible for own grandchildren in Delaware
Grandparents (30 to 59 years) White / Caucasian 48 45.5% Responsible for grandchildren57 54.5% Not responsible for grandchildrenBlack or African American 17 100.0% Responsible for grandchildrenWhite alone, not Hispanic / Latino 48 44.9% Responsible for grandchildren58 55.1% Not responsible for grandchildrenGrandparents (60 years and over) White / Caucasian 53 22.9% Responsible for grandchildren179 77.1% Not responsible for grandchildrenBlack or African American 6 100.0% Responsible for grandchildrenWhite alone, not Hispanic / Latino 53 22.7% Responsible for grandchildren180 77.3% Not responsible for grandchildren