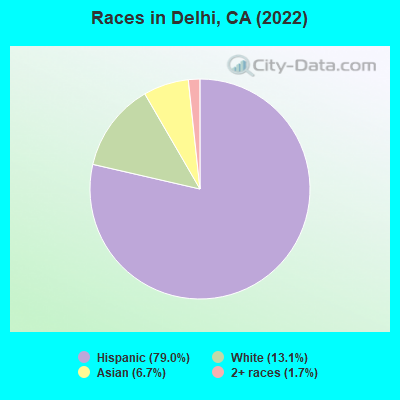
Races in Delhi, California (CA) Detailed Stats
Data:
Races - White alone (%)
Races - White alone (% change since 2000)
Races - Black alone (%)
Races - Black alone (% change since 2000)
Races - American Indian alone (%)
Races - American Indian alone (% change since 2000)
Races - Asian alone (%)
Races - Asian alone (% change since 2000)
Races - Hispanic (%)
Races - Hispanic (% change since 2000)
Races - Native Hawaiian and Other Pacific Islander alone (%)
Races - Native Hawaiian and Other Pacific Islander alone (% change since 2000)
Races - Two or more races(%)
Races - Two or more races(% change since 2000)
Races - Other race alone (%)
Races - Other race alone (% change since 2000)
Racial diversity
Place of birth - Born in state of residence (%)
Place of birth - Born in state of residence (%) - White
Place of birth - Born in state of residence (%) - Black or African American
Place of birth - Born in state of residence (%) - Asian
Place of birth - Born in state of residence (%) - Hispanic or Latino
Place of birth - Born in state of residence (%) - American Indian and Alaska Native
Place of birth - Born in state of residence (%) - Multirace
Place of birth - Born in state of residence (%) - Other Race
Place of birth - Born in other state (%)
Place of birth - Born in other state (%) - White
Place of birth - Born in other state (%) - Black or African American
Place of birth - Born in other state (%) - Asian
Place of birth - Born in other state (%) - Hispanic or Latino
Place of birth - Born in other state (%) - American Indian and Alaska Native
Place of birth - Born in other state (%) - Multirace
Place of birth - Born in other state (%) - Other Race
Place of birth - Native, outside of US (%)
Place of birth - Native, outside of US (%) - White
Place of birth - Native, outside of US (%) - Black or African American
Place of birth - Native, outside of US (%) - Asian
Place of birth - Native, outside of US (%) - Hispanic or Latino
Place of birth - Native, outside of US (%) - American Indian and Alaska Native
Place of birth - Native, outside of US (%) - Multirace
Place of birth - Native, outside of US (%) - Other Race
Place of birth - Foreign born (%)
Place of birth - Foreign born (%) - White
Place of birth - Foreign born (%) - Black or African American
Place of birth - Foreign born (%) - Asian
Place of birth - Foreign born (%) - Hispanic or Latino
Place of birth - Foreign born (%) - American Indian and Alaska Native
Place of birth - Foreign born (%) - Multirace
Place of birth - Foreign born (%) - Other Race
Residents speaking English at home (%)
Residents speaking English at home - Born in the United States (%)
Residents speaking English at home - Native, born elsewhere (%)
Residents speaking English at home - Foreign born (%)
Residents speaking Spanish at home (%)
Residents speaking Spanish at home - Born in the United States (%)
Residents speaking Spanish at home - Native, born elsewhere (%)
Residents speaking Spanish at home - Foreign born (%)
Residents speaking other language at home (%)
Residents speaking other language at home - Born in the United States (%)
Residents speaking other language at home - Native, born elsewhere (%)
Residents speaking other language at home - Foreign born (%)
Marital status - Never married (%)
Marital status - Now married (%)
Marital status - Separated (%)
Marital status - Widowed (%)
Marital status - Divorced (%)
Ancestries Reported - Arab (%)
Ancestries Reported - Czech (%)
Ancestries Reported - Danish (%)
Ancestries Reported - Dutch (%)
Ancestries Reported - English (%)
Ancestries Reported - French (%)
Ancestries Reported - French Canadian (%)
Ancestries Reported - German (%)
Ancestries Reported - Greek (%)
Ancestries Reported - Hungarian (%)
Ancestries Reported - Irish (%)
Ancestries Reported - Italian (%)
Ancestries Reported - Lithuanian (%)
Ancestries Reported - Norwegian (%)
Ancestries Reported - Polish (%)
Ancestries Reported - Portuguese (%)
Ancestries Reported - Russian (%)
Ancestries Reported - Scotch-Irish (%)
Ancestries Reported - Scottish (%)
Ancestries Reported - Slovak (%)
Ancestries Reported - Subsaharan African (%)
Ancestries Reported - Swedish (%)
Ancestries Reported - Swiss (%)
Ancestries Reported - Ukrainian (%)
Ancestries Reported - United States (%)
Ancestries Reported - Welsh (%)
Ancestries Reported - West Indian (%)
Ancestries Reported - Other (%)
Geographical mobility - Same house 1 year ago (%)
Geographical mobility - Same house 1 year ago (%) - White
Geographical mobility - Same house 1 year ago (%) - Black or African American
Geographical mobility - Same house 1 year ago (%) - Asian
Geographical mobility - Same house 1 year ago (%) - Hispanic or Latino
Geographical mobility - Same house 1 year ago (%) - American Indian and Alaska Native
Geographical mobility - Same house 1 year ago (%) - Multirace
Geographical mobility - Same house 1 year ago (%) - Other Race
Geographical mobility - Moved within same county (%)
Geographical mobility - Moved within same county (%) - White
Geographical mobility - Moved within same county (%) - Black or African American
Geographical mobility - Moved within same county (%) - Asian
Geographical mobility - Moved within same county (%) - Hispanic or Latino
Geographical mobility - Moved within same county (%) - American Indian and Alaska Native
Geographical mobility - Moved within same county (%) - Multirace
Geographical mobility - Moved within same county (%) - Other Race
Geographical mobility - Moved from different county within same state (%)
Geographical mobility - Moved from different county within same state (%) - White
Geographical mobility - Moved from different county within same state (%) - Black or African American
Geographical mobility - Moved from different county within same state (%) - Asian
Geographical mobility - Moved from different county within same state (%) - Hispanic or Latino
Geographical mobility - Moved from different county within same state (%) - American Indian and Alaska Native
Geographical mobility - Moved from different county within same state (%) - Multirace
Geographical mobility - Moved from different county within same state (%) - Other Race
Geographical mobility - Moved from different state (%)
Geographical mobility - Moved from different state (%) - White
Geographical mobility - Moved from different state (%) - Black or African American
Geographical mobility - Moved from different state (%) - Asian
Geographical mobility - Moved from different state (%) - Hispanic or Latino
Geographical mobility - Moved from different state (%) - American Indian and Alaska Native
Geographical mobility - Moved from different state (%) - Multirace
Geographical mobility - Moved from different state (%) - Other Race
Geographical mobility - Moved from abroad (%)
Geographical mobility - Moved from abroad (%) - White
Geographical mobility - Moved from abroad (%) - Black or African American
Geographical mobility - Moved from abroad (%) - Asian
Geographical mobility - Moved from abroad (%) - Hispanic or Latino
Geographical mobility - Moved from abroad (%) - American Indian and Alaska Native
Geographical mobility - Moved from abroad (%) - Multirace
Geographical mobility - Moved from abroad (%) - Other Race
Place of birth for the foreign-born population - Ireland (%)
Place of birth for the foreign-born population - Denmark (%)
Place of birth for the foreign-born population - Norway (%)
Place of birth for the foreign-born population - Sweden (%)
Place of birth for the foreign-born population - United Kingdom (%)
Place of birth for the foreign-born population - England (%)
Place of birth for the foreign-born population - Scotland (%)
Place of birth for the foreign-born population - Other Northern Europe (%)
Place of birth for the foreign-born population - Austria (%)
Place of birth for the foreign-born population - Belgium (%)
Place of birth for the foreign-born population - France (%)
Place of birth for the foreign-born population - Germany (%)
Place of birth for the foreign-born population - Netherlands (%)
Place of birth for the foreign-born population - Switzerland (%)
Place of birth for the foreign-born population - Other Western Europe (%)
Place of birth for the foreign-born population - Greece (%)
Place of birth for the foreign-born population - Italy (%)
Place of birth for the foreign-born population - Portugal (%)
Place of birth for the foreign-born population - Spain (%)
Place of birth for the foreign-born population - Other Southern Europe (%)
Place of birth for the foreign-born population - Albania (%)
Place of birth for the foreign-born population - Belarus (%)
Place of birth for the foreign-born population - Bosnia and Herzegovina (%)
Place of birth for the foreign-born population - Bulgaria (%)
Place of birth for the foreign-born population - Croatia (%)
Place of birth for the foreign-born population - Czechoslovakia (%)
Place of birth for the foreign-born population - Hungary (%)
Place of birth for the foreign-born population - Latvia (%)
Place of birth for the foreign-born population - Lithuania (%)
Place of birth for the foreign-born population - North Macedonia (Macedonia) (%)
Place of birth for the foreign-born population - Moldova (%)
Place of birth for the foreign-born population - Poland (%)
Place of birth for the foreign-born population - Romania (%)
Place of birth for the foreign-born population - Russia (%)
Place of birth for the foreign-born population - Serbia (%)
Place of birth for the foreign-born population - Ukraine (%)
Place of birth for the foreign-born population - Other Eastern Europe (%)
Place of birth for the foreign-born population - China (%)
Place of birth for the foreign-born population - Hong Kong (%)
Place of birth for the foreign-born population - Taiwan (%)
Place of birth for the foreign-born population - Japan (%)
Place of birth for the foreign-born population - Korea (%)
Place of birth for the foreign-born population - Other Eastern Asia (%)
Place of birth for the foreign-born population - Afghanistan (%)
Place of birth for the foreign-born population - Bangladesh (%)
Place of birth for the foreign-born population - India (%)
Place of birth for the foreign-born population - Iran (%)
Place of birth for the foreign-born population - Kazakhstan (%)
Place of birth for the foreign-born population - Nepal (%)
Place of birth for the foreign-born population - Pakistan (%)
Place of birth for the foreign-born population - Sri Lanka (%)
Place of birth for the foreign-born population - Uzbekistan (%)
Place of birth for the foreign-born population - Other South Central Asia (%)
Place of birth for the foreign-born population - Burma (%)
Place of birth for the foreign-born population - Cambodia (%)
Place of birth for the foreign-born population - Indonesia (%)
Place of birth for the foreign-born population - Laos (%)
Place of birth for the foreign-born population - Malaysia (%)
Place of birth for the foreign-born population - Philippines (%)
Place of birth for the foreign-born population - Singapore (%)
Place of birth for the foreign-born population - Thailand (%)
Place of birth for the foreign-born population - Vietnam (%)
Place of birth for the foreign-born population - Other South Eastern Asia (%)
Place of birth for the foreign-born population - Armenia (%)
Place of birth for the foreign-born population - Iraq (%)
Place of birth for the foreign-born population - Israel (%)
Place of birth for the foreign-born population - Jordan (%)
Place of birth for the foreign-born population - Kuwait (%)
Place of birth for the foreign-born population - Lebanon (%)
Place of birth for the foreign-born population - Saudi Arabia (%)
Place of birth for the foreign-born population - Syria (%)
Place of birth for the foreign-born population - Turkey (%)
Place of birth for the foreign-born population - Yemen (%)
Place of birth for the foreign-born population - Other Western Asia (%)
Place of birth for the foreign-born population - Eritrea (%)
Place of birth for the foreign-born population - Ethiopia (%)
Place of birth for the foreign-born population - Kenya (%)
Place of birth for the foreign-born population - Somalia (%)
Place of birth for the foreign-born population - Uganda (%)
Place of birth for the foreign-born population - Zimbabwe (%)
Place of birth for the foreign-born population - Other Eastern Africa (%)
Place of birth for the foreign-born population - Cameroon (%)
Place of birth for the foreign-born population - Congo (%)
Place of birth for the foreign-born population - Democratic Republic of Congo (Zaire) (%)
Place of birth for the foreign-born population - Other Middle Africa (%)
Place of birth for the foreign-born population - Egypt (%)
Place of birth for the foreign-born population - Morocco (%)
Place of birth for the foreign-born population - Sudan (%)
Place of birth for the foreign-born population - Other Northern Africa (%)
Place of birth for the foreign-born population - South Africa (%)
Place of birth for the foreign-born population - Other Southern Africa (%)
Place of birth for the foreign-born population - Cabo Verde (%)
Place of birth for the foreign-born population - Ghana (%)
Place of birth for the foreign-born population - Liberia (%)
Place of birth for the foreign-born population - Nigeria (%)
Place of birth for the foreign-born population - Senegal (%)
Place of birth for the foreign-born population - Sierra Leone (%)
Place of birth for the foreign-born population - Other Western Africa (%)
Place of birth for the foreign-born population - Australia (%)
Place of birth for the foreign-born population - New Zealand (%)
Place of birth for the foreign-born population - Fiji (%)
Place of birth for the foreign-born population - Micronesia (%)
Place of birth for the foreign-born population - Bahamas (%)
Place of birth for the foreign-born population - Barbados (%)
Place of birth for the foreign-born population - Cuba (%)
Place of birth for the foreign-born population - Dominica (%)
Place of birth for the foreign-born population - Dominican Republic (%)
Place of birth for the foreign-born population - Grenada (%)
Place of birth for the foreign-born population - Haiti (%)
Place of birth for the foreign-born population - Jamaica (%)
Place of birth for the foreign-born population - St. Vincent and the Grenadines (%)
Place of birth for the foreign-born population - Trinidad and Tobago (%)
Place of birth for the foreign-born population - West Indies (%)
Place of birth for the foreign-born population - Other Caribbean (%)
Place of birth for the foreign-born population - Belize (%)
Place of birth for the foreign-born population - Costa Rica (%)
Place of birth for the foreign-born population - El Salvador (%)
Place of birth for the foreign-born population - Guatemala (%)
Place of birth for the foreign-born population - Honduras (%)
Place of birth for the foreign-born population - Mexico (%)
Place of birth for the foreign-born population - Nicaragua (%)
Place of birth for the foreign-born population - Panama (%)
Place of birth for the foreign-born population - Other Central America (%)
Place of birth for the foreign-born population - Argentina (%)
Place of birth for the foreign-born population - Bolivia (%)
Place of birth for the foreign-born population - Brazil (%)
Place of birth for the foreign-born population - Chile (%)
Place of birth for the foreign-born population - Colombia (%)
Place of birth for the foreign-born population - Ecuador (%)
Place of birth for the foreign-born population - Guyana (%)
Place of birth for the foreign-born population - Peru (%)
Place of birth for the foreign-born population - Uruguay (%)
Place of birth for the foreign-born population - Venezuela (%)
Place of birth for the foreign-born population - Other South America (%)
Place of birth for the foreign-born population - Canada (%)
Place of birth for the foreign-born population - Other Northern America (%)
Place of birth for the foreign-born population - Other (%)
Latest news about races in Delhi, CA collected exclusively by city-data.com from local newspapers, TV, and radio stations
According to 2022 data, the most numerous races in Delhi, CA are Hispanic (9,826 residents), White alone (1,863 residents), and Asian alone (546 residents). 23.8% of Delhi residents speak English at home. 35.5% of Delhi, CA residents are foreign-born (31.6% born in Latin America), which is 26.7% greater than the foreign-born rate of 26.0% across the entire state of California.
Race distribution in Delhi
2000 2022
15,816,790 46.7% White alone 10,966,556 32.4% Hispanic 3,648,860 10.8% Asian alone 2,181,926 6.4% Black alone 903,115 2.7% Two or more races 178,984 0.5% American Indian alone 103,736 0.3% Native Hawaiian and Other 71,681 0.2% Other race alone
15,732,184 40.3% Hispanic 13,160,426 33.7% White alone 5,957,867 15.3% Asian alone 2,025,218 5.2% Black alone 1,663,222 4.3% Two or more races 251,618 0.6% Other race alone 135,777 0.3% Native Hawaiian and Other 103,030 0.3% American Indian alone
Income and house value in Delhi Median household income in 2022 $51,934 White non-Hispanic householdersover $200,000 Black householders$39,224 American Indian and Alaska Native householdersover $200,000 Asian householders$4,846 Native Hawaiian and other Pacific Islander householders$92,802 Some other race householders$48,649 Two or more races householders$102,073 Hispanic or Latino race householdersMedian 2022 house value $385,484 White Non-Hispanic householders$674,868 Black or African American householders$356,330 American Indian or Alaska Native householders $391,603 Asian householders$356,690 Some other race householders$361,009 Two or more races householders$366,408 Hispanic or Latino householders
Median age by race in Delhi
36.4 Median age for White residents29.1 39.4 25.7 Median age for Black or African American residents8.5 Median age for American Indian / Alaska Native residents3.1 18.0 57.1 Median age for Asian residents66.1 28.9 17.9 Median age for Native Hawaiian / Pacific Islander residents28.3 Median age for Other race residents28.0 28.7 53.2 Median age for Two or more races residents75.2 21.0 45.5 Median age for White alone residents45.8 43.5 27.7 Median age for Hispanic or Latino residents25.3 30.8
Owner/renter occupied households by race in Delhi
House owners and renters - White residents 900 75.3% Owner occupied295 24.7% Renter occupiedHouse owners and renters - Black or African American residents 46 100.0% Owner occupiedHouse owners and renters - American Indian / Alaska Native residents 19 100.0% Owner occupiedHouse owners and renters - Asian residents 89 100.0% Owner occupiedHouse owners and renters - Other race residents 1,248 63.6% Owner occupied714 36.4% Renter occupiedHouse owners and renters - Two or more races residents 95 59.3% Owner occupied65 40.7% Renter occupiedHouse owners and renters - White alone residents 481 72.7% Owner occupied181 27.3% Renter occupiedHouse owners and renters - Hispanic or Latino residents 1,644 68.7% Owner occupied749 31.3% Renter occupied
Language usage in Delhi
English speakers - Total 23.8% of residents of Delhi speak English at home.
68.7% of residents speak Spanish at home 4,908 63.2% Speak English very well2,857 36.8% Speak English less than very well6.6% of residents speak other language at home 524 69.9% Speak English very well226 30.1% Speak English less than very well
English speakers - Born in the United States 87.2% of residents of Delhi speak English at home.
12.7% of residents speak Spanish at home 68 100.0% Speak English very well
English speakers - Native, born elsewhere 0.0% of residents of Delhi speak English at home.
101.2% of residents speak Spanish at home 65 75.6% Speak English very well21 24.4% Speak English less than very well
English speakers - Foreign-born 2.1% of residents of Delhi speak English at home.
83.2% of residents speak Spanish at home 1,048 29.3% Speak English very well2,523 70.7% Speak English less than very well11.6% of residents speak other language at home 276 55.2% Speak English very well224 44.8% Speak English less than very well
White (Caucasian) - Speak only English Native:
60.7% (1,551)Foreign-born:
6.6% (47)
White (Caucasian) - Speak another language Native:
32.0% (819)Foreign-born:
88.2% (633)
Black or African American - Speak another language Native:
100.0% (122)Foreign-born:
100.0% (64)
American Indian / Alaska Native - Speak another language Native:
23.0% (27)Foreign-born:
100.0% (6)
Asian - Speak another language Native:
95.6% (145)Foreign-born:
96.1% (350)
Other race - Speak only English Native:
11.2% (489)Foreign-born:
1.5% (61)
Other race - Speak another language Native:
89.2% (3,887)Foreign-born:
97.3% (3,861)
Two or more races - Speak another language Native:
37.8% (343)Foreign-born:
100.0% (182)
White alone - Speak only English Native:
90.2% (1,444)Foreign-born:
8.5% (15)
White alone - Speak another language Native:
10.0% (160)Foreign-born:
92.9% (165)
Hispanic or Latino - Speak only English Native:
14.2% (726)Foreign-born:
1.6% (66)
Hispanic or Latino - Speak another language Native:
89.1% (4,550)Foreign-born:
97.6% (4,057)
Foreign-born residents in Delhi 4,471 residents are foreign born (31.6% Latin America ).
This city:
35.5%California:
100.0%
Marital status for residents in Delhi Marital status - White (Caucasian) population 15 years and over
Males 44.1% Never married41.9% Now married2.4% Separated0.0% Widowed11.6% DivorcedFemales 34.9% Never married44.9% Now married4.6% Separated6.9% Widowed8.7% DivorcedWomen who gave birth in the past 12 months Now married:
27.7% (36)Unmarried:
72.3% (93)
Women who did not give birth in the past 12 months Now married:
45.7% (328)Unmarried:
54.3% (389)
Marital status - Black or African American population 15 years and over
Males 76.2% Never married23.8% Now married0.0% Separated0.0% Widowed0.0% DivorcedFemales 0.0% Never married100.0% Now married0.0% Separated0.0% Widowed0.0% DivorcedWomen who did not give birth in the past 12 months Now married:
100.0% (26)Unmarried:
0.0% (0)
Marital status - American Indian / Alaska Native population 15 years and over
Males 0.0% Never married0.0% Now married100.0% Separated0.0% Widowed0.0% DivorcedFemales 80.4% Never married0.0% Now married0.0% Separated19.6% Widowed0.0% DivorcedWomen who did not give birth in the past 12 months Now married:
0.0% (0)Unmarried:
100.0% (65)
Marital status - Asian population 15 years and over
Males 0.0% Never married63.1% Now married0.0% Separated8.8% Widowed28.1% DivorcedFemales 39.5% Never married52.5% Now married0.0% Separated8.0% Widowed0.0% DivorcedWomen who did not give birth in the past 12 months Now married:
30.9% (41)Unmarried:
69.1% (92)
Marital status - Other race population 15 years and over
Males 28.5% Never married61.8% Now married4.1% Separated0.0% Widowed5.6% DivorcedFemales 40.5% Never married51.2% Now married3.9% Separated3.5% Widowed0.8% DivorcedWomen who gave birth in the past 12 months Now married:
18.8% (28)Unmarried:
81.3% (122)
Women who did not give birth in the past 12 months Now married:
47.6% (1,059)Unmarried:
52.4% (1,166)
Marital status - Two or more races population 15 years and over
Males 30.7% Never married37.1% Now married0.0% Separated10.4% Widowed21.8% DivorcedFemales 0.0% Never married36.7% Now married0.0% Separated0.0% Widowed63.3% DivorcedWomen who did not give birth in the past 12 months Now married:
36.7% (65)Unmarried:
63.3% (113)
Marital status - White alone, not Hispanic / Latino population 15 years and over
Males 25.6% Never married52.4% Now married0.0% Separated0.0% Widowed22.0% DivorcedFemales 39.1% Never married40.2% Now married4.3% Separated8.1% Widowed8.3% DivorcedWomen who gave birth in the past 12 months Now married:
73.8% (44)Unmarried:
26.2% (16)
Women who did not give birth in the past 12 months Now married:
23.9% (92)Unmarried:
76.1% (294)
Marital status - Hispanic or Latino population 15 years and over
Males 39.0% Never married52.3% Now married4.0% Separated0.0% Widowed4.7% DivorcedFemales 36.7% Never married50.9% Now married4.1% Separated4.0% Widowed4.2% DivorcedWomen who gave birth in the past 12 months Now married:
9.5% (22)Unmarried:
90.5% (209)
Women who did not give birth in the past 12 months Now married:
51.6% (1,241)Unmarried:
48.4% (1,166)
Ancestries in Delhi
303 3.1% Portuguese193 2.0% English153 1.6% American132 1.3% European46 0.5% Dutch34 0.3% Irish23 0.2% French22 0.2% Italian18 0.2% Assyrian11 0.1% Norwegian9 0.09% German7 0.07% Czech
Children Nativity (place of birth) in Delhi
Children under 6 years - Living with two parents Both parents native 128 100.0% NativeBoth parents foreign-born 35 100.0% NativeOne native, one foreign-born parent 353 100.0% NativeChildren under 6 years - Living with one parent Native parent 378 99.9% Native1 0.1% Foreign-bornForeign-born parent 121 48.1% Native130 51.9% Foreign-bornChildren 6 to 17 years - Living with two parents Both parents native 320 99.9% Native0 0.1% Foreign-bornBoth parents foreign-born 729 96.1% Native30 3.9% Foreign-bornOne native, one foreign-born parent 565 100.0% NativeChildren 6 to 17 years - Living with one parent Native parent 207 100.0% NativeForeign-born parent 435 50.0% Native436 50.0% Foreign-born
Grandparents responsible for own grandchildren in Delhi
Grandparents (30 to 59 years) White / Caucasian 17 38.7% Responsible for grandchildren26 61.3% Not responsible for grandchildrenOther race 49 22.5% Responsible for grandchildren170 77.5% Not responsible for grandchildrenWhite alone, not Hispanic / Latino 11 60.7% Responsible for grandchildren7 39.3% Not responsible for grandchildrenHispanic or Latino 52 23.7% Responsible for grandchildren167 76.3% Not responsible for grandchildrenGrandparents (60 years and over) White / Caucasian 106 68.1% Responsible for grandchildren50 31.9% Not responsible for grandchildrenOther race 9 3.2% Responsible for grandchildren275 96.8% Not responsible for grandchildrenWhite alone, not Hispanic / Latino 77 71.6% Responsible for grandchildren31 28.4% Not responsible for grandchildrenHispanic or Latino 11 4.4% Responsible for grandchildren230 95.6% Not responsible for grandchildren