Races in Dothan, Alabama (AL) Detailed Stats
Data:
Races - White alone (%)
Races - White alone (% change since 2000)
Races - Black alone (%)
Races - Black alone (% change since 2000)
Races - American Indian alone (%)
Races - American Indian alone (% change since 2000)
Races - Asian alone (%)
Races - Asian alone (% change since 2000)
Races - Hispanic (%)
Races - Hispanic (% change since 2000)
Races - Native Hawaiian and Other Pacific Islander alone (%)
Races - Native Hawaiian and Other Pacific Islander alone (% change since 2000)
Races - Two or more races(%)
Races - Two or more races(% change since 2000)
Races - Other race alone (%)
Races - Other race alone (% change since 2000)
Racial diversity
Place of birth - Born in state of residence (%)
Place of birth - Born in state of residence (%) - White
Place of birth - Born in state of residence (%) - Black or African American
Place of birth - Born in state of residence (%) - Asian
Place of birth - Born in state of residence (%) - Hispanic or Latino
Place of birth - Born in state of residence (%) - American Indian and Alaska Native
Place of birth - Born in state of residence (%) - Multirace
Place of birth - Born in state of residence (%) - Other Race
Place of birth - Born in other state (%)
Place of birth - Born in other state (%) - White
Place of birth - Born in other state (%) - Black or African American
Place of birth - Born in other state (%) - Asian
Place of birth - Born in other state (%) - Hispanic or Latino
Place of birth - Born in other state (%) - American Indian and Alaska Native
Place of birth - Born in other state (%) - Multirace
Place of birth - Born in other state (%) - Other Race
Place of birth - Native, outside of US (%)
Place of birth - Native, outside of US (%) - White
Place of birth - Native, outside of US (%) - Black or African American
Place of birth - Native, outside of US (%) - Asian
Place of birth - Native, outside of US (%) - Hispanic or Latino
Place of birth - Native, outside of US (%) - American Indian and Alaska Native
Place of birth - Native, outside of US (%) - Multirace
Place of birth - Native, outside of US (%) - Other Race
Place of birth - Foreign born (%)
Place of birth - Foreign born (%) - White
Place of birth - Foreign born (%) - Black or African American
Place of birth - Foreign born (%) - Asian
Place of birth - Foreign born (%) - Hispanic or Latino
Place of birth - Foreign born (%) - American Indian and Alaska Native
Place of birth - Foreign born (%) - Multirace
Place of birth - Foreign born (%) - Other Race
Residents speaking English at home (%)
Residents speaking English at home - Born in the United States (%)
Residents speaking English at home - Native, born elsewhere (%)
Residents speaking English at home - Foreign born (%)
Residents speaking Spanish at home (%)
Residents speaking Spanish at home - Born in the United States (%)
Residents speaking Spanish at home - Native, born elsewhere (%)
Residents speaking Spanish at home - Foreign born (%)
Residents speaking other language at home (%)
Residents speaking other language at home - Born in the United States (%)
Residents speaking other language at home - Native, born elsewhere (%)
Residents speaking other language at home - Foreign born (%)
Marital status - Never married (%)
Marital status - Now married (%)
Marital status - Separated (%)
Marital status - Widowed (%)
Marital status - Divorced (%)
Ancestries Reported - Arab (%)
Ancestries Reported - Czech (%)
Ancestries Reported - Danish (%)
Ancestries Reported - Dutch (%)
Ancestries Reported - English (%)
Ancestries Reported - French (%)
Ancestries Reported - French Canadian (%)
Ancestries Reported - German (%)
Ancestries Reported - Greek (%)
Ancestries Reported - Hungarian (%)
Ancestries Reported - Irish (%)
Ancestries Reported - Italian (%)
Ancestries Reported - Lithuanian (%)
Ancestries Reported - Norwegian (%)
Ancestries Reported - Polish (%)
Ancestries Reported - Portuguese (%)
Ancestries Reported - Russian (%)
Ancestries Reported - Scotch-Irish (%)
Ancestries Reported - Scottish (%)
Ancestries Reported - Slovak (%)
Ancestries Reported - Subsaharan African (%)
Ancestries Reported - Swedish (%)
Ancestries Reported - Swiss (%)
Ancestries Reported - Ukrainian (%)
Ancestries Reported - United States (%)
Ancestries Reported - Welsh (%)
Ancestries Reported - West Indian (%)
Ancestries Reported - Other (%)
Geographical mobility - Same house 1 year ago (%)
Geographical mobility - Same house 1 year ago (%) - White
Geographical mobility - Same house 1 year ago (%) - Black or African American
Geographical mobility - Same house 1 year ago (%) - Asian
Geographical mobility - Same house 1 year ago (%) - Hispanic or Latino
Geographical mobility - Same house 1 year ago (%) - American Indian and Alaska Native
Geographical mobility - Same house 1 year ago (%) - Multirace
Geographical mobility - Same house 1 year ago (%) - Other Race
Geographical mobility - Moved within same county (%)
Geographical mobility - Moved within same county (%) - White
Geographical mobility - Moved within same county (%) - Black or African American
Geographical mobility - Moved within same county (%) - Asian
Geographical mobility - Moved within same county (%) - Hispanic or Latino
Geographical mobility - Moved within same county (%) - American Indian and Alaska Native
Geographical mobility - Moved within same county (%) - Multirace
Geographical mobility - Moved within same county (%) - Other Race
Geographical mobility - Moved from different county within same state (%)
Geographical mobility - Moved from different county within same state (%) - White
Geographical mobility - Moved from different county within same state (%) - Black or African American
Geographical mobility - Moved from different county within same state (%) - Asian
Geographical mobility - Moved from different county within same state (%) - Hispanic or Latino
Geographical mobility - Moved from different county within same state (%) - American Indian and Alaska Native
Geographical mobility - Moved from different county within same state (%) - Multirace
Geographical mobility - Moved from different county within same state (%) - Other Race
Geographical mobility - Moved from different state (%)
Geographical mobility - Moved from different state (%) - White
Geographical mobility - Moved from different state (%) - Black or African American
Geographical mobility - Moved from different state (%) - Asian
Geographical mobility - Moved from different state (%) - Hispanic or Latino
Geographical mobility - Moved from different state (%) - American Indian and Alaska Native
Geographical mobility - Moved from different state (%) - Multirace
Geographical mobility - Moved from different state (%) - Other Race
Geographical mobility - Moved from abroad (%)
Geographical mobility - Moved from abroad (%) - White
Geographical mobility - Moved from abroad (%) - Black or African American
Geographical mobility - Moved from abroad (%) - Asian
Geographical mobility - Moved from abroad (%) - Hispanic or Latino
Geographical mobility - Moved from abroad (%) - American Indian and Alaska Native
Geographical mobility - Moved from abroad (%) - Multirace
Geographical mobility - Moved from abroad (%) - Other Race
Place of birth for the foreign-born population - Ireland (%)
Place of birth for the foreign-born population - Denmark (%)
Place of birth for the foreign-born population - Norway (%)
Place of birth for the foreign-born population - Sweden (%)
Place of birth for the foreign-born population - United Kingdom (%)
Place of birth for the foreign-born population - England (%)
Place of birth for the foreign-born population - Scotland (%)
Place of birth for the foreign-born population - Other Northern Europe (%)
Place of birth for the foreign-born population - Austria (%)
Place of birth for the foreign-born population - Belgium (%)
Place of birth for the foreign-born population - France (%)
Place of birth for the foreign-born population - Germany (%)
Place of birth for the foreign-born population - Netherlands (%)
Place of birth for the foreign-born population - Switzerland (%)
Place of birth for the foreign-born population - Other Western Europe (%)
Place of birth for the foreign-born population - Greece (%)
Place of birth for the foreign-born population - Italy (%)
Place of birth for the foreign-born population - Portugal (%)
Place of birth for the foreign-born population - Spain (%)
Place of birth for the foreign-born population - Other Southern Europe (%)
Place of birth for the foreign-born population - Albania (%)
Place of birth for the foreign-born population - Belarus (%)
Place of birth for the foreign-born population - Bosnia and Herzegovina (%)
Place of birth for the foreign-born population - Bulgaria (%)
Place of birth for the foreign-born population - Croatia (%)
Place of birth for the foreign-born population - Czechoslovakia (%)
Place of birth for the foreign-born population - Hungary (%)
Place of birth for the foreign-born population - Latvia (%)
Place of birth for the foreign-born population - Lithuania (%)
Place of birth for the foreign-born population - North Macedonia (Macedonia) (%)
Place of birth for the foreign-born population - Moldova (%)
Place of birth for the foreign-born population - Poland (%)
Place of birth for the foreign-born population - Romania (%)
Place of birth for the foreign-born population - Russia (%)
Place of birth for the foreign-born population - Serbia (%)
Place of birth for the foreign-born population - Ukraine (%)
Place of birth for the foreign-born population - Other Eastern Europe (%)
Place of birth for the foreign-born population - China (%)
Place of birth for the foreign-born population - Hong Kong (%)
Place of birth for the foreign-born population - Taiwan (%)
Place of birth for the foreign-born population - Japan (%)
Place of birth for the foreign-born population - Korea (%)
Place of birth for the foreign-born population - Other Eastern Asia (%)
Place of birth for the foreign-born population - Afghanistan (%)
Place of birth for the foreign-born population - Bangladesh (%)
Place of birth for the foreign-born population - India (%)
Place of birth for the foreign-born population - Iran (%)
Place of birth for the foreign-born population - Kazakhstan (%)
Place of birth for the foreign-born population - Nepal (%)
Place of birth for the foreign-born population - Pakistan (%)
Place of birth for the foreign-born population - Sri Lanka (%)
Place of birth for the foreign-born population - Uzbekistan (%)
Place of birth for the foreign-born population - Other South Central Asia (%)
Place of birth for the foreign-born population - Burma (%)
Place of birth for the foreign-born population - Cambodia (%)
Place of birth for the foreign-born population - Indonesia (%)
Place of birth for the foreign-born population - Laos (%)
Place of birth for the foreign-born population - Malaysia (%)
Place of birth for the foreign-born population - Philippines (%)
Place of birth for the foreign-born population - Singapore (%)
Place of birth for the foreign-born population - Thailand (%)
Place of birth for the foreign-born population - Vietnam (%)
Place of birth for the foreign-born population - Other South Eastern Asia (%)
Place of birth for the foreign-born population - Armenia (%)
Place of birth for the foreign-born population - Iraq (%)
Place of birth for the foreign-born population - Israel (%)
Place of birth for the foreign-born population - Jordan (%)
Place of birth for the foreign-born population - Kuwait (%)
Place of birth for the foreign-born population - Lebanon (%)
Place of birth for the foreign-born population - Saudi Arabia (%)
Place of birth for the foreign-born population - Syria (%)
Place of birth for the foreign-born population - Turkey (%)
Place of birth for the foreign-born population - Yemen (%)
Place of birth for the foreign-born population - Other Western Asia (%)
Place of birth for the foreign-born population - Eritrea (%)
Place of birth for the foreign-born population - Ethiopia (%)
Place of birth for the foreign-born population - Kenya (%)
Place of birth for the foreign-born population - Somalia (%)
Place of birth for the foreign-born population - Uganda (%)
Place of birth for the foreign-born population - Zimbabwe (%)
Place of birth for the foreign-born population - Other Eastern Africa (%)
Place of birth for the foreign-born population - Cameroon (%)
Place of birth for the foreign-born population - Congo (%)
Place of birth for the foreign-born population - Democratic Republic of Congo (Zaire) (%)
Place of birth for the foreign-born population - Other Middle Africa (%)
Place of birth for the foreign-born population - Egypt (%)
Place of birth for the foreign-born population - Morocco (%)
Place of birth for the foreign-born population - Sudan (%)
Place of birth for the foreign-born population - Other Northern Africa (%)
Place of birth for the foreign-born population - South Africa (%)
Place of birth for the foreign-born population - Other Southern Africa (%)
Place of birth for the foreign-born population - Cabo Verde (%)
Place of birth for the foreign-born population - Ghana (%)
Place of birth for the foreign-born population - Liberia (%)
Place of birth for the foreign-born population - Nigeria (%)
Place of birth for the foreign-born population - Senegal (%)
Place of birth for the foreign-born population - Sierra Leone (%)
Place of birth for the foreign-born population - Other Western Africa (%)
Place of birth for the foreign-born population - Australia (%)
Place of birth for the foreign-born population - New Zealand (%)
Place of birth for the foreign-born population - Fiji (%)
Place of birth for the foreign-born population - Micronesia (%)
Place of birth for the foreign-born population - Bahamas (%)
Place of birth for the foreign-born population - Barbados (%)
Place of birth for the foreign-born population - Cuba (%)
Place of birth for the foreign-born population - Dominica (%)
Place of birth for the foreign-born population - Dominican Republic (%)
Place of birth for the foreign-born population - Grenada (%)
Place of birth for the foreign-born population - Haiti (%)
Place of birth for the foreign-born population - Jamaica (%)
Place of birth for the foreign-born population - St. Vincent and the Grenadines (%)
Place of birth for the foreign-born population - Trinidad and Tobago (%)
Place of birth for the foreign-born population - West Indies (%)
Place of birth for the foreign-born population - Other Caribbean (%)
Place of birth for the foreign-born population - Belize (%)
Place of birth for the foreign-born population - Costa Rica (%)
Place of birth for the foreign-born population - El Salvador (%)
Place of birth for the foreign-born population - Guatemala (%)
Place of birth for the foreign-born population - Honduras (%)
Place of birth for the foreign-born population - Mexico (%)
Place of birth for the foreign-born population - Nicaragua (%)
Place of birth for the foreign-born population - Panama (%)
Place of birth for the foreign-born population - Other Central America (%)
Place of birth for the foreign-born population - Argentina (%)
Place of birth for the foreign-born population - Bolivia (%)
Place of birth for the foreign-born population - Brazil (%)
Place of birth for the foreign-born population - Chile (%)
Place of birth for the foreign-born population - Colombia (%)
Place of birth for the foreign-born population - Ecuador (%)
Place of birth for the foreign-born population - Guyana (%)
Place of birth for the foreign-born population - Peru (%)
Place of birth for the foreign-born population - Uruguay (%)
Place of birth for the foreign-born population - Venezuela (%)
Place of birth for the foreign-born population - Other South America (%)
Place of birth for the foreign-born population - Canada (%)
Place of birth for the foreign-born population - Other Northern America (%)
Place of birth for the foreign-born population - Other (%)
Latest news about races in Dothan, AL collected exclusively by city-data.com from local newspapers, TV, and radio stations
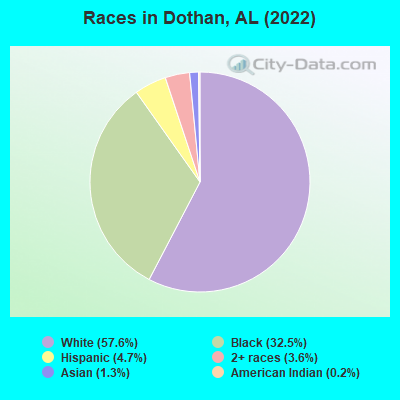
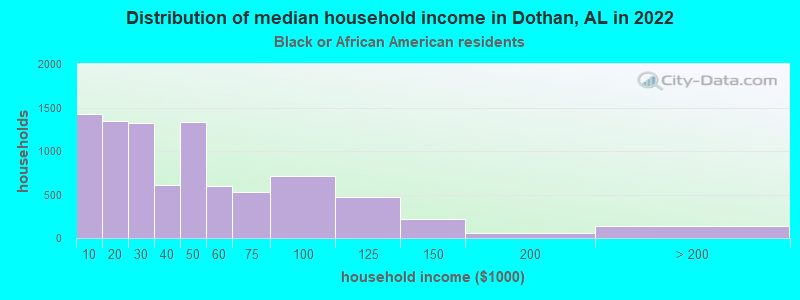
According to 2022 data, the most numerous races in Dothan, AL are White alone (40,853 residents), Black alone (23,554 residents), and Hispanic (2,711 residents). 95.5% of Dothan residents speak English at home. 2.9% of Dothan, AL residents are foreign-born (1.2% born in Latin America, 1.2% born in Asia, 0.3% born in Europe), which is 3.9% less than the foreign-born rate of 3.0% across the entire state of Alabama.
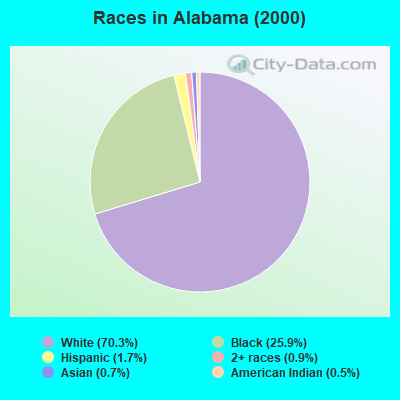
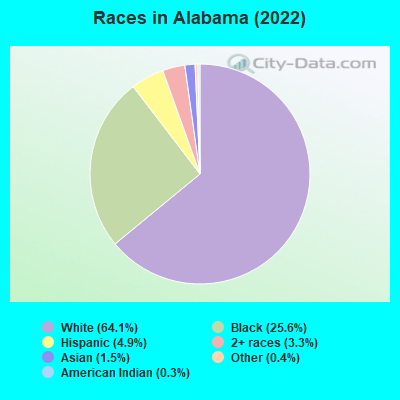
Race distribution in Dothan
2000 2022
3,125,819 70.3% White alone 1,150,076 25.9% Black alone 75,830 1.7% Hispanic 39,086 0.9% Two or more races 30,989 0.7% Asian alone 21,618 0.5% American Indian alone 2,623 0.06% Other race alone 1,059 0.02% Native Hawaiian and Other
3,250,182 64.1% White alone 1,296,500 25.6% Black alone 246,477 4.9% Hispanic 169,880 3.3% Two or more races 76,682 1.5% Asian alone 19,927 0.4% Other race alone 12,694 0.3% American Indian alone 1,954 0.04% Native Hawaiian and Other
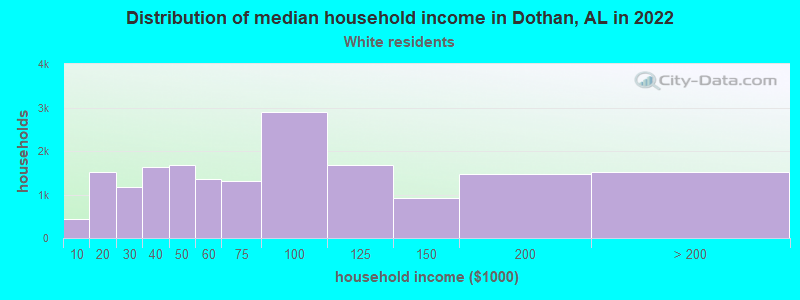
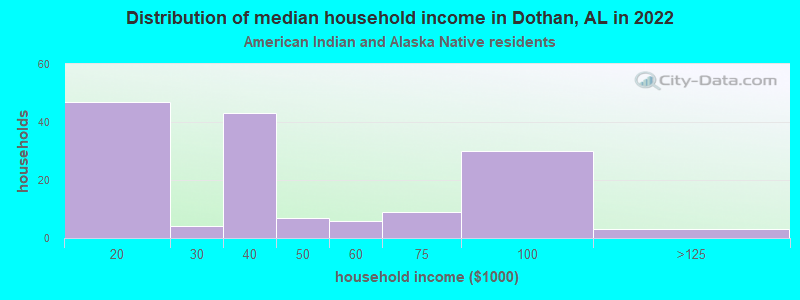
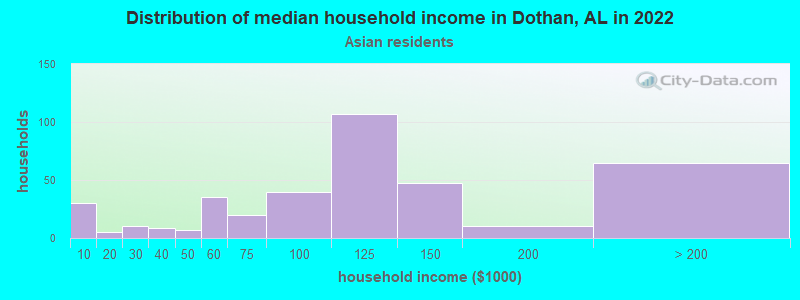
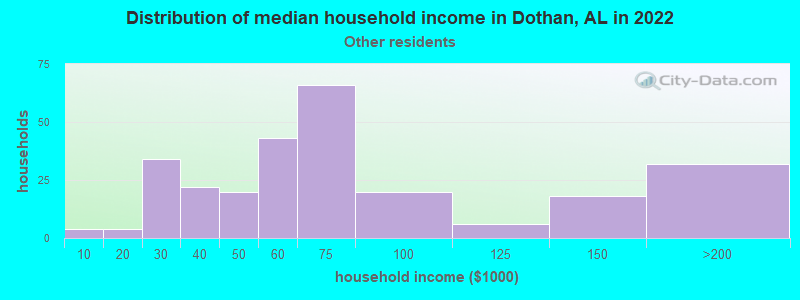
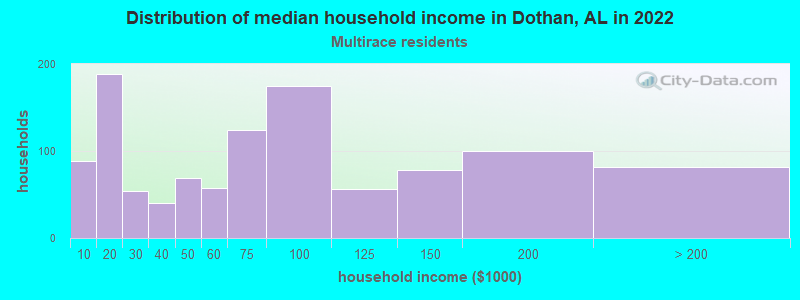
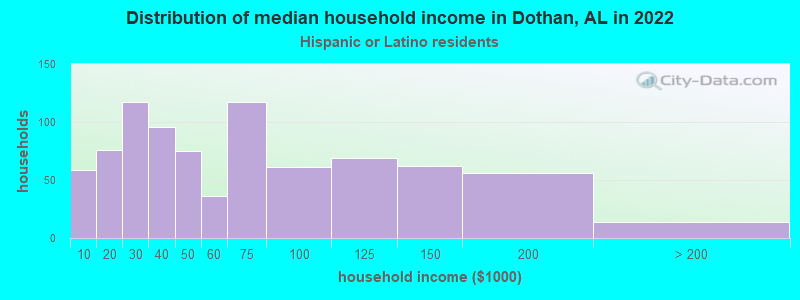
Income and house value in Dothan Median household income in 2022 $74,287 White non-Hispanic householders$33,415 Black householders$61,964 American Indian and Alaska Native householders$116,175 Asian householders$38,463 Native Hawaiian and other Pacific Islander householders$65,603 Some other race householders$42,543 Two or more races householders$39,262 Hispanic or Latino race householdersMedian 2022 house value $246,999 White Non-Hispanic householders$151,395 Black or African American householders$183,350 American Indian or Alaska Native householders $338,413 Asian householders$165,801 Some other race householders$261,929 Two or more races householders$345,223 Hispanic or Latino householders
Median age by race in Dothan
46.6 Median age for White residents44.8 48.0 34.9 Median age for Black or African American residents32.8 37.2 50.2 Median age for American Indian / Alaska Native residents39.4 Median age for Asian residents42.2 38.2 8.0 Median age for Native Hawaiian / Pacific Islander residents28.0 Median age for Other race residents27.1 60.5 22.6 Median age for Two or more races residents19.7 23.9 47.7 Median age for White alone residents46.4 48.9 31.1 Median age for Hispanic or Latino residents26.5 30.9
Owner/renter occupied households by race in Dothan
House owners and renters - White residents 12,616 73.3% Owner occupied4,599 26.7% Renter occupiedHouse owners and renters - Black or African American residents 3,088 33.2% Owner occupied6,206 66.8% Renter occupiedHouse owners and renters - American Indian / Alaska Native residents 18 49.5% Owner occupied19 50.5% Renter occupiedHouse owners and renters - Asian residents 153 72.7% Owner occupied57 27.3% Renter occupiedHouse owners and renters - Native Hawaiian / Pacific Islander residents 5 100.0% Renter occupiedHouse owners and renters - Other race residents 207 68.3% Owner occupied96 31.7% Renter occupiedHouse owners and renters - Two or more races residents 208 51.0% Owner occupied200 49.0% Renter occupiedHouse owners and renters - White alone residents 12,522 74.9% Owner occupied4,190 25.1% Renter occupiedHouse owners and renters - Hispanic or Latino residents 243 24.9% Owner occupied734 75.1% Renter occupied
Language usage in Dothan
English speakers - Total 95.5% of residents of Dothan speak English at home.
2.3% of residents speak Spanish at home 1,039 69.6% Speak English very well453 30.4% Speak English less than very well2.3% of residents speak other language at home 1,088 73.0% Speak English very well403 27.0% Speak English less than very well
English speakers - Born in the United States 97.2% of residents of Dothan speak English at home.
1.5% of residents speak Spanish at home 259 76.4% Speak English very well80 23.6% Speak English less than very well1.3% of residents speak other language at home 243 84.4% Speak English very well45 15.6% Speak English less than very well
English speakers - Native, born elsewhere 70.6% of residents of Dothan speak English at home.
19.2% of residents speak Spanish at home 97 70.3% Speak English very well41 29.7% Speak English less than very well10.6% of residents speak other language at home 63 82.9% Speak English very well13 17.1% Speak English less than very well
English speakers - Foreign-born 21.7% of residents of Dothan speak English at home.
33.3% of residents speak Spanish at home 443 63.3% Speak English very well257 36.7% Speak English less than very well45.7% of residents speak other language at home 685 71.4% Speak English very well275 28.6% Speak English less than very well
White (Caucasian) - Speak only English Native:
99.2% (37,057)Foreign-born:
16.4% (183)
White (Caucasian) - Speak another language Native:
1.0% (370)Foreign-born:
80.5% (899)
Black or African American - Speak only English Native:
98.8% (21,522)Foreign-born:
65.2% (101)
Black or African American - Speak another language Native:
1.3% (273)Foreign-born:
37.8% (59)
Asian - Speak only English Native:
48.3% (162)Foreign-born:
17.9% (93)
Asian - Speak another language Native:
49.0% (165)Foreign-born:
82.0% (428)
Other race - Speak only English Native:
75.8% (317)Foreign-born:
2.5% (7)
Other race - Speak another language Native:
37.3% (156)Foreign-born:
96.7% (266)
Two or more races - Speak only English Native:
81.3% (1,834)Foreign-born:
8.1% (31)
Two or more races - Speak another language Native:
27.8% (626)Foreign-born:
100.0% (381)
White alone - Speak only English Native:
98.8% (36,477)Foreign-born:
25.2% (148)
White alone - Speak another language Native:
1.2% (425)Foreign-born:
78.3% (461)
Hispanic or Latino - Speak only English Native:
100.0% (1,095)Foreign-born:
5.1% (60)
Hispanic or Latino - Speak another language Native:
7.8% (85)Foreign-born:
94.5% (1,109)
Foreign-born residents in Dothan 2,045 residents are foreign born (1.2% Latin America , 1.2% Asia , 0.3% Europe ).
This city:
2.9%Alabama:
100.0%
Marital status for residents in Dothan Marital status - White (Caucasian) population 15 years and over
Males 29.4% Never married56.5% Now married0.9% Separated3.2% Widowed10.0% DivorcedFemales 18.1% Never married50.1% Now married2.4% Separated13.5% Widowed15.9% DivorcedWomen who gave birth in the past 12 months Now married:
55.5% (212)Unmarried:
44.5% (170)
Women who did not give birth in the past 12 months Now married:
50.5% (4,130)Unmarried:
49.5% (4,049)
Marital status - Black or African American population 15 years and over
Males 52.7% Never married27.9% Now married2.4% Separated2.7% Widowed14.2% DivorcedFemales 48.9% Never married20.1% Now married3.5% Separated11.9% Widowed15.6% DivorcedWomen who gave birth in the past 12 months Now married:
28.5% (114)Unmarried:
71.5% (287)
Women who did not give birth in the past 12 months Now married:
21.8% (1,331)Unmarried:
78.2% (4,786)
Marital status - American Indian / Alaska Native population 15 years and over
Males 50.7% Never married32.0% Now married0.0% Separated0.0% Widowed17.3% DivorcedFemales 22.2% Never married58.0% Now married0.0% Separated0.0% Widowed19.8% DivorcedWomen who did not give birth in the past 12 months Now married:
33.3% (12)Unmarried:
66.7% (23)
Marital status - Asian population 15 years and over
Males 31.0% Never married54.9% Now married1.3% Separated4.7% Widowed8.2% DivorcedFemales 13.4% Never married63.7% Now married3.9% Separated7.2% Widowed11.9% DivorcedWomen who gave birth in the past 12 months Now married:
82.4% (15)Unmarried:
17.6% (3)
Women who did not give birth in the past 12 months Now married:
68.1% (152)Unmarried:
31.9% (71)
Marital status - Other race population 15 years and over
Males 49.2% Never married49.5% Now married0.0% Separated0.0% Widowed1.2% DivorcedFemales 6.4% Never married51.8% Now married0.0% Separated32.7% Widowed9.1% DivorcedWomen who did not give birth in the past 12 months Now married:
82.1% (43)Unmarried:
17.9% (9)
Marital status - Two or more races population 15 years and over
Males 55.2% Never married36.2% Now married1.1% Separated0.0% Widowed7.5% DivorcedFemales 48.4% Never married25.0% Now married9.0% Separated5.0% Widowed12.5% DivorcedWomen who gave birth in the past 12 months Now married:
47.4% (18)Unmarried:
52.6% (20)
Women who did not give birth in the past 12 months Now married:
26.7% (193)Unmarried:
73.3% (531)
Marital status - White alone, not Hispanic / Latino population 15 years and over
Males 28.7% Never married56.8% Now married1.0% Separated3.3% Widowed10.3% DivorcedFemales 17.6% Never married50.1% Now married2.4% Separated13.9% Widowed16.0% DivorcedWomen who gave birth in the past 12 months Now married:
62.8% (202)Unmarried:
37.2% (120)
Women who did not give birth in the past 12 months Now married:
50.6% (4,026)Unmarried:
49.4% (3,931)
Marital status - Hispanic or Latino population 15 years and over
Males 41.6% Never married53.1% Now married0.3% Separated0.0% Widowed5.0% DivorcedFemales 37.0% Never married44.0% Now married2.2% Separated6.3% Widowed10.5% DivorcedWomen who gave birth in the past 12 months Now married:
16.0% (13)Unmarried:
84.0% (70)
Women who did not give birth in the past 12 months Now married:
52.8% (232)Unmarried:
47.2% (207)
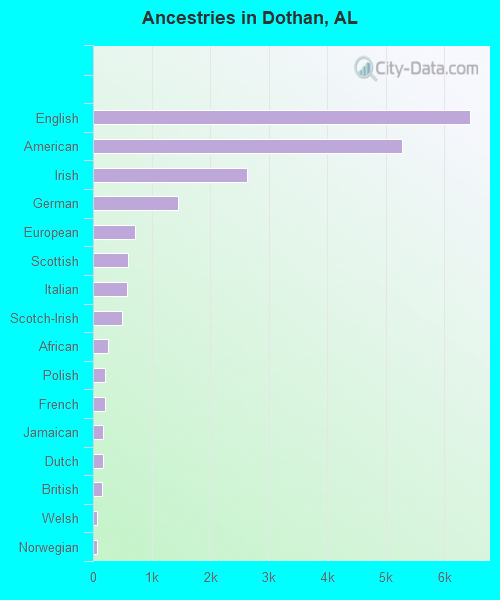
Ancestries in Dothan
8,954 21.1% American4,780 11.3% English1,704 4.0% Irish1,174 2.8% German966 2.3% European575 1.4% Scottish568 1.3% Scotch-Irish412 1.0% Italian234 0.6% French215 0.5% Polish209 0.5% African194 0.5% British89 0.2% Jamaican80 0.2% Nigerian78 0.2% Norwegian63 0.1% Dutch60 0.1% Welsh50 0.1% Palestinian44 0.1% Swedish42 0.10% Bermudan41 0.10% Eastern European41 0.10% Northern European39 0.09% French Canadian31 0.07% Greek31 0.07% Swiss30 0.07% Moroccan27 0.06% Haitian24 0.06% Lebanese24 0.06% Hungarian24 0.06% Danish20 0.05% Scandinavian16 0.04% Cajun16 0.04% Bahamian15 0.04% Israeli14 0.03% West Indian13 0.03% Canadian13 0.03% Russian12 0.03% Finnish11 0.03% Slovak11 0.03% Czech10 0.02% Slavic8 0.02% Pennsylvania German7 0.02% Portuguese6 0.01% Ukrainian6 0.01% Romanian5 0.01% Croatian5 0.01% Celtic5 0.01% Yugoslavian4 0.01% Kenyan4 0.01% Lithuanian4 0.01% Austrian3 0.01% Icelander3 0.01% Turkish
Geographical mobility in Dothan Same house 1 year ago 34,909 86.9% White (Caucasian)23,139 95.3% Black or African American138 94.6% American Indian / Alaska Native815 90.5% Asian29 60.8% Native Hawaiian / Pacific Islander593 79.3% Other race2,429 83.6% Two or more races35,618 88.0% White alone, not Hispanic / Latino1,865 73.7% Hispanic or LatinoMoved within same county 2,265 5.6% White / Caucasian578 2.4% Black or African American3 2.0% American Indian / Alaska Native29 3.2% Asian5 10.4% Native Hawaiian / Pacific Islander73 9.8% Other race271 9.3% Two or more races2,561 6.3% White alone, not Hispanic / Latino297 11.7% Hispanic or LatinoMoved within same state 800 2.0% White / Caucasian580 2.4% Black or African American9 6.0% American Indian / Alaska Native19 2.1% Asian39 5.3% Other race27 0.9% Two or more races921 2.3% White alone, not Hispanic / Latino115 4.5% Hispanic or LatinoMoved from different state 1,843 4.6% White / Caucasian297 1.2% Black or African American34 3.8% Asian24 3.3% Other race169 5.8% Two or more races1,282 3.2% White alone, not Hispanic / Latino210 8.3% Hispanic or LatinoMoved from abroad 391 1.0% White29 0.1% Black or African American15 1.7% Asian19 0.7% Two or more races90 0.2% White alone, not Hispanic / Latino55 2.2% Hispanic or Latino
Children Nativity (place of birth) in Dothan
Children under 6 years - Living with two parents Both parents native 2,164 99.9% Native3 0.1% Foreign-bornBoth parents foreign-born 63 90.9% Native6 9.1% Foreign-bornOne native, one foreign-born parent 151 100.0% NativeChildren under 6 years - Living with one parent Native parent 2,464 100.0% NativeForeign-born parent 29 100.0% NativeChildren 6 to 17 years - Living with two parents Both parents native 4,862 99.3% Native32 0.7% Foreign-bornBoth parents foreign-born 110 92.7% Native9 7.3% Foreign-bornOne native, one foreign-born parent 170 98.4% Native3 1.6% Foreign-bornChildren 6 to 17 years - Living with one parent Native parent 4,245 100.0% NativeForeign-born parent 131 67.0% Native64 33.0% Foreign-born
Grandparents responsible for own grandchildren in Dothan
Grandparents (30 to 59 years) White / Caucasian 170 61.5% Responsible for grandchildren106 38.5% Not responsible for grandchildrenBlack or African American 155 49.3% Responsible for grandchildren159 50.7% Not responsible for grandchildrenAsian 1 100.0% Responsible for grandchildrenTwo or more races 25 100.0% Responsible for grandchildrenWhite alone, not Hispanic / Latino 168 60.7% Responsible for grandchildren109 39.3% Not responsible for grandchildrenHispanic or Latino 3 16.5% Responsible for grandchildren16 83.5% Not responsible for grandchildrenGrandparents (60 years and over) White / Caucasian 249 55.3% Responsible for grandchildren202 44.7% Not responsible for grandchildrenBlack or African American 128 41.9% Responsible for grandchildren177 58.1% Not responsible for grandchildrenAsian 5 11.0% Responsible for grandchildren40 89.0% Not responsible for grandchildrenWhite alone, not Hispanic / Latino 251 55.0% Responsible for grandchildren205 45.0% Not responsible for grandchildrenHispanic or Latino 8 100.0% Not responsible for grandchildren