Races in East Los Angeles, California (CA) Detailed Stats
Data:
Races - White alone (%)
Races - White alone (% change since 2000)
Races - Black alone (%)
Races - Black alone (% change since 2000)
Races - American Indian alone (%)
Races - American Indian alone (% change since 2000)
Races - Asian alone (%)
Races - Asian alone (% change since 2000)
Races - Hispanic (%)
Races - Hispanic (% change since 2000)
Races - Native Hawaiian and Other Pacific Islander alone (%)
Races - Native Hawaiian and Other Pacific Islander alone (% change since 2000)
Races - Two or more races(%)
Races - Two or more races(% change since 2000)
Races - Other race alone (%)
Races - Other race alone (% change since 2000)
Racial diversity
Place of birth - Born in state of residence (%)
Place of birth - Born in state of residence (%) - White
Place of birth - Born in state of residence (%) - Black or African American
Place of birth - Born in state of residence (%) - Asian
Place of birth - Born in state of residence (%) - Hispanic or Latino
Place of birth - Born in state of residence (%) - American Indian and Alaska Native
Place of birth - Born in state of residence (%) - Multirace
Place of birth - Born in state of residence (%) - Other Race
Place of birth - Born in other state (%)
Place of birth - Born in other state (%) - White
Place of birth - Born in other state (%) - Black or African American
Place of birth - Born in other state (%) - Asian
Place of birth - Born in other state (%) - Hispanic or Latino
Place of birth - Born in other state (%) - American Indian and Alaska Native
Place of birth - Born in other state (%) - Multirace
Place of birth - Born in other state (%) - Other Race
Place of birth - Native, outside of US (%)
Place of birth - Native, outside of US (%) - White
Place of birth - Native, outside of US (%) - Black or African American
Place of birth - Native, outside of US (%) - Asian
Place of birth - Native, outside of US (%) - Hispanic or Latino
Place of birth - Native, outside of US (%) - American Indian and Alaska Native
Place of birth - Native, outside of US (%) - Multirace
Place of birth - Native, outside of US (%) - Other Race
Place of birth - Foreign born (%)
Place of birth - Foreign born (%) - White
Place of birth - Foreign born (%) - Black or African American
Place of birth - Foreign born (%) - Asian
Place of birth - Foreign born (%) - Hispanic or Latino
Place of birth - Foreign born (%) - American Indian and Alaska Native
Place of birth - Foreign born (%) - Multirace
Place of birth - Foreign born (%) - Other Race
Residents speaking English at home (%)
Residents speaking English at home - Born in the United States (%)
Residents speaking English at home - Native, born elsewhere (%)
Residents speaking English at home - Foreign born (%)
Residents speaking Spanish at home (%)
Residents speaking Spanish at home - Born in the United States (%)
Residents speaking Spanish at home - Native, born elsewhere (%)
Residents speaking Spanish at home - Foreign born (%)
Residents speaking other language at home (%)
Residents speaking other language at home - Born in the United States (%)
Residents speaking other language at home - Native, born elsewhere (%)
Residents speaking other language at home - Foreign born (%)
Marital status - Never married (%)
Marital status - Now married (%)
Marital status - Separated (%)
Marital status - Widowed (%)
Marital status - Divorced (%)
Ancestries Reported - Arab (%)
Ancestries Reported - Czech (%)
Ancestries Reported - Danish (%)
Ancestries Reported - Dutch (%)
Ancestries Reported - English (%)
Ancestries Reported - French (%)
Ancestries Reported - French Canadian (%)
Ancestries Reported - German (%)
Ancestries Reported - Greek (%)
Ancestries Reported - Hungarian (%)
Ancestries Reported - Irish (%)
Ancestries Reported - Italian (%)
Ancestries Reported - Lithuanian (%)
Ancestries Reported - Norwegian (%)
Ancestries Reported - Polish (%)
Ancestries Reported - Portuguese (%)
Ancestries Reported - Russian (%)
Ancestries Reported - Scotch-Irish (%)
Ancestries Reported - Scottish (%)
Ancestries Reported - Slovak (%)
Ancestries Reported - Subsaharan African (%)
Ancestries Reported - Swedish (%)
Ancestries Reported - Swiss (%)
Ancestries Reported - Ukrainian (%)
Ancestries Reported - United States (%)
Ancestries Reported - Welsh (%)
Ancestries Reported - West Indian (%)
Ancestries Reported - Other (%)
Geographical mobility - Same house 1 year ago (%)
Geographical mobility - Same house 1 year ago (%) - White
Geographical mobility - Same house 1 year ago (%) - Black or African American
Geographical mobility - Same house 1 year ago (%) - Asian
Geographical mobility - Same house 1 year ago (%) - Hispanic or Latino
Geographical mobility - Same house 1 year ago (%) - American Indian and Alaska Native
Geographical mobility - Same house 1 year ago (%) - Multirace
Geographical mobility - Same house 1 year ago (%) - Other Race
Geographical mobility - Moved within same county (%)
Geographical mobility - Moved within same county (%) - White
Geographical mobility - Moved within same county (%) - Black or African American
Geographical mobility - Moved within same county (%) - Asian
Geographical mobility - Moved within same county (%) - Hispanic or Latino
Geographical mobility - Moved within same county (%) - American Indian and Alaska Native
Geographical mobility - Moved within same county (%) - Multirace
Geographical mobility - Moved within same county (%) - Other Race
Geographical mobility - Moved from different county within same state (%)
Geographical mobility - Moved from different county within same state (%) - White
Geographical mobility - Moved from different county within same state (%) - Black or African American
Geographical mobility - Moved from different county within same state (%) - Asian
Geographical mobility - Moved from different county within same state (%) - Hispanic or Latino
Geographical mobility - Moved from different county within same state (%) - American Indian and Alaska Native
Geographical mobility - Moved from different county within same state (%) - Multirace
Geographical mobility - Moved from different county within same state (%) - Other Race
Geographical mobility - Moved from different state (%)
Geographical mobility - Moved from different state (%) - White
Geographical mobility - Moved from different state (%) - Black or African American
Geographical mobility - Moved from different state (%) - Asian
Geographical mobility - Moved from different state (%) - Hispanic or Latino
Geographical mobility - Moved from different state (%) - American Indian and Alaska Native
Geographical mobility - Moved from different state (%) - Multirace
Geographical mobility - Moved from different state (%) - Other Race
Geographical mobility - Moved from abroad (%)
Geographical mobility - Moved from abroad (%) - White
Geographical mobility - Moved from abroad (%) - Black or African American
Geographical mobility - Moved from abroad (%) - Asian
Geographical mobility - Moved from abroad (%) - Hispanic or Latino
Geographical mobility - Moved from abroad (%) - American Indian and Alaska Native
Geographical mobility - Moved from abroad (%) - Multirace
Geographical mobility - Moved from abroad (%) - Other Race
Place of birth for the foreign-born population - Ireland (%)
Place of birth for the foreign-born population - Denmark (%)
Place of birth for the foreign-born population - Norway (%)
Place of birth for the foreign-born population - Sweden (%)
Place of birth for the foreign-born population - United Kingdom (%)
Place of birth for the foreign-born population - England (%)
Place of birth for the foreign-born population - Scotland (%)
Place of birth for the foreign-born population - Other Northern Europe (%)
Place of birth for the foreign-born population - Austria (%)
Place of birth for the foreign-born population - Belgium (%)
Place of birth for the foreign-born population - France (%)
Place of birth for the foreign-born population - Germany (%)
Place of birth for the foreign-born population - Netherlands (%)
Place of birth for the foreign-born population - Switzerland (%)
Place of birth for the foreign-born population - Other Western Europe (%)
Place of birth for the foreign-born population - Greece (%)
Place of birth for the foreign-born population - Italy (%)
Place of birth for the foreign-born population - Portugal (%)
Place of birth for the foreign-born population - Spain (%)
Place of birth for the foreign-born population - Other Southern Europe (%)
Place of birth for the foreign-born population - Albania (%)
Place of birth for the foreign-born population - Belarus (%)
Place of birth for the foreign-born population - Bosnia and Herzegovina (%)
Place of birth for the foreign-born population - Bulgaria (%)
Place of birth for the foreign-born population - Croatia (%)
Place of birth for the foreign-born population - Czechoslovakia (%)
Place of birth for the foreign-born population - Hungary (%)
Place of birth for the foreign-born population - Latvia (%)
Place of birth for the foreign-born population - Lithuania (%)
Place of birth for the foreign-born population - North Macedonia (Macedonia) (%)
Place of birth for the foreign-born population - Moldova (%)
Place of birth for the foreign-born population - Poland (%)
Place of birth for the foreign-born population - Romania (%)
Place of birth for the foreign-born population - Russia (%)
Place of birth for the foreign-born population - Serbia (%)
Place of birth for the foreign-born population - Ukraine (%)
Place of birth for the foreign-born population - Other Eastern Europe (%)
Place of birth for the foreign-born population - China (%)
Place of birth for the foreign-born population - Hong Kong (%)
Place of birth for the foreign-born population - Taiwan (%)
Place of birth for the foreign-born population - Japan (%)
Place of birth for the foreign-born population - Korea (%)
Place of birth for the foreign-born population - Other Eastern Asia (%)
Place of birth for the foreign-born population - Afghanistan (%)
Place of birth for the foreign-born population - Bangladesh (%)
Place of birth for the foreign-born population - India (%)
Place of birth for the foreign-born population - Iran (%)
Place of birth for the foreign-born population - Kazakhstan (%)
Place of birth for the foreign-born population - Nepal (%)
Place of birth for the foreign-born population - Pakistan (%)
Place of birth for the foreign-born population - Sri Lanka (%)
Place of birth for the foreign-born population - Uzbekistan (%)
Place of birth for the foreign-born population - Other South Central Asia (%)
Place of birth for the foreign-born population - Burma (%)
Place of birth for the foreign-born population - Cambodia (%)
Place of birth for the foreign-born population - Indonesia (%)
Place of birth for the foreign-born population - Laos (%)
Place of birth for the foreign-born population - Malaysia (%)
Place of birth for the foreign-born population - Philippines (%)
Place of birth for the foreign-born population - Singapore (%)
Place of birth for the foreign-born population - Thailand (%)
Place of birth for the foreign-born population - Vietnam (%)
Place of birth for the foreign-born population - Other South Eastern Asia (%)
Place of birth for the foreign-born population - Armenia (%)
Place of birth for the foreign-born population - Iraq (%)
Place of birth for the foreign-born population - Israel (%)
Place of birth for the foreign-born population - Jordan (%)
Place of birth for the foreign-born population - Kuwait (%)
Place of birth for the foreign-born population - Lebanon (%)
Place of birth for the foreign-born population - Saudi Arabia (%)
Place of birth for the foreign-born population - Syria (%)
Place of birth for the foreign-born population - Turkey (%)
Place of birth for the foreign-born population - Yemen (%)
Place of birth for the foreign-born population - Other Western Asia (%)
Place of birth for the foreign-born population - Eritrea (%)
Place of birth for the foreign-born population - Ethiopia (%)
Place of birth for the foreign-born population - Kenya (%)
Place of birth for the foreign-born population - Somalia (%)
Place of birth for the foreign-born population - Uganda (%)
Place of birth for the foreign-born population - Zimbabwe (%)
Place of birth for the foreign-born population - Other Eastern Africa (%)
Place of birth for the foreign-born population - Cameroon (%)
Place of birth for the foreign-born population - Congo (%)
Place of birth for the foreign-born population - Democratic Republic of Congo (Zaire) (%)
Place of birth for the foreign-born population - Other Middle Africa (%)
Place of birth for the foreign-born population - Egypt (%)
Place of birth for the foreign-born population - Morocco (%)
Place of birth for the foreign-born population - Sudan (%)
Place of birth for the foreign-born population - Other Northern Africa (%)
Place of birth for the foreign-born population - South Africa (%)
Place of birth for the foreign-born population - Other Southern Africa (%)
Place of birth for the foreign-born population - Cabo Verde (%)
Place of birth for the foreign-born population - Ghana (%)
Place of birth for the foreign-born population - Liberia (%)
Place of birth for the foreign-born population - Nigeria (%)
Place of birth for the foreign-born population - Senegal (%)
Place of birth for the foreign-born population - Sierra Leone (%)
Place of birth for the foreign-born population - Other Western Africa (%)
Place of birth for the foreign-born population - Australia (%)
Place of birth for the foreign-born population - New Zealand (%)
Place of birth for the foreign-born population - Fiji (%)
Place of birth for the foreign-born population - Micronesia (%)
Place of birth for the foreign-born population - Bahamas (%)
Place of birth for the foreign-born population - Barbados (%)
Place of birth for the foreign-born population - Cuba (%)
Place of birth for the foreign-born population - Dominica (%)
Place of birth for the foreign-born population - Dominican Republic (%)
Place of birth for the foreign-born population - Grenada (%)
Place of birth for the foreign-born population - Haiti (%)
Place of birth for the foreign-born population - Jamaica (%)
Place of birth for the foreign-born population - St. Vincent and the Grenadines (%)
Place of birth for the foreign-born population - Trinidad and Tobago (%)
Place of birth for the foreign-born population - West Indies (%)
Place of birth for the foreign-born population - Other Caribbean (%)
Place of birth for the foreign-born population - Belize (%)
Place of birth for the foreign-born population - Costa Rica (%)
Place of birth for the foreign-born population - El Salvador (%)
Place of birth for the foreign-born population - Guatemala (%)
Place of birth for the foreign-born population - Honduras (%)
Place of birth for the foreign-born population - Mexico (%)
Place of birth for the foreign-born population - Nicaragua (%)
Place of birth for the foreign-born population - Panama (%)
Place of birth for the foreign-born population - Other Central America (%)
Place of birth for the foreign-born population - Argentina (%)
Place of birth for the foreign-born population - Bolivia (%)
Place of birth for the foreign-born population - Brazil (%)
Place of birth for the foreign-born population - Chile (%)
Place of birth for the foreign-born population - Colombia (%)
Place of birth for the foreign-born population - Ecuador (%)
Place of birth for the foreign-born population - Guyana (%)
Place of birth for the foreign-born population - Peru (%)
Place of birth for the foreign-born population - Uruguay (%)
Place of birth for the foreign-born population - Venezuela (%)
Place of birth for the foreign-born population - Other South America (%)
Place of birth for the foreign-born population - Canada (%)
Place of birth for the foreign-born population - Other Northern America (%)
Place of birth for the foreign-born population - Other (%)
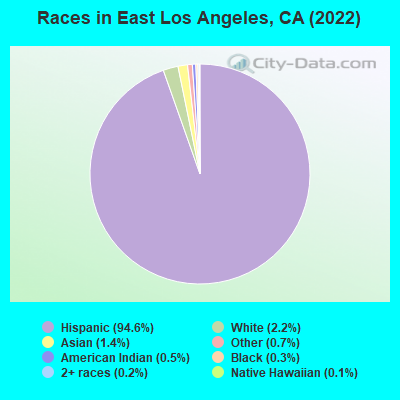
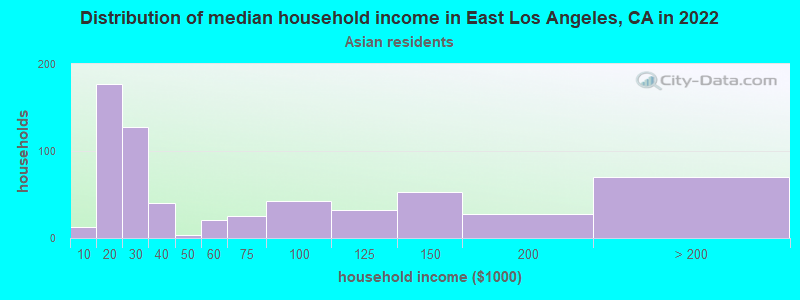
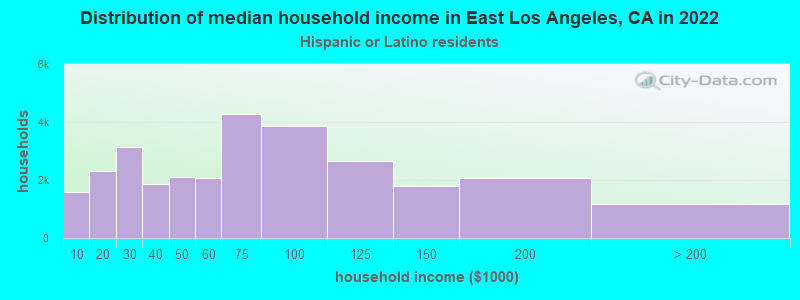
According to 2022 data, the most numerous races in East Los Angeles, CA are Hispanic (118,627 residents), White alone (2,334 residents), and Asian alone (1,364 residents). 11.1% of East Los Angeles residents speak English at home. 40.4% of East Los Angeles, CA residents are foreign-born (38.8% born in Latin America), which is 35.6% greater than the foreign-born rate of 26.0% across the entire state of California.
Race distribution in East Los Angeles
2000 2022
15,816,790 46.7% White alone 10,966,556 32.4% Hispanic 3,648,860 10.8% Asian alone 2,181,926 6.4% Black alone 903,115 2.7% Two or more races 178,984 0.5% American Indian alone 103,736 0.3% Native Hawaiian and Other 71,681 0.2% Other race alone
15,732,184 40.3% Hispanic 13,160,426 33.7% White alone 5,957,867 15.3% Asian alone 2,025,218 5.2% Black alone 1,663,222 4.3% Two or more races 251,618 0.6% Other race alone 135,777 0.3% Native Hawaiian and Other 103,030 0.3% American Indian alone
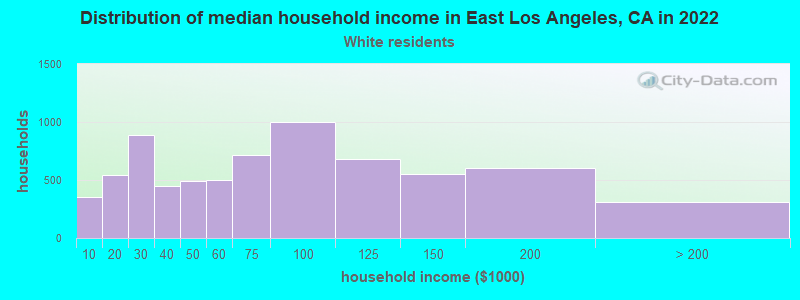
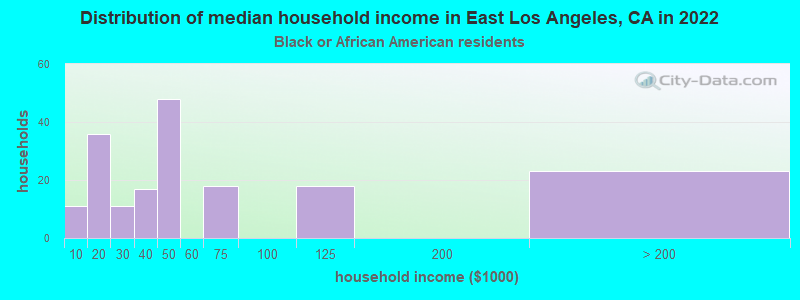
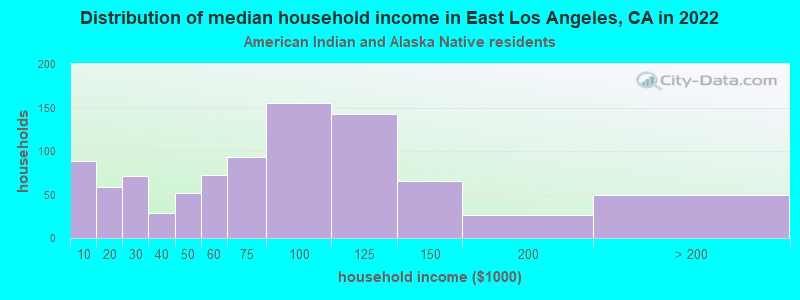
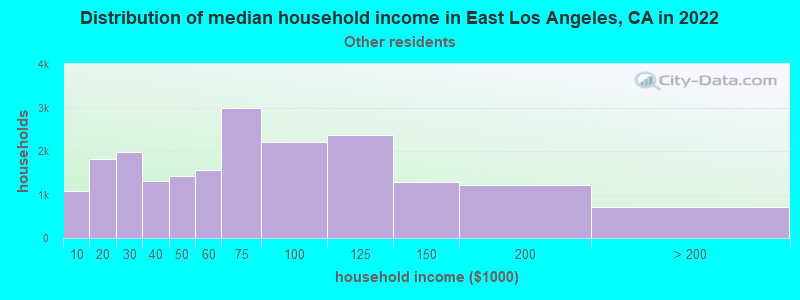
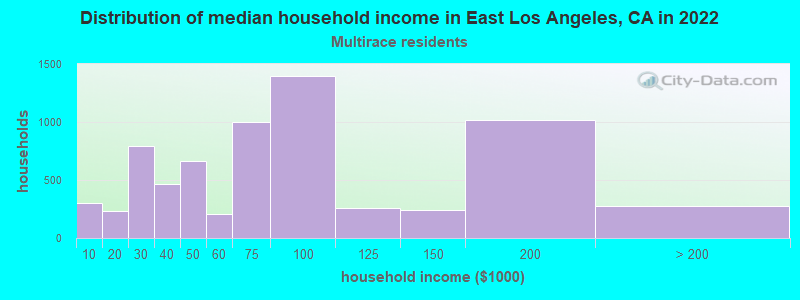
Income and house value in East Los Angeles Median household income in 2022 $98,585 White non-Hispanic householders$53,159 Black householders$86,166 American Indian and Alaska Native householders$25,536 Asian householders$147,801 Native Hawaiian and other Pacific Islander householders$66,192 Some other race householders$73,541 Two or more races householders$67,973 Hispanic or Latino race householdersMedian 2022 house value $549,612 White Non-Hispanic householders$539,894 Black or African American householders$544,933 American Indian or Alaska Native householders $566,889 Asian householders$404,920 Native Hawaiian and other Pacific Islander householders$557,171 Some other race householders$569,408 Two or more races householders$561,130 Hispanic or Latino householders
Median age by race in East Los Angeles
33.2 Median age for White residents32.6 34.2 33.5 Median age for Black or African American residents50.1 Median age for American Indian / Alaska Native residents38.7 56.6 53.4 Median age for Asian residents37.0 69.9 48.3 Median age for Native Hawaiian / Pacific Islander residents50.3 19.6 33.2 Median age for Other race residents31.8 34.4 60.2 Median age for Two or more races residents59.6 77.9 32.1 Median age for White alone residents36.6 29.9 33.0 Median age for Hispanic or Latino residents32.1 34.3
Owner/renter occupied households by race in East Los Angeles
House owners and renters - White residents 6,315 43.0% Owner occupied8,367 57.0% Renter occupiedHouse owners and renters - Black or African American residents 11 8.4% Owner occupied121 91.6% Renter occupiedHouse owners and renters - American Indian / Alaska Native residents 159 40.1% Owner occupied237 59.9% Renter occupiedHouse owners and renters - Asian residents 572 67.6% Owner occupied274 32.4% Renter occupiedHouse owners and renters - Native Hawaiian / Pacific Islander residents 6 100.0% Owner occupiedHouse owners and renters - Other race residents 4,414 31.8% Owner occupied9,464 68.2% Renter occupiedHouse owners and renters - Two or more races residents 848 54.3% Owner occupied713 45.7% Renter occupiedHouse owners and renters - White alone residents 251 43.3% Owner occupied328 56.7% Renter occupiedHouse owners and renters - Hispanic or Latino residents 11,953 38.8% Owner occupied18,843 61.2% Renter occupied
Language usage in East Los Angeles
English speakers - Total 11.1% of residents of East Los Angeles speak English at home.
86.2% of residents speak Spanish at home 55,799 57.0% Speak English very well42,127 43.0% Speak English less than very well1.1% of residents speak other language at home 602 48.7% Speak English very well635 51.3% Speak English less than very well
English speakers - Born in the United States 33.0% of residents of East Los Angeles speak English at home.
65.3% of residents speak Spanish at home 1,236 60.9% Speak English very well794 39.1% Speak English less than very well0.7% of residents speak other language at home 18 81.8% Speak English very well4 18.2% Speak English less than very well
English speakers - Native, born elsewhere 14.3% of residents of East Los Angeles speak English at home.
85.7% of residents speak Spanish at home 433 48.7% Speak English very well457 51.3% Speak English less than very well2.2% of residents speak other language at home 23 100.0% Speak English very well
English speakers - Foreign-born 3.1% of residents of East Los Angeles speak English at home.
91.2% of residents speak Spanish at home 9,294 21.4% Speak English very well34,115 78.6% Speak English less than very well1.9% of residents speak other language at home 306 33.9% Speak English very well597 66.1% Speak English less than very well
White (Caucasian) - Speak only English Native:
27.5% (8,971)Foreign-born:
4.0% (647)
White (Caucasian) - Speak another language Native:
55.8% (18,215)Foreign-born:
91.7% (14,896)
Black or African American - Speak only English Native:
77.6% (293)Foreign-born:
36.6% (59)
Black or African American - Speak another language Native:
27.2% (103)Foreign-born:
63.0% (102)
American Indian / Alaska Native - Speak only English Native:
41.7% (360)Foreign-born:
4.4% (19)
American Indian / Alaska Native - Speak another language Native:
71.0% (613)Foreign-born:
95.6% (402)
Asian - Speak only English Native:
33.4% (272)Foreign-born:
5.7% (50)
Asian - Speak another language Native:
65.0% (529)Foreign-born:
93.7% (820)
Other race - Speak only English Native:
12.2% (3,522)Foreign-born:
4.2% (936)
Other race - Speak another language Native:
85.2% (24,649)Foreign-born:
95.4% (21,228)
Two or more races - Speak only English Native:
29.7% (892)Foreign-born:
4.0% (127)
Two or more races - Speak another language Native:
100.0% (3,003)Foreign-born:
100.0% (3,210)
White alone - Speak only English Native:
76.1% (1,338)Foreign-born:
10.2% (40)
White alone - Speak another language Native:
24.8% (436)Foreign-born:
90.7% (350)
Hispanic or Latino - Speak only English Native:
20.6% (13,735)Foreign-born:
4.0% (1,728)
Hispanic or Latino - Speak another language Native:
77.6% (51,670)Foreign-born:
95.6% (40,998)
Foreign-born residents in East Los Angeles 48,797 residents are foreign born (38.8% Latin America ).
This city:
40.4%California:
100.0%
Marital status for residents in East Los Angeles Marital status - White (Caucasian) population 15 years and over
Males 52.6% Never married38.5% Now married1.6% Separated2.6% Widowed4.7% DivorcedFemales 48.6% Never married34.7% Now married3.2% Separated7.8% Widowed5.6% DivorcedWomen who gave birth in the past 12 months Now married:
30.2% (214)Unmarried:
69.8% (494)
Women who did not give birth in the past 12 months Now married:
28.2% (3,751)Unmarried:
71.8% (9,561)
Marital status - Black or African American population 15 years and over
Males 44.1% Never married50.6% Now married0.0% Separated0.0% Widowed5.3% DivorcedFemales 65.8% Never married9.8% Now married1.5% Separated0.0% Widowed22.9% DivorcedWomen who did not give birth in the past 12 months Now married:
11.6% (28)Unmarried:
88.4% (212)
Marital status - American Indian / Alaska Native population 15 years and over
Males 45.6% Never married16.8% Now married7.0% Separated0.0% Widowed30.7% DivorcedFemales 45.2% Never married25.0% Now married6.7% Separated18.8% Widowed4.3% DivorcedWomen who did not give birth in the past 12 months Now married:
27.9% (89)Unmarried:
72.1% (230)
Marital status - Asian population 15 years and over
Males 42.2% Never married44.3% Now married0.0% Separated2.3% Widowed11.2% DivorcedFemales 34.9% Never married37.7% Now married1.8% Separated11.0% Widowed14.7% DivorcedWomen who gave birth in the past 12 months Now married:
56.8% (21)Unmarried:
43.2% (16)
Women who did not give birth in the past 12 months Now married:
35.3% (131)Unmarried:
64.7% (240)
Marital status - Native Hawaiian / Pacific Islander population 15 years and over
Males 33.3% Never married40.0% Now married0.0% Separated26.7% Widowed0.0% DivorcedFemales 30.0% Never married70.0% Now married0.0% Separated0.0% Widowed0.0% DivorcedWomen who did not give birth in the past 12 months Now married:
0.0% (0)Unmarried:
100.0% (3)
Marital status - Other race population 15 years and over
Males 54.1% Never married39.5% Now married1.5% Separated0.5% Widowed4.3% DivorcedFemales 49.2% Never married33.7% Now married4.4% Separated5.6% Widowed7.0% DivorcedWomen who gave birth in the past 12 months Now married:
23.7% (222)Unmarried:
76.3% (714)
Women who did not give birth in the past 12 months Now married:
33.2% (4,597)Unmarried:
66.8% (9,254)
Marital status - Two or more races population 15 years and over
Males 55.2% Never married30.3% Now married2.8% Separated1.6% Widowed10.0% DivorcedFemales 38.6% Never married27.0% Now married4.1% Separated9.8% Widowed20.5% DivorcedWomen who gave birth in the past 12 months Now married:
35.3% (18)Unmarried:
64.7% (32)
Women who did not give birth in the past 12 months Now married:
25.3% (279)Unmarried:
74.7% (827)
Marital status - White alone, not Hispanic / Latino population 15 years and over
Males 38.9% Never married48.9% Now married1.7% Separated5.0% Widowed5.4% DivorcedFemales 34.8% Never married41.9% Now married7.6% Separated8.4% Widowed7.4% DivorcedWomen who gave birth in the past 12 months Now married:
78.6% (20)Unmarried:
21.4% (5)
Women who did not give birth in the past 12 months Now married:
64.1% (353)Unmarried:
35.9% (198)
Marital status - Hispanic or Latino population 15 years and over
Males 53.1% Never married38.1% Now married1.9% Separated1.9% Widowed5.1% DivorcedFemales 48.0% Never married34.1% Now married3.7% Separated7.5% Widowed6.7% DivorcedWomen who gave birth in the past 12 months Now married:
27.1% (474)Unmarried:
72.9% (1,274)
Women who did not give birth in the past 12 months Now married:
30.3% (8,831)Unmarried:
69.7% (20,344)
Ancestries in East Los Angeles
622 0.6% American136 0.1% German80 0.08% English61 0.06% African59 0.06% Italian51 0.05% European47 0.05% Irish45 0.05% Ukrainian38 0.04% Portuguese34 0.03% Belizean33 0.03% Armenian33 0.03% West Indian25 0.03% Eastern European19 0.02% Brazilian15 0.02% Syrian13 0.01% Russian11 0.01% Egyptian11 0.01% Lithuanian9 0.01% French9 0.01% Greek9 0.01% Iranian6 0.01% Hungarian5 0.01% Australian5 0.01% Scotch-Irish5 0.01% Jamaican
Geographical mobility in East Los Angeles Same house 1 year ago 43,754 96.7% White (Caucasian)449 79.9% Black or African American1,259 98.4% American Indian / Alaska Native1,306 89.4% Asian26 74.3% Native Hawaiian / Pacific Islander66,204 99.8% Other race5,081 96.8% Two or more races2,106 90.2% White alone, not Hispanic / Latino115,637 98.1% Hispanic or LatinoMoved within same county 1,620 3.6% White / Caucasian46 8.1% Black or African American33 2.6% American Indian / Alaska Native144 9.9% Asian6 15.7% Native Hawaiian / Pacific Islander1,016 1.5% Other race310 5.9% Two or more races206 8.8% White alone, not Hispanic / Latino2,925 2.5% Hispanic or LatinoMoved within same state 65 0.1% White / Caucasian26 4.7% Black or African American8 0.7% American Indian / Alaska Native10 0.7% Asian34 0.1% Other race8 0.1% Two or more races6 0.2% White alone, not Hispanic / Latino161 0.1% Hispanic or LatinoMoved from different state 70 0.2% White / Caucasian50 8.9% Black or African American9 0.7% American Indian / Alaska Native4 9.9% Native Hawaiian / Pacific Islander94 0.1% Other race18 0.8% White alone, not Hispanic / Latino169 0.1% Hispanic or LatinoMoved from abroad 54 0.1% White5 0.3% Asian62 0.1% Other race152 0.1% Hispanic or Latino
Children Nativity (place of birth) in East Los Angeles
Children under 6 years - Living with two parents Both parents native 891 100.0% NativeBoth parents foreign-born 1,390 100.0% NativeOne native, one foreign-born parent 904 100.0% NativeChildren under 6 years - Living with one parent Native parent 3,814 100.0% NativeForeign-born parent 1,942 100.0% NativeChildren 6 to 17 years - Living with two parents Both parents native 1,563 100.0% NativeBoth parents foreign-born 4,410 86.1% Native711 13.9% Foreign-bornOne native, one foreign-born parent 2,694 99.3% Native20 0.7% Foreign-bornChildren 6 to 17 years - Living with one parent Native parent 4,817 100.0% NativeForeign-born parent 5,000 52.0% Native4,619 48.0% Foreign-born
Grandparents responsible for own grandchildren in East Los Angeles
Grandparents (30 to 59 years) White / Caucasian 119 15.8% Responsible for grandchildren635 84.2% Not responsible for grandchildrenAmerican Indian / Alaska Native 34 100.0% Not responsible for grandchildrenAsian 31 100.0% Not responsible for grandchildrenOther race 151 15.1% Responsible for grandchildren847 84.9% Not responsible for grandchildrenTwo or more races 25 16.0% Responsible for grandchildren130 84.0% Not responsible for grandchildrenWhite alone, not Hispanic / Latino 9 85.3% Responsible for grandchildren2 14.7% Not responsible for grandchildrenHispanic or Latino 208 8.1% Responsible for grandchildren2,345 91.9% Not responsible for grandchildrenGrandparents (60 years and over) White / Caucasian 235 14.0% Responsible for grandchildren1,443 86.0% Not responsible for grandchildrenAmerican Indian / Alaska Native 35 100.0% Not responsible for grandchildrenAsian 32 100.0% Not responsible for grandchildrenOther race 135 11.4% Responsible for grandchildren1,044 88.6% Not responsible for grandchildrenTwo or more races 88 100.0% Not responsible for grandchildrenWhite alone, not Hispanic / Latino 76 100.0% Not responsible for grandchildrenHispanic or Latino 628 18.9% Responsible for grandchildren2,687 81.1% Not responsible for grandchildren