Races in Eden Prairie, Minnesota (MN) Detailed Stats
Data:
Races - White alone (%)
Races - White alone (% change since 2000)
Races - Black alone (%)
Races - Black alone (% change since 2000)
Races - American Indian alone (%)
Races - American Indian alone (% change since 2000)
Races - Asian alone (%)
Races - Asian alone (% change since 2000)
Races - Hispanic (%)
Races - Hispanic (% change since 2000)
Races - Native Hawaiian and Other Pacific Islander alone (%)
Races - Native Hawaiian and Other Pacific Islander alone (% change since 2000)
Races - Two or more races(%)
Races - Two or more races(% change since 2000)
Races - Other race alone (%)
Races - Other race alone (% change since 2000)
Racial diversity
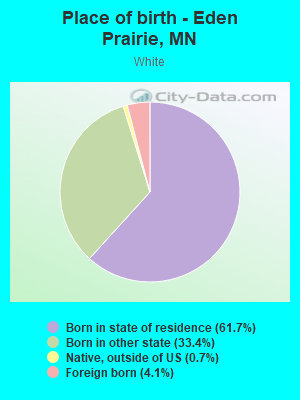
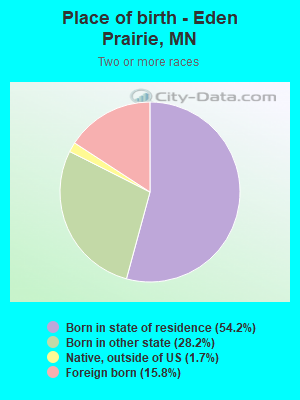
Place of birth - Born in state of residence (%)
Place of birth - Born in state of residence (%) - White
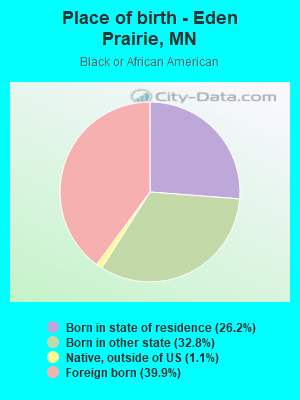
Place of birth - Born in state of residence (%) - Black or African American
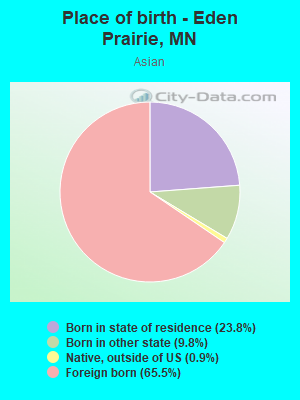
Place of birth - Born in state of residence (%) - Asian
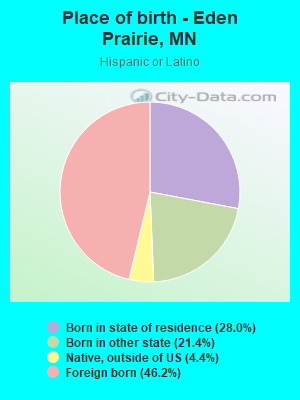
Place of birth - Born in state of residence (%) - Hispanic or Latino
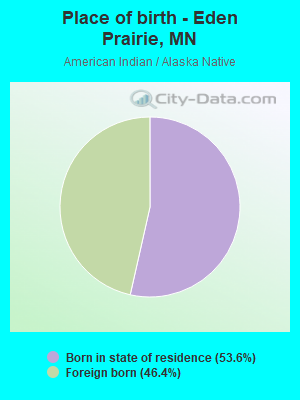
Place of birth - Born in state of residence (%) - American Indian and Alaska Native
Place of birth - Born in state of residence (%) - Multirace
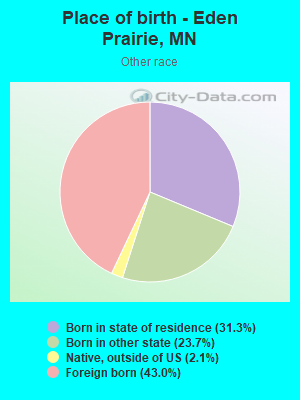
Place of birth - Born in state of residence (%) - Other Race
Place of birth - Born in other state (%)
Place of birth - Born in other state (%) - White
Place of birth - Born in other state (%) - Black or African American
Place of birth - Born in other state (%) - Asian
Place of birth - Born in other state (%) - Hispanic or Latino
Place of birth - Born in other state (%) - American Indian and Alaska Native
Place of birth - Born in other state (%) - Multirace
Place of birth - Born in other state (%) - Other Race
Place of birth - Native, outside of US (%)
Place of birth - Native, outside of US (%) - White
Place of birth - Native, outside of US (%) - Black or African American
Place of birth - Native, outside of US (%) - Asian
Place of birth - Native, outside of US (%) - Hispanic or Latino
Place of birth - Native, outside of US (%) - American Indian and Alaska Native
Place of birth - Native, outside of US (%) - Multirace
Place of birth - Native, outside of US (%) - Other Race
Place of birth - Foreign born (%)
Place of birth - Foreign born (%) - White
Place of birth - Foreign born (%) - Black or African American
Place of birth - Foreign born (%) - Asian
Place of birth - Foreign born (%) - Hispanic or Latino
Place of birth - Foreign born (%) - American Indian and Alaska Native
Place of birth - Foreign born (%) - Multirace
Place of birth - Foreign born (%) - Other Race
Residents speaking English at home (%)
Residents speaking English at home - Born in the United States (%)
Residents speaking English at home - Native, born elsewhere (%)
Residents speaking English at home - Foreign born (%)
Residents speaking Spanish at home (%)
Residents speaking Spanish at home - Born in the United States (%)
Residents speaking Spanish at home - Native, born elsewhere (%)
Residents speaking Spanish at home - Foreign born (%)
Residents speaking other language at home (%)
Residents speaking other language at home - Born in the United States (%)
Residents speaking other language at home - Native, born elsewhere (%)
Residents speaking other language at home - Foreign born (%)
Marital status - Never married (%)
Marital status - Now married (%)
Marital status - Separated (%)
Marital status - Widowed (%)
Marital status - Divorced (%)
Ancestries Reported - Arab (%)
Ancestries Reported - Czech (%)
Ancestries Reported - Danish (%)
Ancestries Reported - Dutch (%)
Ancestries Reported - English (%)
Ancestries Reported - French (%)
Ancestries Reported - French Canadian (%)
Ancestries Reported - German (%)
Ancestries Reported - Greek (%)
Ancestries Reported - Hungarian (%)
Ancestries Reported - Irish (%)
Ancestries Reported - Italian (%)
Ancestries Reported - Lithuanian (%)
Ancestries Reported - Norwegian (%)
Ancestries Reported - Polish (%)
Ancestries Reported - Portuguese (%)
Ancestries Reported - Russian (%)
Ancestries Reported - Scotch-Irish (%)
Ancestries Reported - Scottish (%)
Ancestries Reported - Slovak (%)
Ancestries Reported - Subsaharan African (%)
Ancestries Reported - Swedish (%)
Ancestries Reported - Swiss (%)
Ancestries Reported - Ukrainian (%)
Ancestries Reported - United States (%)
Ancestries Reported - Welsh (%)
Ancestries Reported - West Indian (%)
Ancestries Reported - Other (%)
Geographical mobility - Same house 1 year ago (%)
Geographical mobility - Same house 1 year ago (%) - White
Geographical mobility - Same house 1 year ago (%) - Black or African American
Geographical mobility - Same house 1 year ago (%) - Asian
Geographical mobility - Same house 1 year ago (%) - Hispanic or Latino
Geographical mobility - Same house 1 year ago (%) - American Indian and Alaska Native
Geographical mobility - Same house 1 year ago (%) - Multirace
Geographical mobility - Same house 1 year ago (%) - Other Race
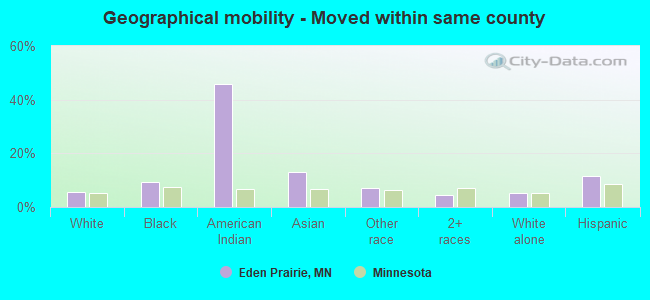
Geographical mobility - Moved within same county (%)
Geographical mobility - Moved within same county (%) - White
Geographical mobility - Moved within same county (%) - Black or African American
Geographical mobility - Moved within same county (%) - Asian
Geographical mobility - Moved within same county (%) - Hispanic or Latino
Geographical mobility - Moved within same county (%) - American Indian and Alaska Native
Geographical mobility - Moved within same county (%) - Multirace
Geographical mobility - Moved within same county (%) - Other Race
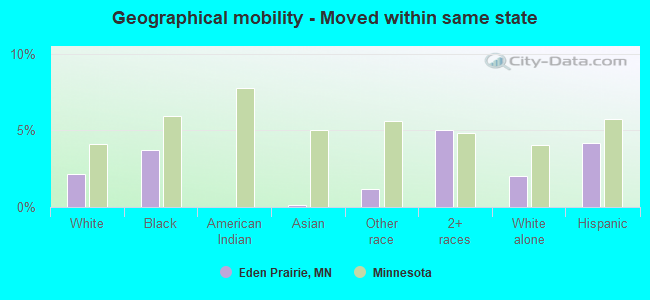
Geographical mobility - Moved from different county within same state (%)
Geographical mobility - Moved from different county within same state (%) - White
Geographical mobility - Moved from different county within same state (%) - Black or African American
Geographical mobility - Moved from different county within same state (%) - Asian
Geographical mobility - Moved from different county within same state (%) - Hispanic or Latino
Geographical mobility - Moved from different county within same state (%) - American Indian and Alaska Native
Geographical mobility - Moved from different county within same state (%) - Multirace
Geographical mobility - Moved from different county within same state (%) - Other Race
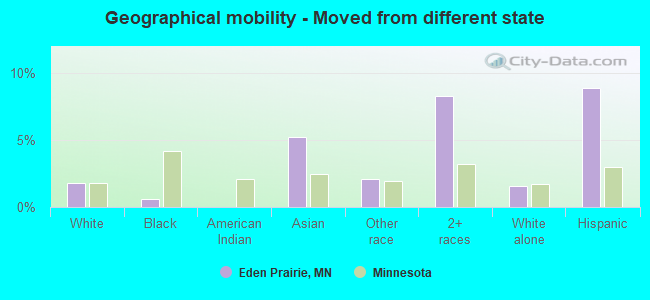
Geographical mobility - Moved from different state (%)
Geographical mobility - Moved from different state (%) - White
Geographical mobility - Moved from different state (%) - Black or African American
Geographical mobility - Moved from different state (%) - Asian
Geographical mobility - Moved from different state (%) - Hispanic or Latino
Geographical mobility - Moved from different state (%) - American Indian and Alaska Native
Geographical mobility - Moved from different state (%) - Multirace
Geographical mobility - Moved from different state (%) - Other Race
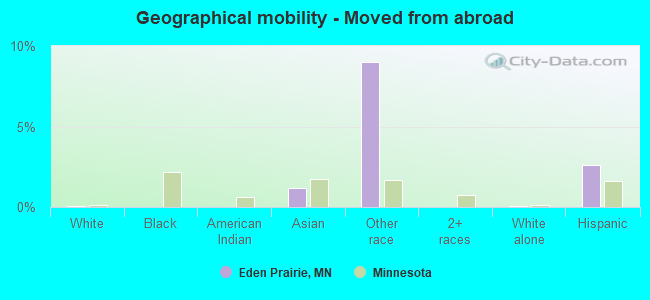
Geographical mobility - Moved from abroad (%)
Geographical mobility - Moved from abroad (%) - White
Geographical mobility - Moved from abroad (%) - Black or African American
Geographical mobility - Moved from abroad (%) - Asian
Geographical mobility - Moved from abroad (%) - Hispanic or Latino
Geographical mobility - Moved from abroad (%) - American Indian and Alaska Native
Geographical mobility - Moved from abroad (%) - Multirace
Geographical mobility - Moved from abroad (%) - Other Race
Place of birth for the foreign-born population - Ireland (%)
Place of birth for the foreign-born population - Denmark (%)
Place of birth for the foreign-born population - Norway (%)
Place of birth for the foreign-born population - Sweden (%)
Place of birth for the foreign-born population - United Kingdom (%)
Place of birth for the foreign-born population - England (%)
Place of birth for the foreign-born population - Scotland (%)
Place of birth for the foreign-born population - Other Northern Europe (%)
Place of birth for the foreign-born population - Austria (%)
Place of birth for the foreign-born population - Belgium (%)
Place of birth for the foreign-born population - France (%)
Place of birth for the foreign-born population - Germany (%)
Place of birth for the foreign-born population - Netherlands (%)
Place of birth for the foreign-born population - Switzerland (%)
Place of birth for the foreign-born population - Other Western Europe (%)
Place of birth for the foreign-born population - Greece (%)
Place of birth for the foreign-born population - Italy (%)
Place of birth for the foreign-born population - Portugal (%)
Place of birth for the foreign-born population - Spain (%)
Place of birth for the foreign-born population - Other Southern Europe (%)
Place of birth for the foreign-born population - Albania (%)
Place of birth for the foreign-born population - Belarus (%)
Place of birth for the foreign-born population - Bosnia and Herzegovina (%)
Place of birth for the foreign-born population - Bulgaria (%)
Place of birth for the foreign-born population - Croatia (%)
Place of birth for the foreign-born population - Czechoslovakia (%)
Place of birth for the foreign-born population - Hungary (%)
Place of birth for the foreign-born population - Latvia (%)
Place of birth for the foreign-born population - Lithuania (%)
Place of birth for the foreign-born population - North Macedonia (Macedonia) (%)
Place of birth for the foreign-born population - Moldova (%)
Place of birth for the foreign-born population - Poland (%)
Place of birth for the foreign-born population - Romania (%)
Place of birth for the foreign-born population - Russia (%)
Place of birth for the foreign-born population - Serbia (%)
Place of birth for the foreign-born population - Ukraine (%)
Place of birth for the foreign-born population - Other Eastern Europe (%)
Place of birth for the foreign-born population - China (%)
Place of birth for the foreign-born population - Hong Kong (%)
Place of birth for the foreign-born population - Taiwan (%)
Place of birth for the foreign-born population - Japan (%)
Place of birth for the foreign-born population - Korea (%)
Place of birth for the foreign-born population - Other Eastern Asia (%)
Place of birth for the foreign-born population - Afghanistan (%)
Place of birth for the foreign-born population - Bangladesh (%)
Place of birth for the foreign-born population - India (%)
Place of birth for the foreign-born population - Iran (%)
Place of birth for the foreign-born population - Kazakhstan (%)
Place of birth for the foreign-born population - Nepal (%)
Place of birth for the foreign-born population - Pakistan (%)
Place of birth for the foreign-born population - Sri Lanka (%)
Place of birth for the foreign-born population - Uzbekistan (%)
Place of birth for the foreign-born population - Other South Central Asia (%)
Place of birth for the foreign-born population - Burma (%)
Place of birth for the foreign-born population - Cambodia (%)
Place of birth for the foreign-born population - Indonesia (%)
Place of birth for the foreign-born population - Laos (%)
Place of birth for the foreign-born population - Malaysia (%)
Place of birth for the foreign-born population - Philippines (%)
Place of birth for the foreign-born population - Singapore (%)
Place of birth for the foreign-born population - Thailand (%)
Place of birth for the foreign-born population - Vietnam (%)
Place of birth for the foreign-born population - Other South Eastern Asia (%)
Place of birth for the foreign-born population - Armenia (%)
Place of birth for the foreign-born population - Iraq (%)
Place of birth for the foreign-born population - Israel (%)
Place of birth for the foreign-born population - Jordan (%)
Place of birth for the foreign-born population - Kuwait (%)
Place of birth for the foreign-born population - Lebanon (%)
Place of birth for the foreign-born population - Saudi Arabia (%)
Place of birth for the foreign-born population - Syria (%)
Place of birth for the foreign-born population - Turkey (%)
Place of birth for the foreign-born population - Yemen (%)
Place of birth for the foreign-born population - Other Western Asia (%)
Place of birth for the foreign-born population - Eritrea (%)
Place of birth for the foreign-born population - Ethiopia (%)
Place of birth for the foreign-born population - Kenya (%)
Place of birth for the foreign-born population - Somalia (%)
Place of birth for the foreign-born population - Uganda (%)
Place of birth for the foreign-born population - Zimbabwe (%)
Place of birth for the foreign-born population - Other Eastern Africa (%)
Place of birth for the foreign-born population - Cameroon (%)
Place of birth for the foreign-born population - Congo (%)
Place of birth for the foreign-born population - Democratic Republic of Congo (Zaire) (%)
Place of birth for the foreign-born population - Other Middle Africa (%)
Place of birth for the foreign-born population - Egypt (%)
Place of birth for the foreign-born population - Morocco (%)
Place of birth for the foreign-born population - Sudan (%)
Place of birth for the foreign-born population - Other Northern Africa (%)
Place of birth for the foreign-born population - South Africa (%)
Place of birth for the foreign-born population - Other Southern Africa (%)
Place of birth for the foreign-born population - Cabo Verde (%)
Place of birth for the foreign-born population - Ghana (%)
Place of birth for the foreign-born population - Liberia (%)
Place of birth for the foreign-born population - Nigeria (%)
Place of birth for the foreign-born population - Senegal (%)
Place of birth for the foreign-born population - Sierra Leone (%)
Place of birth for the foreign-born population - Other Western Africa (%)
Place of birth for the foreign-born population - Australia (%)
Place of birth for the foreign-born population - New Zealand (%)
Place of birth for the foreign-born population - Fiji (%)
Place of birth for the foreign-born population - Micronesia (%)
Place of birth for the foreign-born population - Bahamas (%)
Place of birth for the foreign-born population - Barbados (%)
Place of birth for the foreign-born population - Cuba (%)
Place of birth for the foreign-born population - Dominica (%)
Place of birth for the foreign-born population - Dominican Republic (%)
Place of birth for the foreign-born population - Grenada (%)
Place of birth for the foreign-born population - Haiti (%)
Place of birth for the foreign-born population - Jamaica (%)
Place of birth for the foreign-born population - St. Vincent and the Grenadines (%)
Place of birth for the foreign-born population - Trinidad and Tobago (%)
Place of birth for the foreign-born population - West Indies (%)
Place of birth for the foreign-born population - Other Caribbean (%)
Place of birth for the foreign-born population - Belize (%)
Place of birth for the foreign-born population - Costa Rica (%)
Place of birth for the foreign-born population - El Salvador (%)
Place of birth for the foreign-born population - Guatemala (%)
Place of birth for the foreign-born population - Honduras (%)
Place of birth for the foreign-born population - Mexico (%)
Place of birth for the foreign-born population - Nicaragua (%)
Place of birth for the foreign-born population - Panama (%)
Place of birth for the foreign-born population - Other Central America (%)
Place of birth for the foreign-born population - Argentina (%)
Place of birth for the foreign-born population - Bolivia (%)
Place of birth for the foreign-born population - Brazil (%)
Place of birth for the foreign-born population - Chile (%)
Place of birth for the foreign-born population - Colombia (%)
Place of birth for the foreign-born population - Ecuador (%)
Place of birth for the foreign-born population - Guyana (%)
Place of birth for the foreign-born population - Peru (%)
Place of birth for the foreign-born population - Uruguay (%)
Place of birth for the foreign-born population - Venezuela (%)
Place of birth for the foreign-born population - Other South America (%)
Place of birth for the foreign-born population - Canada (%)
Place of birth for the foreign-born population - Other Northern America (%)
Place of birth for the foreign-born population - Other (%)
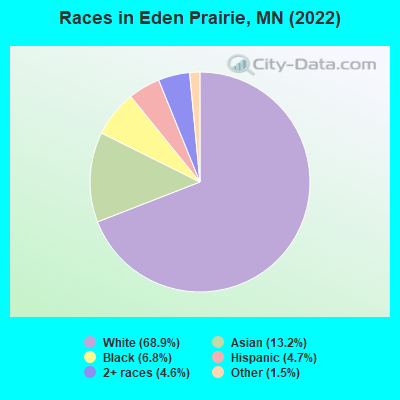
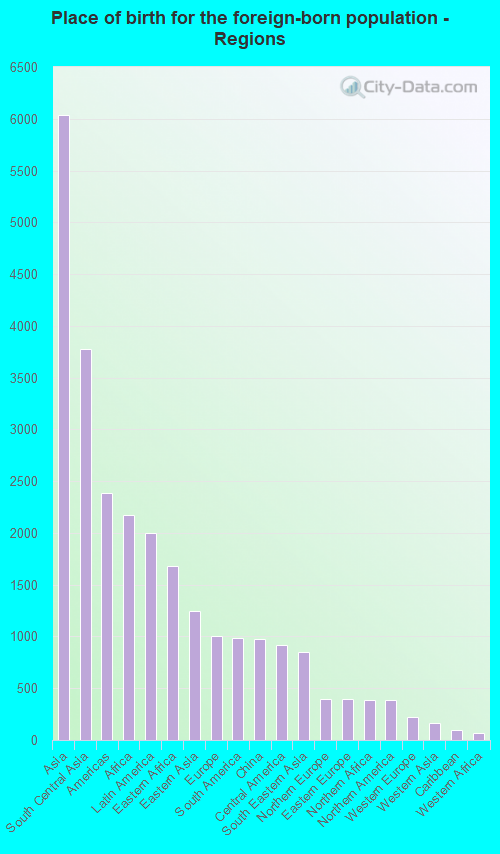
According to 2022 data, the most numerous races in Eden Prairie, MN are White alone (43,457 residents), Black alone (4,274 residents), and Hispanic (2,980 residents). 78.0% of Eden Prairie residents speak English at home. 18.4% of Eden Prairie, MN residents are foreign-born (9.2% born in Asia, 3.3% born in Africa, 3.0% born in Latin America), which is 56.5% greater than the foreign-born rate of 8.0% across the entire state of Minnesota.
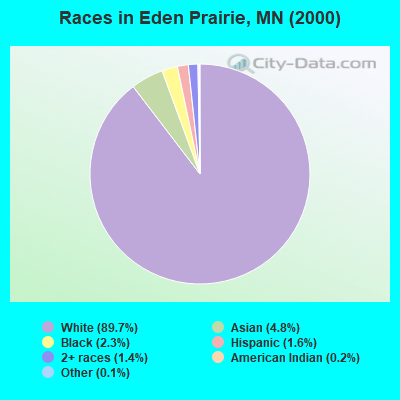
Race distribution in Eden Prairie
2000 2022
4,337,143 88.2% White alone 168,813 3.4% Black alone 143,382 2.9% Hispanic 141,083 2.9% Asian alone 70,304 1.4% Two or more races 52,009 1.1% American Indian alone 5,031 0.1% Other race alone 1,714 0.03% Native Hawaiian and Other
4,356,347 76.2% White alone 395,179 6.9% Black alone 333,830 5.8% Hispanic 294,800 5.2% Asian alone 259,649 4.5% Two or more races 42,125 0.7% American Indian alone 32,976 0.6% Other race alone 2,278 0.04% Native Hawaiian and Other
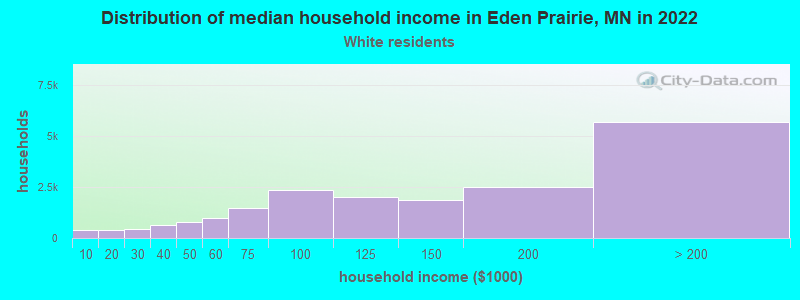
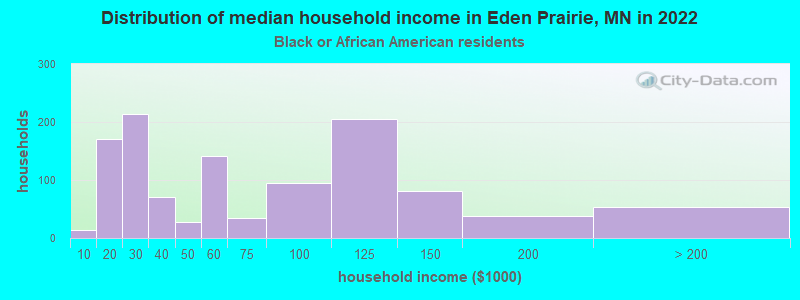
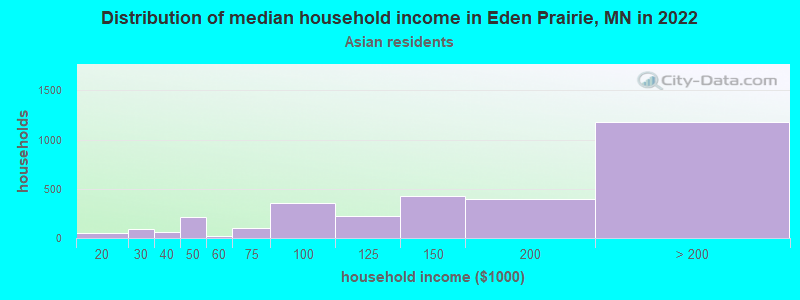
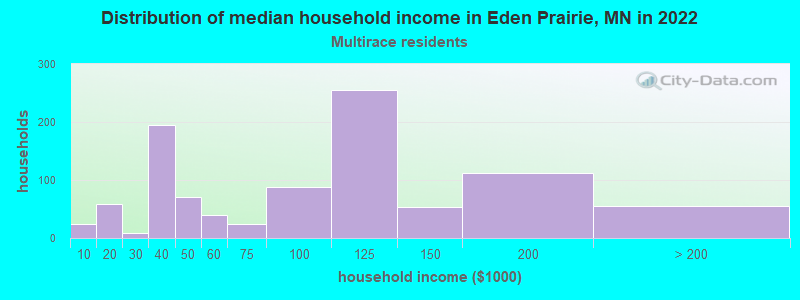
Income and house value in Eden Prairie Median household income in 2022 $127,592 White non-Hispanic householders$58,107 Black householders$153,628 Asian householders$81,933 Some other race householders$99,755 Two or more races householders$62,280 Hispanic or Latino race householdersMedian 2022 house value $481,671 White Non-Hispanic householders$430,424 Black or African American householders$431,868 American Indian or Alaska Native householders $400,350 Asian householders$354,877 Some other race householders$348,141 Two or more races householders$408,049 Hispanic or Latino householders
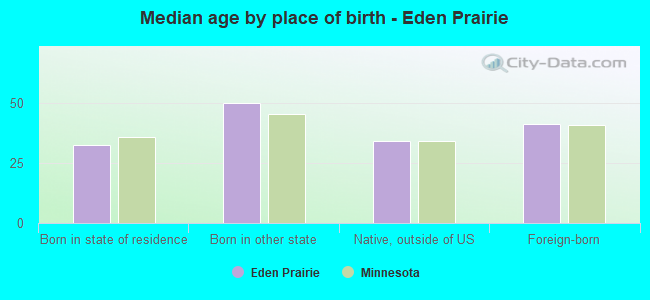
Median age by race in Eden Prairie
45.3 Median age for White residents44.1 47.6 22.1 Median age for Black or African American residents18.5 24.3 29.3 Median age for American Indian / Alaska Native residents56.0 -643,749,999.4 37.1 Median age for Asian residents37.9 36.4 -790,303,029.5 Median age for Native Hawaiian / Pacific Islander residents-856,799,036.4 -365,948,037.2 48.9 Median age for Other race residents42.9 49.0 23.4 Median age for Two or more races residents17.8 27.4 45.5 Median age for White alone residents44.2 48.0 29.8 Median age for Hispanic or Latino residents35.4 27.6
Owner/renter occupied households by race in Eden Prairie
House owners and renters - White residents 16,144 82.1% Owner occupied3,523 17.9% Renter occupiedHouse owners and renters - Black or African American residents 317 27.5% Owner occupied836 72.5% Renter occupiedHouse owners and renters - American Indian / Alaska Native residents 12 100.0% Owner occupiedHouse owners and renters - Asian residents 1,978 61.4% Owner occupied1,243 38.6% Renter occupiedHouse owners and renters - Other race residents 317 63.2% Owner occupied184 36.8% Renter occupiedHouse owners and renters - Two or more races residents 579 60.2% Owner occupied383 39.8% Renter occupiedHouse owners and renters - White alone residents 16,153 82.9% Owner occupied3,321 17.1% Renter occupiedHouse owners and renters - Hispanic or Latino residents 314 39.4% Owner occupied483 60.6% Renter occupied
Language usage in Eden Prairie
English speakers - Total 78.0% of residents of Eden Prairie speak English at home.
4.4% of residents speak Spanish at home 1,808 69.8% Speak English very well782 30.2% Speak English less than very well17.7% of residents speak other language at home 7,774 74.0% Speak English very well2,726 26.0% Speak English less than very well
English speakers - Born in the United States 90.9% of residents of Eden Prairie speak English at home.
3.3% of residents speak Spanish at home 488 81.5% Speak English very well111 18.5% Speak English less than very well5.6% of residents speak other language at home 964 95.4% Speak English very well46 4.6% Speak English less than very well
English speakers - Native, born elsewhere 60.6% of residents of Eden Prairie speak English at home.
18.9% of residents speak Spanish at home 76 74.5% Speak English very well26 25.5% Speak English less than very well17.9% of residents speak other language at home 83 85.6% Speak English very well14 14.4% Speak English less than very well
English speakers - Foreign-born 21.1% of residents of Eden Prairie speak English at home.
11.0% of residents speak Spanish at home 678 56.8% Speak English very well516 43.2% Speak English less than very well68.1% of residents speak other language at home 4,903 66.5% Speak English very well2,472 33.5% Speak English less than very well
White (Caucasian) - Speak only English Native:
95.6% (38,129)Foreign-born:
49.2% (879)
White (Caucasian) - Speak another language Native:
4.2% (1,666)Foreign-born:
53.0% (947)
Black or African American - Speak only English Native:
65.8% (1,447)Foreign-born:
12.7% (217)
Black or African American - Speak another language Native:
41.3% (908)Foreign-born:
91.0% (1,554)
American Indian / Alaska Native - Speak only English Native:
81.8% (24)Foreign-born:
100.0% (24)
Asian - Speak only English Native:
50.5% (1,209)Foreign-born:
17.7% (950)
Asian - Speak another language Native:
50.8% (1,215)Foreign-born:
82.2% (4,405)
Other race - Speak only English Native:
68.5% (815)Foreign-born:
25.7% (231)
Other race - Speak another language Native:
35.7% (425)Foreign-born:
73.5% (659)
Two or more races - Speak only English Native:
94.4% (2,586)Foreign-born:
16.1% (99)
Two or more races - Speak another language Native:
6.7% (183)Foreign-born:
83.4% (514)
White alone - Speak only English Native:
96.2% (38,056)Foreign-born:
52.8% (896)
White alone - Speak another language Native:
3.7% (1,480)Foreign-born:
48.4% (821)
Hispanic or Latino - Speak only English Native:
43.8% (654)Foreign-born:
10.0% (136)
Hispanic or Latino - Speak another language Native:
54.4% (813)Foreign-born:
88.8% (1,208)
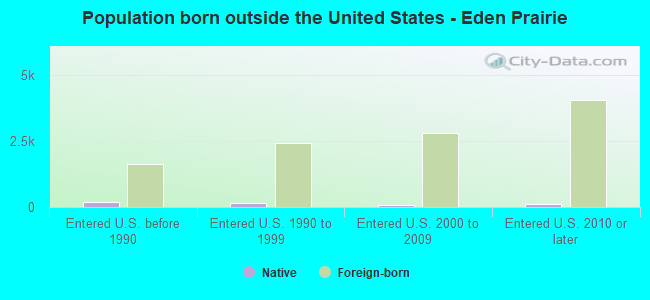
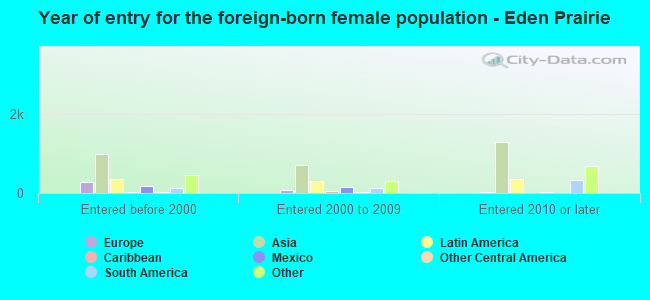
Foreign-born residents in Eden Prairie 11,598 residents are foreign born (9.2% Asia , 3.3% Africa , 3.0% Latin America ).
This city:
18.4%Minnesota:
8.5%
Marital status for residents in Eden Prairie Marital status - White (Caucasian) population 15 years and over
Males 27.3% Never married63.6% Now married1.2% Separated1.3% Widowed6.6% DivorcedFemales 24.9% Never married57.8% Now married0.5% Separated4.1% Widowed12.7% DivorcedWomen who gave birth in the past 12 months Now married:
95.0% (451)Unmarried:
5.0% (24)
Women who did not give birth in the past 12 months Now married:
49.9% (4,320)Unmarried:
50.1% (4,337)
Marital status - Black or African American population 15 years and over
Males 30.7% Never married66.7% Now married0.0% Separated1.2% Widowed1.3% DivorcedFemales 46.7% Never married37.5% Now married3.9% Separated5.8% Widowed6.2% DivorcedWomen who gave birth in the past 12 months Now married:
85.6% (128)Unmarried:
14.4% (22)
Women who did not give birth in the past 12 months Now married:
36.8% (423)Unmarried:
63.2% (726)
Marital status - American Indian / Alaska Native population 15 years and over
Males 0.0% Never married100.0% Now married0.0% Separated0.0% Widowed0.0% DivorcedFemales 36.1% Never married63.9% Now married0.0% Separated0.0% Widowed0.0% DivorcedWomen who did not give birth in the past 12 months Now married:
63.9% (24)Unmarried:
36.1% (14)
Marital status - Asian population 15 years and over
Males 19.0% Never married76.8% Now married0.0% Separated1.7% Widowed2.6% DivorcedFemales 17.1% Never married72.4% Now married0.3% Separated2.7% Widowed7.5% DivorcedWomen who gave birth in the past 12 months Now married:
100.0% (180)Unmarried:
0.0% (0)
Women who did not give birth in the past 12 months Now married:
72.9% (1,798)Unmarried:
27.1% (670)
Marital status - Other race population 15 years and over
Males 54.1% Never married39.2% Now married6.7% Separated0.0% Widowed0.0% DivorcedFemales 30.8% Never married43.7% Now married7.6% Separated0.1% Widowed17.8% DivorcedWomen who did not give birth in the past 12 months Now married:
47.7% (298)Unmarried:
52.3% (326)
Marital status - Two or more races population 15 years and over
Males 45.8% Never married46.9% Now married0.0% Separated1.1% Widowed6.2% DivorcedFemales 49.5% Never married37.1% Now married0.0% Separated2.7% Widowed10.7% DivorcedWomen who gave birth in the past 12 months Now married:
15.2% (9)Unmarried:
84.8% (52)
Women who did not give birth in the past 12 months Now married:
32.9% (372)Unmarried:
67.1% (759)
Marital status - White alone, not Hispanic / Latino population 15 years and over
Males 27.3% Never married64.4% Now married0.3% Separated1.4% Widowed6.7% DivorcedFemales 24.4% Never married58.3% Now married0.5% Separated4.2% Widowed12.6% DivorcedWomen who gave birth in the past 12 months Now married:
98.7% (441)Unmarried:
1.3% (6)
Women who did not give birth in the past 12 months Now married:
50.7% (4,312)Unmarried:
49.3% (4,186)
Marital status - Hispanic or Latino population 15 years and over
Males 42.5% Never married37.6% Now married15.1% Separated0.0% Widowed4.8% DivorcedFemales 44.4% Never married40.6% Now married5.9% Separated0.1% Widowed9.0% DivorcedWomen who gave birth in the past 12 months Now married:
48.6% (19)Unmarried:
51.4% (20)
Women who did not give birth in the past 12 months Now married:
42.9% (461)Unmarried:
57.1% (613)
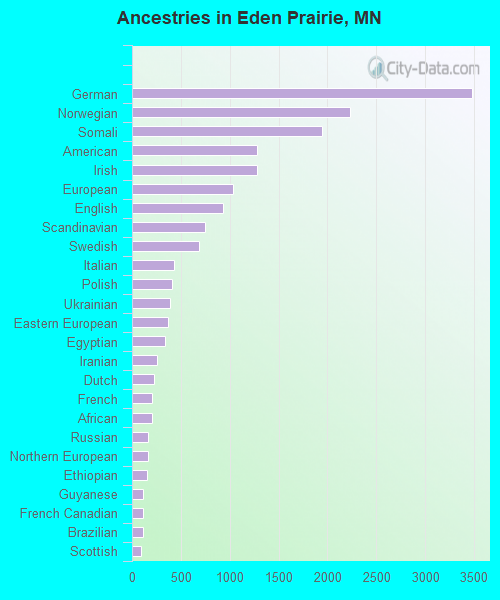
Ancestries in Eden Prairie
3,481 12.3% German2,233 7.9% Norwegian1,942 6.9% Somali1,284 4.5% American1,280 4.5% Irish1,034 3.7% European936 3.3% English743 2.6% Scandinavian684 2.4% Swedish425 1.5% Italian408 1.4% Polish394 1.4% Ukrainian365 1.3% Eastern European338 1.2% Egyptian258 0.9% Iranian228 0.8% Dutch209 0.7% French209 0.7% African165 0.6% Russian160 0.6% Northern European157 0.6% Ethiopian117 0.4% Guyanese117 0.4% French Canadian113 0.4% Brazilian88 0.3% Scottish84 0.3% Kenyan84 0.3% Swiss78 0.3% Afghan74 0.3% Danish72 0.3% Finnish61 0.2% Lebanese55 0.2% Haitian53 0.2% Armenian47 0.2% Jamaican46 0.2% Palestinian40 0.1% Greek38 0.1% Scotch-Irish36 0.1% Belgian29 0.1% Canadian28 0.10% Czech27 0.10% Austrian26 0.09% Hungarian19 0.07% Czechoslovakian17 0.06% Jordanian16 0.06% Slovene15 0.05% Ghanaian13 0.05% Slovak13 0.05% South African12 0.04% British11 0.04% Welsh10 0.04% Syrian10 0.04% Croatian9 0.03% Serbian8 0.03% Lithuanian7 0.02% Assyrian7 0.02% Liberian6 0.02% Romanian5 0.02% Pennsylvania German2 0.01% Arab
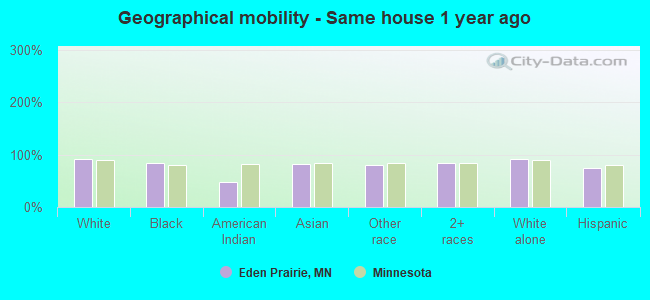
Geographical mobility in Eden Prairie Same house 1 year ago 39,534 90.9% White (Caucasian)3,500 83.9% Black or African American23 48.4% American Indian / Alaska Native6,691 81.5% Asian1,657 79.8% Other race3,178 84.6% Two or more races39,339 91.5% White alone, not Hispanic / Latino2,177 73.6% Hispanic or LatinoMoved within same county 2,442 5.6% White / Caucasian394 9.4% Black or African American22 45.7% American Indian / Alaska Native1,061 12.9% Asian148 7.1% Other race167 4.5% Two or more races2,306 5.4% White alone, not Hispanic / Latino345 11.7% Hispanic or LatinoMoved within same state 925 2.1% White / Caucasian154 3.7% Black or African American12 0.1% Asian24 1.2% Other race188 5.0% Two or more races875 2.0% White alone, not Hispanic / Latino124 4.2% Hispanic or LatinoMoved from different state 769 1.8% White / Caucasian26 0.6% Black or African American426 5.2% Asian43 2.1% Other race312 8.3% Two or more races683 1.6% White alone, not Hispanic / Latino263 8.9% Hispanic or LatinoMoved from abroad 18 0.0% White95 1.2% Asian188 9.0% Other race20 0.0% White alone, not Hispanic / Latino78 2.6% Hispanic or Latino
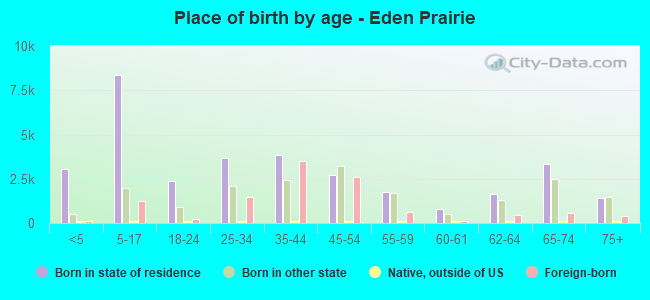
Children Nativity (place of birth) in Eden Prairie
Children under 6 years - Living with two parents Both parents native 2,322 100.0% NativeBoth parents foreign-born 922 89.4% Native110 10.6% Foreign-bornOne native, one foreign-born parent 419 100.0% NativeChildren under 6 years - Living with one parent Native parent 393 100.0% NativeForeign-born parent 119 100.0% NativeChildren 6 to 17 years - Living with two parents Both parents native 5,228 96.8% Native172 3.2% Foreign-bornBoth parents foreign-born 1,876 71.8% Native738 28.2% Foreign-bornOne native, one foreign-born parent 1,155 100.0% NativeChildren 6 to 17 years - Living with one parent Native parent 1,136 100.0% NativeForeign-born parent 330 53.6% Native286 46.4% Foreign-born
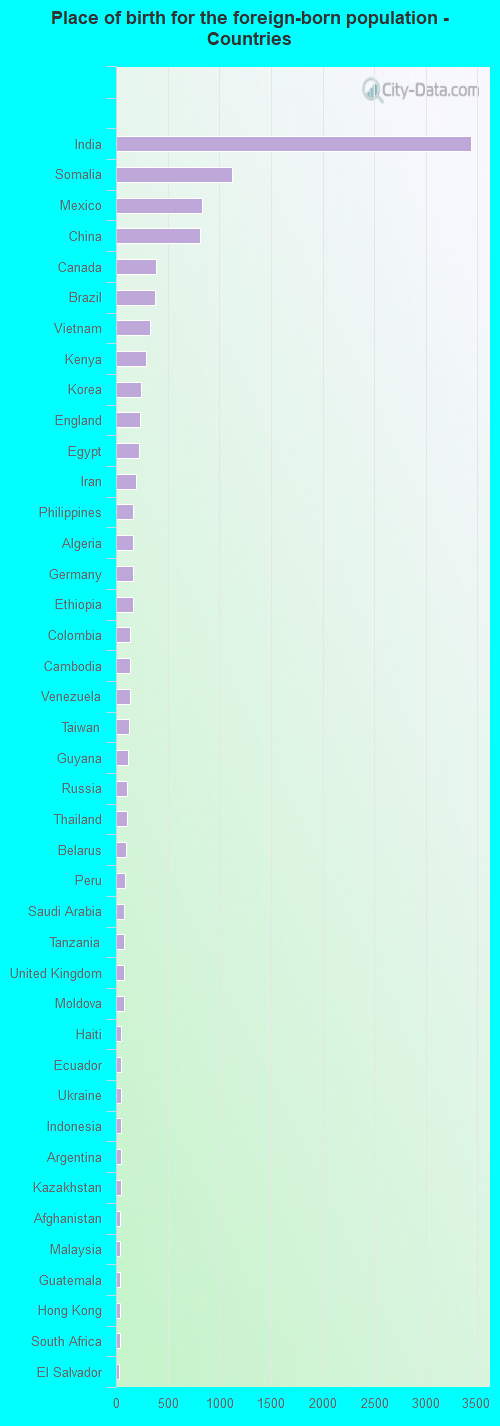
Place of birth for residents in Eden Prairie 6,032 Asia3,778 South Central Asia2,384 Americas2,172 Africa1,998 Latin America1,676 Eastern Africa1,243 Eastern Asia1,008 Europe982 South America979 China917 Central America847 South Eastern Asia392 Northern Europe392 Eastern Europe390 Northern Africa386 Northern America223 Western Europe163 Western Asia99 Caribbean70 Western Africa35 Southern Africa3,440 India1,125 Somalia832 Mexico816 China386 Canada381 Brazil325 Vietnam291 Kenya244 Korea232 England223 Egypt197 Iran168 Philippines166 Algeria163 Germany161 Ethiopia137 Colombia135 Cambodia135 Venezuela122 Taiwan117 Guyana111 Russia105 Thailand99 Belarus86 Peru79 Saudi Arabia79 Tanzania73 United Kingdom73 Moldova53 Haiti52 Ecuador47 Ukraine45 Indonesia44 Argentina44 Kazakhstan43 Afghanistan41 Malaysia40 Guatemala40 Hong Kong35 South Africa33 El Salvador31 Sri Lanka30 Hungary26 Ghana26 Jamaica25 Laos24 Lebanon23 Nigeria22 France22 Netherlands21 Uruguay20 Ireland20 Pakistan19 Japan19 Liberia18 Iraq16 Lithuania16 Syria13 Denmark11 Honduras10 Trinidad and Tobago8 Switzerland8 Jordan8 Turkey8 Grenada7 Sweden7 Israel6 Austria
Grandparents responsible for own grandchildren in Eden Prairie
Grandparents (30 to 59 years) White / Caucasian 25 30.0% Responsible for grandchildren59 70.0% Not responsible for grandchildrenTwo or more races 9 67.0% Responsible for grandchildren4 33.0% Not responsible for grandchildrenWhite alone, not Hispanic / Latino 17 44.5% Responsible for grandchildren21 55.5% Not responsible for grandchildrenHispanic or Latino 9 16.2% Responsible for grandchildren46 83.8% Not responsible for grandchildren
Grandparents (60 years and over) White / Caucasian 209 100.0% Not responsible for grandchildrenWhite alone, not Hispanic / Latino 219 100.0% Not responsible for grandchildrenHispanic or Latino 36 100.0% Not responsible for grandchildren