Races in Ellenton, Florida (FL) Detailed Stats
Data:
Races - White alone (%)
Races - White alone (% change since 2000)
Races - Black alone (%)
Races - Black alone (% change since 2000)
Races - American Indian alone (%)
Races - American Indian alone (% change since 2000)
Races - Asian alone (%)
Races - Asian alone (% change since 2000)
Races - Hispanic (%)
Races - Hispanic (% change since 2000)
Races - Native Hawaiian and Other Pacific Islander alone (%)
Races - Native Hawaiian and Other Pacific Islander alone (% change since 2000)
Races - Two or more races(%)
Races - Two or more races(% change since 2000)
Races - Other race alone (%)
Races - Other race alone (% change since 2000)
Racial diversity
Place of birth - Born in state of residence (%)
Place of birth - Born in state of residence (%) - White
Place of birth - Born in state of residence (%) - Black or African American
Place of birth - Born in state of residence (%) - Asian
Place of birth - Born in state of residence (%) - Hispanic or Latino
Place of birth - Born in state of residence (%) - American Indian and Alaska Native
Place of birth - Born in state of residence (%) - Multirace
Place of birth - Born in state of residence (%) - Other Race
Place of birth - Born in other state (%)
Place of birth - Born in other state (%) - White
Place of birth - Born in other state (%) - Black or African American
Place of birth - Born in other state (%) - Asian
Place of birth - Born in other state (%) - Hispanic or Latino
Place of birth - Born in other state (%) - American Indian and Alaska Native
Place of birth - Born in other state (%) - Multirace
Place of birth - Born in other state (%) - Other Race
Place of birth - Native, outside of US (%)
Place of birth - Native, outside of US (%) - White
Place of birth - Native, outside of US (%) - Black or African American
Place of birth - Native, outside of US (%) - Asian
Place of birth - Native, outside of US (%) - Hispanic or Latino
Place of birth - Native, outside of US (%) - American Indian and Alaska Native
Place of birth - Native, outside of US (%) - Multirace
Place of birth - Native, outside of US (%) - Other Race
Place of birth - Foreign born (%)
Place of birth - Foreign born (%) - White
Place of birth - Foreign born (%) - Black or African American
Place of birth - Foreign born (%) - Asian
Place of birth - Foreign born (%) - Hispanic or Latino
Place of birth - Foreign born (%) - American Indian and Alaska Native
Place of birth - Foreign born (%) - Multirace
Place of birth - Foreign born (%) - Other Race
Residents speaking English at home (%)
Residents speaking English at home - Born in the United States (%)
Residents speaking English at home - Native, born elsewhere (%)
Residents speaking English at home - Foreign born (%)
Residents speaking Spanish at home (%)
Residents speaking Spanish at home - Born in the United States (%)
Residents speaking Spanish at home - Native, born elsewhere (%)
Residents speaking Spanish at home - Foreign born (%)
Residents speaking other language at home (%)
Residents speaking other language at home - Born in the United States (%)
Residents speaking other language at home - Native, born elsewhere (%)
Residents speaking other language at home - Foreign born (%)
Marital status - Never married (%)
Marital status - Now married (%)
Marital status - Separated (%)
Marital status - Widowed (%)
Marital status - Divorced (%)
Ancestries Reported - Arab (%)
Ancestries Reported - Czech (%)
Ancestries Reported - Danish (%)
Ancestries Reported - Dutch (%)
Ancestries Reported - English (%)
Ancestries Reported - French (%)
Ancestries Reported - French Canadian (%)
Ancestries Reported - German (%)
Ancestries Reported - Greek (%)
Ancestries Reported - Hungarian (%)
Ancestries Reported - Irish (%)
Ancestries Reported - Italian (%)
Ancestries Reported - Lithuanian (%)
Ancestries Reported - Norwegian (%)
Ancestries Reported - Polish (%)
Ancestries Reported - Portuguese (%)
Ancestries Reported - Russian (%)
Ancestries Reported - Scotch-Irish (%)
Ancestries Reported - Scottish (%)
Ancestries Reported - Slovak (%)
Ancestries Reported - Subsaharan African (%)
Ancestries Reported - Swedish (%)
Ancestries Reported - Swiss (%)
Ancestries Reported - Ukrainian (%)
Ancestries Reported - United States (%)
Ancestries Reported - Welsh (%)
Ancestries Reported - West Indian (%)
Ancestries Reported - Other (%)
Geographical mobility - Same house 1 year ago (%)
Geographical mobility - Same house 1 year ago (%) - White
Geographical mobility - Same house 1 year ago (%) - Black or African American
Geographical mobility - Same house 1 year ago (%) - Asian
Geographical mobility - Same house 1 year ago (%) - Hispanic or Latino
Geographical mobility - Same house 1 year ago (%) - American Indian and Alaska Native
Geographical mobility - Same house 1 year ago (%) - Multirace
Geographical mobility - Same house 1 year ago (%) - Other Race
Geographical mobility - Moved within same county (%)
Geographical mobility - Moved within same county (%) - White
Geographical mobility - Moved within same county (%) - Black or African American
Geographical mobility - Moved within same county (%) - Asian
Geographical mobility - Moved within same county (%) - Hispanic or Latino
Geographical mobility - Moved within same county (%) - American Indian and Alaska Native
Geographical mobility - Moved within same county (%) - Multirace
Geographical mobility - Moved within same county (%) - Other Race
Geographical mobility - Moved from different county within same state (%)
Geographical mobility - Moved from different county within same state (%) - White
Geographical mobility - Moved from different county within same state (%) - Black or African American
Geographical mobility - Moved from different county within same state (%) - Asian
Geographical mobility - Moved from different county within same state (%) - Hispanic or Latino
Geographical mobility - Moved from different county within same state (%) - American Indian and Alaska Native
Geographical mobility - Moved from different county within same state (%) - Multirace
Geographical mobility - Moved from different county within same state (%) - Other Race
Geographical mobility - Moved from different state (%)
Geographical mobility - Moved from different state (%) - White
Geographical mobility - Moved from different state (%) - Black or African American
Geographical mobility - Moved from different state (%) - Asian
Geographical mobility - Moved from different state (%) - Hispanic or Latino
Geographical mobility - Moved from different state (%) - American Indian and Alaska Native
Geographical mobility - Moved from different state (%) - Multirace
Geographical mobility - Moved from different state (%) - Other Race
Geographical mobility - Moved from abroad (%)
Geographical mobility - Moved from abroad (%) - White
Geographical mobility - Moved from abroad (%) - Black or African American
Geographical mobility - Moved from abroad (%) - Asian
Geographical mobility - Moved from abroad (%) - Hispanic or Latino
Geographical mobility - Moved from abroad (%) - American Indian and Alaska Native
Geographical mobility - Moved from abroad (%) - Multirace
Geographical mobility - Moved from abroad (%) - Other Race
Place of birth for the foreign-born population - Ireland (%)
Place of birth for the foreign-born population - Denmark (%)
Place of birth for the foreign-born population - Norway (%)
Place of birth for the foreign-born population - Sweden (%)
Place of birth for the foreign-born population - United Kingdom (%)
Place of birth for the foreign-born population - England (%)
Place of birth for the foreign-born population - Scotland (%)
Place of birth for the foreign-born population - Other Northern Europe (%)
Place of birth for the foreign-born population - Austria (%)
Place of birth for the foreign-born population - Belgium (%)
Place of birth for the foreign-born population - France (%)
Place of birth for the foreign-born population - Germany (%)
Place of birth for the foreign-born population - Netherlands (%)
Place of birth for the foreign-born population - Switzerland (%)
Place of birth for the foreign-born population - Other Western Europe (%)
Place of birth for the foreign-born population - Greece (%)
Place of birth for the foreign-born population - Italy (%)
Place of birth for the foreign-born population - Portugal (%)
Place of birth for the foreign-born population - Spain (%)
Place of birth for the foreign-born population - Other Southern Europe (%)
Place of birth for the foreign-born population - Albania (%)
Place of birth for the foreign-born population - Belarus (%)
Place of birth for the foreign-born population - Bosnia and Herzegovina (%)
Place of birth for the foreign-born population - Bulgaria (%)
Place of birth for the foreign-born population - Croatia (%)
Place of birth for the foreign-born population - Czechoslovakia (%)
Place of birth for the foreign-born population - Hungary (%)
Place of birth for the foreign-born population - Latvia (%)
Place of birth for the foreign-born population - Lithuania (%)
Place of birth for the foreign-born population - North Macedonia (Macedonia) (%)
Place of birth for the foreign-born population - Moldova (%)
Place of birth for the foreign-born population - Poland (%)
Place of birth for the foreign-born population - Romania (%)
Place of birth for the foreign-born population - Russia (%)
Place of birth for the foreign-born population - Serbia (%)
Place of birth for the foreign-born population - Ukraine (%)
Place of birth for the foreign-born population - Other Eastern Europe (%)
Place of birth for the foreign-born population - China (%)
Place of birth for the foreign-born population - Hong Kong (%)
Place of birth for the foreign-born population - Taiwan (%)
Place of birth for the foreign-born population - Japan (%)
Place of birth for the foreign-born population - Korea (%)
Place of birth for the foreign-born population - Other Eastern Asia (%)
Place of birth for the foreign-born population - Afghanistan (%)
Place of birth for the foreign-born population - Bangladesh (%)
Place of birth for the foreign-born population - India (%)
Place of birth for the foreign-born population - Iran (%)
Place of birth for the foreign-born population - Kazakhstan (%)
Place of birth for the foreign-born population - Nepal (%)
Place of birth for the foreign-born population - Pakistan (%)
Place of birth for the foreign-born population - Sri Lanka (%)
Place of birth for the foreign-born population - Uzbekistan (%)
Place of birth for the foreign-born population - Other South Central Asia (%)
Place of birth for the foreign-born population - Burma (%)
Place of birth for the foreign-born population - Cambodia (%)
Place of birth for the foreign-born population - Indonesia (%)
Place of birth for the foreign-born population - Laos (%)
Place of birth for the foreign-born population - Malaysia (%)
Place of birth for the foreign-born population - Philippines (%)
Place of birth for the foreign-born population - Singapore (%)
Place of birth for the foreign-born population - Thailand (%)
Place of birth for the foreign-born population - Vietnam (%)
Place of birth for the foreign-born population - Other South Eastern Asia (%)
Place of birth for the foreign-born population - Armenia (%)
Place of birth for the foreign-born population - Iraq (%)
Place of birth for the foreign-born population - Israel (%)
Place of birth for the foreign-born population - Jordan (%)
Place of birth for the foreign-born population - Kuwait (%)
Place of birth for the foreign-born population - Lebanon (%)
Place of birth for the foreign-born population - Saudi Arabia (%)
Place of birth for the foreign-born population - Syria (%)
Place of birth for the foreign-born population - Turkey (%)
Place of birth for the foreign-born population - Yemen (%)
Place of birth for the foreign-born population - Other Western Asia (%)
Place of birth for the foreign-born population - Eritrea (%)
Place of birth for the foreign-born population - Ethiopia (%)
Place of birth for the foreign-born population - Kenya (%)
Place of birth for the foreign-born population - Somalia (%)
Place of birth for the foreign-born population - Uganda (%)
Place of birth for the foreign-born population - Zimbabwe (%)
Place of birth for the foreign-born population - Other Eastern Africa (%)
Place of birth for the foreign-born population - Cameroon (%)
Place of birth for the foreign-born population - Congo (%)
Place of birth for the foreign-born population - Democratic Republic of Congo (Zaire) (%)
Place of birth for the foreign-born population - Other Middle Africa (%)
Place of birth for the foreign-born population - Egypt (%)
Place of birth for the foreign-born population - Morocco (%)
Place of birth for the foreign-born population - Sudan (%)
Place of birth for the foreign-born population - Other Northern Africa (%)
Place of birth for the foreign-born population - South Africa (%)
Place of birth for the foreign-born population - Other Southern Africa (%)
Place of birth for the foreign-born population - Cabo Verde (%)
Place of birth for the foreign-born population - Ghana (%)
Place of birth for the foreign-born population - Liberia (%)
Place of birth for the foreign-born population - Nigeria (%)
Place of birth for the foreign-born population - Senegal (%)
Place of birth for the foreign-born population - Sierra Leone (%)
Place of birth for the foreign-born population - Other Western Africa (%)
Place of birth for the foreign-born population - Australia (%)
Place of birth for the foreign-born population - New Zealand (%)
Place of birth for the foreign-born population - Fiji (%)
Place of birth for the foreign-born population - Micronesia (%)
Place of birth for the foreign-born population - Bahamas (%)
Place of birth for the foreign-born population - Barbados (%)
Place of birth for the foreign-born population - Cuba (%)
Place of birth for the foreign-born population - Dominica (%)
Place of birth for the foreign-born population - Dominican Republic (%)
Place of birth for the foreign-born population - Grenada (%)
Place of birth for the foreign-born population - Haiti (%)
Place of birth for the foreign-born population - Jamaica (%)
Place of birth for the foreign-born population - St. Vincent and the Grenadines (%)
Place of birth for the foreign-born population - Trinidad and Tobago (%)
Place of birth for the foreign-born population - West Indies (%)
Place of birth for the foreign-born population - Other Caribbean (%)
Place of birth for the foreign-born population - Belize (%)
Place of birth for the foreign-born population - Costa Rica (%)
Place of birth for the foreign-born population - El Salvador (%)
Place of birth for the foreign-born population - Guatemala (%)
Place of birth for the foreign-born population - Honduras (%)
Place of birth for the foreign-born population - Mexico (%)
Place of birth for the foreign-born population - Nicaragua (%)
Place of birth for the foreign-born population - Panama (%)
Place of birth for the foreign-born population - Other Central America (%)
Place of birth for the foreign-born population - Argentina (%)
Place of birth for the foreign-born population - Bolivia (%)
Place of birth for the foreign-born population - Brazil (%)
Place of birth for the foreign-born population - Chile (%)
Place of birth for the foreign-born population - Colombia (%)
Place of birth for the foreign-born population - Ecuador (%)
Place of birth for the foreign-born population - Guyana (%)
Place of birth for the foreign-born population - Peru (%)
Place of birth for the foreign-born population - Uruguay (%)
Place of birth for the foreign-born population - Venezuela (%)
Place of birth for the foreign-born population - Other South America (%)
Place of birth for the foreign-born population - Canada (%)
Place of birth for the foreign-born population - Other Northern America (%)
Place of birth for the foreign-born population - Other (%)
Beertopia, Parrish Heritage Days, Art in the Park, Gamble Plantation Open House & more, all this weekend! (2 replies)Downtown SRQ Blues Festival, Quilts on Parade, Gamble Plantation Open House, NHRA Pro Mods & more, all this weekend! (2 replies)Sarasota & Manatee Counties news thread (3697 replies)Der Dutchman, Owen’s Fish Camp, Nicky’s On Palm: Restaurant News (278 replies)Chillounge, Art Slam, Moonlight Movie, Beertopia, Heritage Days, Jazz & Fairy House Festival all this weekend! (2 replies)Newly built house, new to Florida. Pest control necessary? (14 replies)
Latest news about races in Ellenton, FL collected exclusively by city-data.com from local newspapers, TV, and radio stations
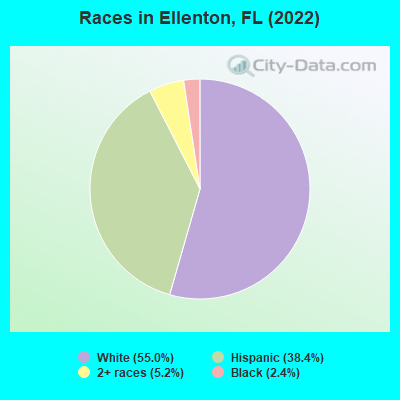
According to 2022 data, the most numerous races in Ellenton, FL are White alone (3,141 residents), Hispanic (2,195 residents), and Black alone (139 residents). 75.0% of Ellenton residents speak English at home. 8.9% of Ellenton, FL residents are foreign-born (8.5% born in Latin America), which is 136.1% less than the foreign-born rate of 21.0% across the entire state of Florida.
Race distribution in Ellenton
2000 2022
10,458,509 65.4% White alone 2,682,715 16.8% Hispanic 2,264,268 14.2% Black alone 261,693 1.6% Asian alone 236,954 1.5% Two or more races 42,358 0.3% American Indian alone 28,994 0.2% Other race alone 6,887 0.04% Native Hawaiian and Other
11,309,403 50.8% White alone 6,025,039 27.1% Hispanic 3,241,015 14.6% Black alone 861,630 3.9% Two or more races 623,692 2.8% Asian alone 152,054 0.7% Other race alone 22,504 0.1% American Indian alone 9,486 0.04% Native Hawaiian and Other
Income and house value in Ellenton Median household income in 2022 $68,661 White non-Hispanic householders$78,659 Two or more races householders$60,572 Hispanic or Latino race householdersMedian 2022 house value $371,970 White Non-Hispanic householders$279,306 Black or African American householders$670,992 American Indian or Alaska Native householders $312,166 Asian householders$312,166 Some other race householders$129,795 Hispanic or Latino householders
Median age by race in Ellenton
60.4 Median age for White residents55.0 68.7 52.1 Median age for Black or African American residents34.4 -644,688,644.0 -598,566,307.6 Median age for American Indian / Alaska Native residents-611,418,047.3 -594,925,633.7 -698,412,697.7 Median age for Asian residents-815,173,526.2 -642,479,213.3 -679,849,340.2 Median age for Native Hawaiian / Pacific Islander residents-858,307,848.3 -443,298,968.6 19.9 Median age for Other race residents21.0 20.3 21.9 Median age for Two or more races residents7.5 45.4 64.3 Median age for White alone residents57.3 69.5 20.1 Median age for Hispanic or Latino residents12.3 22.4
Owner/renter occupied households by race in Ellenton
House owners and renters - White residents 1,177 75.1% Owner occupied390 24.9% Renter occupiedHouse owners and renters - Other race residents 179 100.0% Renter occupiedHouse owners and renters - Two or more races residents 300 66.7% Owner occupied149 33.3% Renter occupiedHouse owners and renters - White alone residents 1,170 79.2% Owner occupied307 20.8% Renter occupiedHouse owners and renters - Hispanic or Latino residents 197 43.8% Owner occupied252 56.2% Renter occupied
Language usage in Ellenton
English speakers - Total 75.0% of residents of Ellenton speak English at home.
23.6% of residents speak Spanish at home 1,169 89.4% Speak English very well139 10.6% Speak English less than very well0.5% of residents speak other language at home 28 100.0% Speak English very well
English speakers - Born in the United States 95.3% of residents of Ellenton speak English at home.
4.3% of residents speak Spanish at home 139 100.0% Speak English very well1.0% of residents speak other language at home 32 100.0% Speak English very well
English speakers - Native, born elsewhere 0.0% of residents of Ellenton speak English at home.
111.0% of residents speak Spanish at home 91 100.0% Speak English less than very well
English speakers - Foreign-born 20.1% of residents of Ellenton speak English at home.
69.8% of residents speak Spanish at home 322 91.0% Speak English very well32 9.0% Speak English less than very well
White (Caucasian) - Speak only English Native:
94.9% (3,179)Foreign-born:
74.7% (23)
White (Caucasian) - Speak another language Native:
4.8% (159)Foreign-born:
37.2% (11)
Other race - Speak only English Native:
58.3% (246)Foreign-born:
46.0% (135)
Other race - Speak another language Native:
45.0% (190)Foreign-born:
62.2% (183)
Two or more races - Speak another language Native:
62.1% (982)Foreign-born:
96.5% (354)
White alone - Speak only English Native:
98.3% (3,027)Foreign-born:
96.1% (23)
Hispanic or Latino - Speak only English Native:
47.1% (773)Foreign-born:
26.3% (120)
Hispanic or Latino - Speak another language Native:
53.1% (871)Foreign-born:
80.3% (365)
Foreign-born residents in Ellenton 508 residents are foreign born (8.5% Latin America ).
This city:
8.9%Florida:
21.1%
Marital status for residents in Ellenton Marital status - White (Caucasian) population 15 years and over
Males 18.2% Never married69.7% Now married3.2% Separated1.2% Widowed7.6% DivorcedFemales 13.3% Never married37.6% Now married0.0% Separated23.4% Widowed25.7% DivorcedWomen who gave birth in the past 12 months Now married:
39.6% (20)Unmarried:
60.4% (31)
Women who did not give birth in the past 12 months Now married:
43.0% (187)Unmarried:
57.0% (249)
Marital status - Black or African American population 15 years and over
Males 58.9% Never married41.1% Now married0.0% Separated0.0% Widowed0.0% DivorcedFemales 35.9% Never married64.1% Now married0.0% Separated0.0% Widowed0.0% DivorcedWomen who did not give birth in the past 12 months Now married:
0.0% (0)Unmarried:
100.0% (34)
Marital status - Other race population 15 years and over
Males 67.0% Never married33.0% Now married0.0% Separated0.0% Widowed0.0% DivorcedFemales 52.2% Never married26.3% Now married21.5% Separated0.0% Widowed0.0% DivorcedWomen who did not give birth in the past 12 months Now married:
47.8% (137)Unmarried:
52.2% (149)
Marital status - Two or more races population 15 years and over
Males 0.6% Never married99.4% Now married0.0% Separated0.0% Widowed0.0% DivorcedFemales 26.3% Never married73.7% Now married0.0% Separated0.0% Widowed0.0% DivorcedWomen who gave birth in the past 12 months Now married:
100.0% (77)Unmarried:
0.0% (0)
Women who did not give birth in the past 12 months Now married:
50.6% (223)Unmarried:
49.4% (217)
Marital status - White alone, not Hispanic / Latino population 15 years and over
Males 15.9% Never married71.1% Now married3.5% Separated1.3% Widowed8.2% DivorcedFemales 12.4% Never married36.1% Now married0.0% Separated24.0% Widowed27.5% DivorcedWomen who gave birth in the past 12 months Now married:
39.6% (22)Unmarried:
60.4% (33)
Women who did not give birth in the past 12 months Now married:
35.6% (131)Unmarried:
64.4% (236)
Marital status - Hispanic or Latino population 15 years and over
Males 47.9% Never married52.1% Now married0.0% Separated0.0% Widowed0.0% DivorcedFemales 35.9% Never married56.3% Now married5.7% Separated2.1% Widowed0.0% DivorcedWomen who gave birth in the past 12 months Now married:
100.0% (61)Unmarried:
0.0% (0)
Women who did not give birth in the past 12 months Now married:
49.0% (319)Unmarried:
51.0% (332)
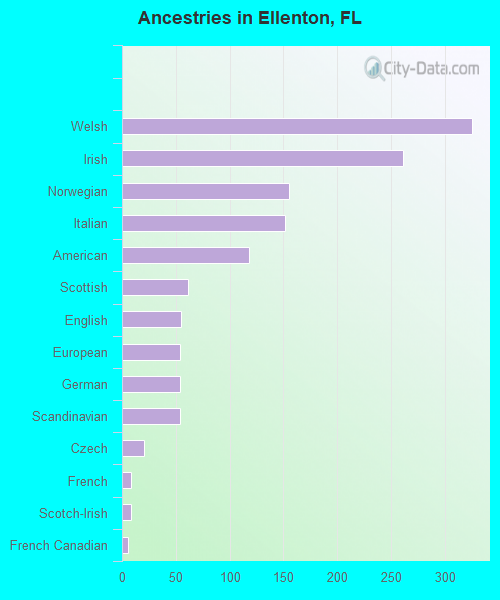
Ancestries in Ellenton
325 12.9% Welsh261 10.3% Irish155 6.1% Norwegian152 6.0% Italian118 4.7% American61 2.4% Scottish55 2.2% English54 2.1% European54 2.1% German54 2.1% Scandinavian20 0.8% Czech8 0.3% French8 0.3% Scotch-Irish6 0.2% French Canadian1 0.04% African
Children Nativity (place of birth) in Ellenton
Children under 6 years - Living with two parents Both parents foreign-born 203 100.0% NativeChildren under 6 years - Living with one parent Native parent 15 100.0% NativeChildren 6 to 17 years - Living with two parents Both parents native 334 100.0% NativeBoth parents foreign-born 36 100.0% NativeOne native, one foreign-born parent 122 100.0% NativeChildren 6 to 17 years - Living with one parent Native parent 176 100.0% NativeForeign-born parent 169 53.0% Native150 47.0% Foreign-born
Place of birth for residents in Ellenton 508 Americas485 Latin America357 Central America128 South America23 Northern America
Grandparents responsible for own grandchildren in Ellenton
Grandparents (30 to 59 years) White / Caucasian 19 100.0% Not responsible for grandchildrenWhite alone, not Hispanic / Latino 22 100.0% Not responsible for grandchildren
Grandparents (60 years and over) White / Caucasian 32 100.0% Responsible for grandchildrenWhite alone, not Hispanic / Latino 28 100.0% Responsible for grandchildren