Races in Emporia, Kansas (KS) Detailed Stats
Data:
Races - White alone (%)
Races - White alone (% change since 2000)
Races - Black alone (%)
Races - Black alone (% change since 2000)
Races - American Indian alone (%)
Races - American Indian alone (% change since 2000)
Races - Asian alone (%)
Races - Asian alone (% change since 2000)
Races - Hispanic (%)
Races - Hispanic (% change since 2000)
Races - Native Hawaiian and Other Pacific Islander alone (%)
Races - Native Hawaiian and Other Pacific Islander alone (% change since 2000)
Races - Two or more races(%)
Races - Two or more races(% change since 2000)
Races - Other race alone (%)
Races - Other race alone (% change since 2000)
Racial diversity
Place of birth - Born in state of residence (%)
Place of birth - Born in state of residence (%) - White
Place of birth - Born in state of residence (%) - Black or African American
Place of birth - Born in state of residence (%) - Asian
Place of birth - Born in state of residence (%) - Hispanic or Latino
Place of birth - Born in state of residence (%) - American Indian and Alaska Native
Place of birth - Born in state of residence (%) - Multirace
Place of birth - Born in state of residence (%) - Other Race
Place of birth - Born in other state (%)
Place of birth - Born in other state (%) - White
Place of birth - Born in other state (%) - Black or African American
Place of birth - Born in other state (%) - Asian
Place of birth - Born in other state (%) - Hispanic or Latino
Place of birth - Born in other state (%) - American Indian and Alaska Native
Place of birth - Born in other state (%) - Multirace
Place of birth - Born in other state (%) - Other Race
Place of birth - Native, outside of US (%)
Place of birth - Native, outside of US (%) - White
Place of birth - Native, outside of US (%) - Black or African American
Place of birth - Native, outside of US (%) - Asian
Place of birth - Native, outside of US (%) - Hispanic or Latino
Place of birth - Native, outside of US (%) - American Indian and Alaska Native
Place of birth - Native, outside of US (%) - Multirace
Place of birth - Native, outside of US (%) - Other Race
Place of birth - Foreign born (%)
Place of birth - Foreign born (%) - White
Place of birth - Foreign born (%) - Black or African American
Place of birth - Foreign born (%) - Asian
Place of birth - Foreign born (%) - Hispanic or Latino
Place of birth - Foreign born (%) - American Indian and Alaska Native
Place of birth - Foreign born (%) - Multirace
Place of birth - Foreign born (%) - Other Race
Residents speaking English at home (%)
Residents speaking English at home - Born in the United States (%)
Residents speaking English at home - Native, born elsewhere (%)
Residents speaking English at home - Foreign born (%)
Residents speaking Spanish at home (%)
Residents speaking Spanish at home - Born in the United States (%)
Residents speaking Spanish at home - Native, born elsewhere (%)
Residents speaking Spanish at home - Foreign born (%)
Residents speaking other language at home (%)
Residents speaking other language at home - Born in the United States (%)
Residents speaking other language at home - Native, born elsewhere (%)
Residents speaking other language at home - Foreign born (%)
Marital status - Never married (%)
Marital status - Now married (%)
Marital status - Separated (%)
Marital status - Widowed (%)
Marital status - Divorced (%)
Ancestries Reported - Arab (%)
Ancestries Reported - Czech (%)
Ancestries Reported - Danish (%)
Ancestries Reported - Dutch (%)
Ancestries Reported - English (%)
Ancestries Reported - French (%)
Ancestries Reported - French Canadian (%)
Ancestries Reported - German (%)
Ancestries Reported - Greek (%)
Ancestries Reported - Hungarian (%)
Ancestries Reported - Irish (%)
Ancestries Reported - Italian (%)
Ancestries Reported - Lithuanian (%)
Ancestries Reported - Norwegian (%)
Ancestries Reported - Polish (%)
Ancestries Reported - Portuguese (%)
Ancestries Reported - Russian (%)
Ancestries Reported - Scotch-Irish (%)
Ancestries Reported - Scottish (%)
Ancestries Reported - Slovak (%)
Ancestries Reported - Subsaharan African (%)
Ancestries Reported - Swedish (%)
Ancestries Reported - Swiss (%)
Ancestries Reported - Ukrainian (%)
Ancestries Reported - United States (%)
Ancestries Reported - Welsh (%)
Ancestries Reported - West Indian (%)
Ancestries Reported - Other (%)
Geographical mobility - Same house 1 year ago (%)
Geographical mobility - Same house 1 year ago (%) - White
Geographical mobility - Same house 1 year ago (%) - Black or African American
Geographical mobility - Same house 1 year ago (%) - Asian
Geographical mobility - Same house 1 year ago (%) - Hispanic or Latino
Geographical mobility - Same house 1 year ago (%) - American Indian and Alaska Native
Geographical mobility - Same house 1 year ago (%) - Multirace
Geographical mobility - Same house 1 year ago (%) - Other Race
Geographical mobility - Moved within same county (%)
Geographical mobility - Moved within same county (%) - White
Geographical mobility - Moved within same county (%) - Black or African American
Geographical mobility - Moved within same county (%) - Asian
Geographical mobility - Moved within same county (%) - Hispanic or Latino
Geographical mobility - Moved within same county (%) - American Indian and Alaska Native
Geographical mobility - Moved within same county (%) - Multirace
Geographical mobility - Moved within same county (%) - Other Race
Geographical mobility - Moved from different county within same state (%)
Geographical mobility - Moved from different county within same state (%) - White
Geographical mobility - Moved from different county within same state (%) - Black or African American
Geographical mobility - Moved from different county within same state (%) - Asian
Geographical mobility - Moved from different county within same state (%) - Hispanic or Latino
Geographical mobility - Moved from different county within same state (%) - American Indian and Alaska Native
Geographical mobility - Moved from different county within same state (%) - Multirace
Geographical mobility - Moved from different county within same state (%) - Other Race
Geographical mobility - Moved from different state (%)
Geographical mobility - Moved from different state (%) - White
Geographical mobility - Moved from different state (%) - Black or African American
Geographical mobility - Moved from different state (%) - Asian
Geographical mobility - Moved from different state (%) - Hispanic or Latino
Geographical mobility - Moved from different state (%) - American Indian and Alaska Native
Geographical mobility - Moved from different state (%) - Multirace
Geographical mobility - Moved from different state (%) - Other Race
Geographical mobility - Moved from abroad (%)
Geographical mobility - Moved from abroad (%) - White
Geographical mobility - Moved from abroad (%) - Black or African American
Geographical mobility - Moved from abroad (%) - Asian
Geographical mobility - Moved from abroad (%) - Hispanic or Latino
Geographical mobility - Moved from abroad (%) - American Indian and Alaska Native
Geographical mobility - Moved from abroad (%) - Multirace
Geographical mobility - Moved from abroad (%) - Other Race
Place of birth for the foreign-born population - Ireland (%)
Place of birth for the foreign-born population - Denmark (%)
Place of birth for the foreign-born population - Norway (%)
Place of birth for the foreign-born population - Sweden (%)
Place of birth for the foreign-born population - United Kingdom (%)
Place of birth for the foreign-born population - England (%)
Place of birth for the foreign-born population - Scotland (%)
Place of birth for the foreign-born population - Other Northern Europe (%)
Place of birth for the foreign-born population - Austria (%)
Place of birth for the foreign-born population - Belgium (%)
Place of birth for the foreign-born population - France (%)
Place of birth for the foreign-born population - Germany (%)
Place of birth for the foreign-born population - Netherlands (%)
Place of birth for the foreign-born population - Switzerland (%)
Place of birth for the foreign-born population - Other Western Europe (%)
Place of birth for the foreign-born population - Greece (%)
Place of birth for the foreign-born population - Italy (%)
Place of birth for the foreign-born population - Portugal (%)
Place of birth for the foreign-born population - Spain (%)
Place of birth for the foreign-born population - Other Southern Europe (%)
Place of birth for the foreign-born population - Albania (%)
Place of birth for the foreign-born population - Belarus (%)
Place of birth for the foreign-born population - Bosnia and Herzegovina (%)
Place of birth for the foreign-born population - Bulgaria (%)
Place of birth for the foreign-born population - Croatia (%)
Place of birth for the foreign-born population - Czechoslovakia (%)
Place of birth for the foreign-born population - Hungary (%)
Place of birth for the foreign-born population - Latvia (%)
Place of birth for the foreign-born population - Lithuania (%)
Place of birth for the foreign-born population - North Macedonia (Macedonia) (%)
Place of birth for the foreign-born population - Moldova (%)
Place of birth for the foreign-born population - Poland (%)
Place of birth for the foreign-born population - Romania (%)
Place of birth for the foreign-born population - Russia (%)
Place of birth for the foreign-born population - Serbia (%)
Place of birth for the foreign-born population - Ukraine (%)
Place of birth for the foreign-born population - Other Eastern Europe (%)
Place of birth for the foreign-born population - China (%)
Place of birth for the foreign-born population - Hong Kong (%)
Place of birth for the foreign-born population - Taiwan (%)
Place of birth for the foreign-born population - Japan (%)
Place of birth for the foreign-born population - Korea (%)
Place of birth for the foreign-born population - Other Eastern Asia (%)
Place of birth for the foreign-born population - Afghanistan (%)
Place of birth for the foreign-born population - Bangladesh (%)
Place of birth for the foreign-born population - India (%)
Place of birth for the foreign-born population - Iran (%)
Place of birth for the foreign-born population - Kazakhstan (%)
Place of birth for the foreign-born population - Nepal (%)
Place of birth for the foreign-born population - Pakistan (%)
Place of birth for the foreign-born population - Sri Lanka (%)
Place of birth for the foreign-born population - Uzbekistan (%)
Place of birth for the foreign-born population - Other South Central Asia (%)
Place of birth for the foreign-born population - Burma (%)
Place of birth for the foreign-born population - Cambodia (%)
Place of birth for the foreign-born population - Indonesia (%)
Place of birth for the foreign-born population - Laos (%)
Place of birth for the foreign-born population - Malaysia (%)
Place of birth for the foreign-born population - Philippines (%)
Place of birth for the foreign-born population - Singapore (%)
Place of birth for the foreign-born population - Thailand (%)
Place of birth for the foreign-born population - Vietnam (%)
Place of birth for the foreign-born population - Other South Eastern Asia (%)
Place of birth for the foreign-born population - Armenia (%)
Place of birth for the foreign-born population - Iraq (%)
Place of birth for the foreign-born population - Israel (%)
Place of birth for the foreign-born population - Jordan (%)
Place of birth for the foreign-born population - Kuwait (%)
Place of birth for the foreign-born population - Lebanon (%)
Place of birth for the foreign-born population - Saudi Arabia (%)
Place of birth for the foreign-born population - Syria (%)
Place of birth for the foreign-born population - Turkey (%)
Place of birth for the foreign-born population - Yemen (%)
Place of birth for the foreign-born population - Other Western Asia (%)
Place of birth for the foreign-born population - Eritrea (%)
Place of birth for the foreign-born population - Ethiopia (%)
Place of birth for the foreign-born population - Kenya (%)
Place of birth for the foreign-born population - Somalia (%)
Place of birth for the foreign-born population - Uganda (%)
Place of birth for the foreign-born population - Zimbabwe (%)
Place of birth for the foreign-born population - Other Eastern Africa (%)
Place of birth for the foreign-born population - Cameroon (%)
Place of birth for the foreign-born population - Congo (%)
Place of birth for the foreign-born population - Democratic Republic of Congo (Zaire) (%)
Place of birth for the foreign-born population - Other Middle Africa (%)
Place of birth for the foreign-born population - Egypt (%)
Place of birth for the foreign-born population - Morocco (%)
Place of birth for the foreign-born population - Sudan (%)
Place of birth for the foreign-born population - Other Northern Africa (%)
Place of birth for the foreign-born population - South Africa (%)
Place of birth for the foreign-born population - Other Southern Africa (%)
Place of birth for the foreign-born population - Cabo Verde (%)
Place of birth for the foreign-born population - Ghana (%)
Place of birth for the foreign-born population - Liberia (%)
Place of birth for the foreign-born population - Nigeria (%)
Place of birth for the foreign-born population - Senegal (%)
Place of birth for the foreign-born population - Sierra Leone (%)
Place of birth for the foreign-born population - Other Western Africa (%)
Place of birth for the foreign-born population - Australia (%)
Place of birth for the foreign-born population - New Zealand (%)
Place of birth for the foreign-born population - Fiji (%)
Place of birth for the foreign-born population - Micronesia (%)
Place of birth for the foreign-born population - Bahamas (%)
Place of birth for the foreign-born population - Barbados (%)
Place of birth for the foreign-born population - Cuba (%)
Place of birth for the foreign-born population - Dominica (%)
Place of birth for the foreign-born population - Dominican Republic (%)
Place of birth for the foreign-born population - Grenada (%)
Place of birth for the foreign-born population - Haiti (%)
Place of birth for the foreign-born population - Jamaica (%)
Place of birth for the foreign-born population - St. Vincent and the Grenadines (%)
Place of birth for the foreign-born population - Trinidad and Tobago (%)
Place of birth for the foreign-born population - West Indies (%)
Place of birth for the foreign-born population - Other Caribbean (%)
Place of birth for the foreign-born population - Belize (%)
Place of birth for the foreign-born population - Costa Rica (%)
Place of birth for the foreign-born population - El Salvador (%)
Place of birth for the foreign-born population - Guatemala (%)
Place of birth for the foreign-born population - Honduras (%)
Place of birth for the foreign-born population - Mexico (%)
Place of birth for the foreign-born population - Nicaragua (%)
Place of birth for the foreign-born population - Panama (%)
Place of birth for the foreign-born population - Other Central America (%)
Place of birth for the foreign-born population - Argentina (%)
Place of birth for the foreign-born population - Bolivia (%)
Place of birth for the foreign-born population - Brazil (%)
Place of birth for the foreign-born population - Chile (%)
Place of birth for the foreign-born population - Colombia (%)
Place of birth for the foreign-born population - Ecuador (%)
Place of birth for the foreign-born population - Guyana (%)
Place of birth for the foreign-born population - Peru (%)
Place of birth for the foreign-born population - Uruguay (%)
Place of birth for the foreign-born population - Venezuela (%)
Place of birth for the foreign-born population - Other South America (%)
Place of birth for the foreign-born population - Canada (%)
Place of birth for the foreign-born population - Other Northern America (%)
Place of birth for the foreign-born population - Other (%)
Latest news about races in Emporia, KS collected exclusively by city-data.com from local newspapers, TV, and radio stations
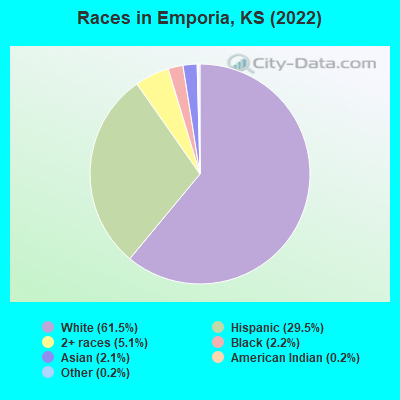
According to 2022 data, the most numerous races in Emporia, KS are White alone (14,840 residents), Hispanic (7,108 residents), and Black alone (524 residents). 80.0% of Emporia residents speak English at home. 13.6% of Emporia, KS residents are foreign-born (11.4% born in Latin America, 1.8% born in Asia), which is 48.7% greater than the foreign-born rate of 7.0% across the entire state of Kansas.
Race distribution in Emporia
2000 2022
2,233,997 83.1% White alone 188,252 7.0% Hispanic 151,407 5.6% Black alone 46,301 1.7% Asian alone 42,508 1.6% Two or more races 22,322 0.8% American Indian alone 2,477 0.09% Other race alone 1,154 0.04% Native Hawaiian and Other
2,147,943 73.1% White alone 381,746 13.0% Hispanic 147,666 5.0% Black alone 145,362 4.9% Two or more races 85,085 2.9% Asian alone 13,263 0.5% Other race alone 12,065 0.4% American Indian alone 4,020 0.1% Native Hawaiian and Other
Income and house value in Emporia Median household income in 2022 $48,391 White non-Hispanic householders$31,399 Black householders$80,462 Some other race householders$52,475 Two or more races householders$60,698 Hispanic or Latino race householdersMedian 2022 house value $152,913 White Non-Hispanic householders$126,211 Black or African American householders $133,721 Asian householders$83,236 Some other race householders$111,191 Two or more races householders$81,567 Hispanic or Latino householders
Median age by race in Emporia
33.4 Median age for White residents34.0 32.9 23.7 Median age for Black or African American residents23.7 23.8 29.4 Median age for American Indian / Alaska Native residents23.3 30.3 27.1 Median age for Asian residents33.0 20.7 -627,039,626.4 Median age for Native Hawaiian / Pacific Islander residents-669,240,668.6 -641,269,840.6 41.5 Median age for Other race residents57.0 30.1 25.5 Median age for Two or more races residents24.1 26.7 34.6 Median age for White alone residents34.8 34.6 25.8 Median age for Hispanic or Latino residents26.5 25.5
Owner/renter occupied households by race in Emporia
House owners and renters - White residents 4,147 55.2% Owner occupied3,372 44.8% Renter occupiedHouse owners and renters - Black or African American residents 106 30.4% Owner occupied243 69.6% Renter occupiedHouse owners and renters - American Indian / Alaska Native residents 30 33.8% Owner occupied58 66.2% Renter occupiedHouse owners and renters - Asian residents 172 59.8% Owner occupied116 40.2% Renter occupiedHouse owners and renters - Other race residents 268 47.9% Owner occupied292 52.1% Renter occupiedHouse owners and renters - Two or more races residents 609 35.6% Owner occupied1,103 64.4% Renter occupiedHouse owners and renters - White alone residents 3,630 52.6% Owner occupied3,275 47.4% Renter occupiedHouse owners and renters - Hispanic or Latino residents 1,228 55.6% Owner occupied982 44.4% Renter occupied
Language usage in Emporia
English speakers - Total 80.0% of residents of Emporia speak English at home.
18.3% of residents speak Spanish at home 2,055 49.6% Speak English very well2,091 50.4% Speak English less than very well1.9% of residents speak other language at home 302 69.6% Speak English very well132 30.4% Speak English less than very well
English speakers - Born in the United States 85.3% of residents of Emporia speak English at home.
14.2% of residents speak Spanish at home 665 87.5% Speak English very well95 12.5% Speak English less than very well0.8% of residents speak other language at home 44 100.0% Speak English very well
English speakers - Native, born elsewhere 24.1% of residents of Emporia speak English at home.
65.1% of residents speak Spanish at home 54 100.0% Speak English very well
English speakers - Foreign-born 15.4% of residents of Emporia speak English at home.
75.1% of residents speak Spanish at home 611 25.1% Speak English very well1,820 74.9% Speak English less than very well10.1% of residents speak other language at home 210 64.4% Speak English very well116 35.6% Speak English less than very well
White (Caucasian) - Speak only English Native:
95.8% (14,784)Foreign-born:
5.3% (36)
White (Caucasian) - Speak another language Native:
3.5% (543)Foreign-born:
84.3% (578)
Black or African American - Speak only English Native:
99.6% (498)Foreign-born:
44.5% (7)
American Indian / Alaska Native - Speak another language Native:
2.0% (2)Foreign-born:
100.0% (109)
Asian - Speak only English Native:
100.0% (69)Foreign-born:
28.9% (121)
Asian - Speak another language Native:
6.3% (4)Foreign-born:
70.5% (294)
Other race - Speak only English Native:
52.2% (372)Foreign-born:
8.0% (34)
Other race - Speak another language Native:
48.3% (344)Foreign-born:
91.5% (390)
Two or more races - Speak only English Native:
68.6% (2,118)Foreign-born:
21.2% (446)
Two or more races - Speak another language Native:
35.0% (1,081)Foreign-born:
76.9% (1,615)
White alone - Speak only English Native:
98.8% (13,962)Foreign-born:
14.0% (5)
White alone - Speak another language Native:
1.2% (176)Foreign-born:
90.0% (29)
Hispanic or Latino - Speak only English Native:
55.4% (2,026)Foreign-born:
15.6% (439)
Hispanic or Latino - Speak another language Native:
44.6% (1,629)Foreign-born:
86.2% (2,430)
Foreign-born residents in Emporia 3,293 residents are foreign born (11.4% Latin America , 1.8% Asia ).
This city:
13.6%Kansas:
7.1%
Marital status for residents in Emporia Marital status - White (Caucasian) population 15 years and over
Males 39.4% Never married45.9% Now married0.4% Separated1.5% Widowed12.8% DivorcedFemales 38.1% Never married42.6% Now married1.3% Separated8.7% Widowed9.2% DivorcedWomen who gave birth in the past 12 months Now married:
75.9% (182)Unmarried:
24.1% (58)
Women who did not give birth in the past 12 months Now married:
33.6% (1,525)Unmarried:
66.4% (3,018)
Marital status - Black or African American population 15 years and over
Males 61.1% Never married14.2% Now married5.4% Separated0.0% Widowed19.2% DivorcedFemales 52.8% Never married18.1% Now married0.0% Separated1.6% Widowed27.6% DivorcedWomen who did not give birth in the past 12 months Now married:
23.7% (47)Unmarried:
76.3% (151)
Marital status - American Indian / Alaska Native population 15 years and over
Males 78.7% Never married21.3% Now married0.0% Separated0.0% Widowed0.0% DivorcedFemales 0.0% Never married96.7% Now married0.0% Separated0.0% Widowed3.3% DivorcedWomen who did not give birth in the past 12 months Now married:
100.0% (33)Unmarried:
0.0% (0)
Marital status - Asian population 15 years and over
Males 40.4% Never married58.5% Now married0.0% Separated0.0% Widowed1.0% DivorcedFemales 55.4% Never married37.1% Now married0.0% Separated0.0% Widowed7.4% DivorcedWomen who did not give birth in the past 12 months Now married:
28.2% (44)Unmarried:
71.8% (112)
Marital status - Other race population 15 years and over
Males 33.1% Never married37.2% Now married0.0% Separated0.0% Widowed29.7% DivorcedFemales 47.9% Never married52.1% Now married0.0% Separated0.0% Widowed0.0% DivorcedWomen who gave birth in the past 12 months Now married:
100.0% (14)Unmarried:
0.0% (0)
Women who did not give birth in the past 12 months Now married:
31.7% (81)Unmarried:
68.3% (174)
Marital status - Two or more races population 15 years and over
Males 65.4% Never married32.6% Now married0.0% Separated0.0% Widowed2.1% DivorcedFemales 61.5% Never married27.8% Now married1.8% Separated0.7% Widowed8.2% DivorcedWomen who did not give birth in the past 12 months Now married:
20.6% (343)Unmarried:
79.4% (1,324)
Marital status - White alone, not Hispanic / Latino population 15 years and over
Males 39.6% Never married44.0% Now married0.4% Separated1.7% Widowed14.2% DivorcedFemales 39.4% Never married39.8% Now married0.5% Separated10.0% Widowed10.3% DivorcedWomen who gave birth in the past 12 months Now married:
71.6% (151)Unmarried:
28.4% (60)
Women who did not give birth in the past 12 months Now married:
28.9% (1,153)Unmarried:
71.1% (2,832)
Marital status - Hispanic or Latino population 15 years and over
Males 48.3% Never married44.8% Now married0.0% Separated0.0% Widowed7.0% DivorcedFemales 44.0% Never married49.5% Now married4.2% Separated0.7% Widowed1.6% DivorcedWomen who gave birth in the past 12 months Now married:
100.0% (52)Unmarried:
0.0% (0)
Women who did not give birth in the past 12 months Now married:
42.1% (794)Unmarried:
57.9% (1,091)
Ancestries in Emporia
1,653 14.6% German939 8.3% European811 7.1% American601 5.3% English437 3.9% Irish166 1.5% Scottish132 1.2% Italian99 0.9% Dutch64 0.6% French58 0.5% Polish57 0.5% Welsh53 0.5% French Canadian48 0.4% Swiss38 0.3% Scotch-Irish32 0.3% Pennsylvania German29 0.3% Norwegian26 0.2% Eastern European18 0.2% Scandinavian17 0.1% Czech12 0.1% Nigerian10 0.09% Swedish5 0.04% Luxembourger4 0.04% British4 0.04% African
Geographical mobility in Emporia Same house 1 year ago 12,592 73.6% White (Caucasian)341 64.7% Black or African American104 61.9% American Indian / Alaska Native323 54.6% Asian983 86.8% Other race3,533 67.5% Two or more races10,547 71.8% White alone, not Hispanic / Latino5,349 76.1% Hispanic or LatinoMoved within same county 2,110 12.3% White / Caucasian75 14.3% Black or African American46 27.6% American Indian / Alaska Native175 29.7% Asian106 9.3% Other race1,118 21.3% Two or more races1,783 12.1% White alone, not Hispanic / Latino1,279 18.2% Hispanic or LatinoMoved within same state 1,998 11.7% White / Caucasian17 3.2% Black or African American18 3.0% Asian9 0.8% Other race469 9.0% Two or more races2,011 13.7% White alone, not Hispanic / Latino225 3.2% Hispanic or LatinoMoved from different state 255 1.5% White / Caucasian67 12.8% Black or African American51 8.7% Asian21 1.9% Other race88 1.7% Two or more races257 1.8% White alone, not Hispanic / Latino114 1.6% Hispanic or LatinoMoved from abroad 14 0.1% White6 1.1% Black or African American38 6.5% Asian15 0.1% White alone, not Hispanic / Latino
Children Nativity (place of birth) in Emporia
Children under 6 years - Living with two parents Both parents native 956 100.0% NativeBoth parents foreign-born 152 100.0% NativeOne native, one foreign-born parent 101 100.0% NativeChildren under 6 years - Living with one parent Native parent 375 100.0% NativeForeign-born parent 118 100.0% NativeChildren 6 to 17 years - Living with two parents Both parents native 1,377 100.0% NativeBoth parents foreign-born 485 73.3% Native176 26.7% Foreign-bornOne native, one foreign-born parent 135 100.0% NativeChildren 6 to 17 years - Living with one parent Native parent 966 94.0% Native62 6.0% Foreign-bornForeign-born parent 106 83.2% Native21 16.8% Foreign-born
Grandparents responsible for own grandchildren in Emporia
Grandparents (30 to 59 years) White / Caucasian 23 22.8% Responsible for grandchildren77 77.2% Not responsible for grandchildrenTwo or more races 93 100.0% Not responsible for grandchildrenWhite alone, not Hispanic / Latino 24 23.5% Responsible for grandchildren78 76.5% Not responsible for grandchildrenHispanic or Latino 96 100.0% Not responsible for grandchildrenGrandparents (60 years and over) White / Caucasian 49 46.9% Responsible for grandchildren55 53.1% Not responsible for grandchildrenWhite alone, not Hispanic / Latino 50 68.2% Responsible for grandchildren23 31.8% Not responsible for grandchildrenHispanic or Latino 60 100.0% Not responsible for grandchildren