Races in Enid, Oklahoma (OK) Detailed Stats
Data:
Races - White alone (%)
Races - White alone (% change since 2000)
Races - Black alone (%)
Races - Black alone (% change since 2000)
Races - American Indian alone (%)
Races - American Indian alone (% change since 2000)
Races - Asian alone (%)
Races - Asian alone (% change since 2000)
Races - Hispanic (%)
Races - Hispanic (% change since 2000)
Races - Native Hawaiian and Other Pacific Islander alone (%)
Races - Native Hawaiian and Other Pacific Islander alone (% change since 2000)
Races - Two or more races(%)
Races - Two or more races(% change since 2000)
Races - Other race alone (%)
Races - Other race alone (% change since 2000)
Racial diversity
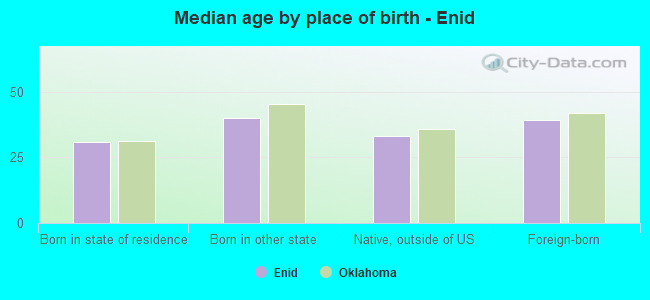
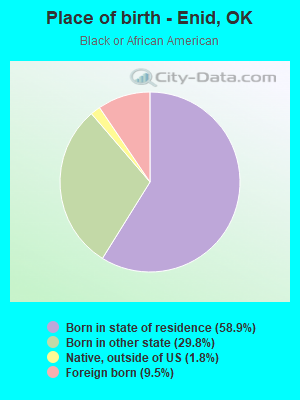
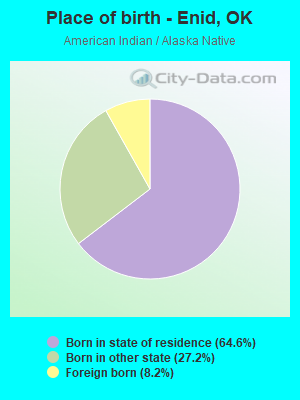
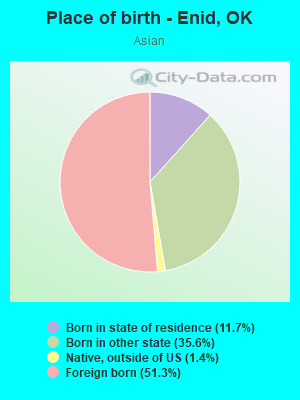
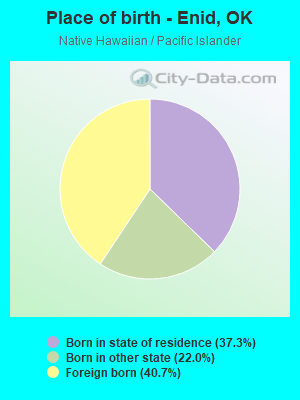
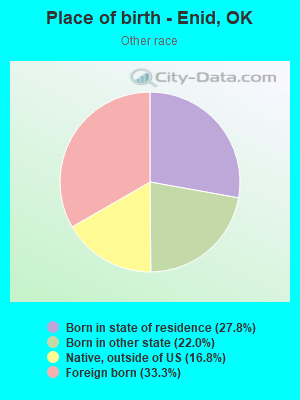
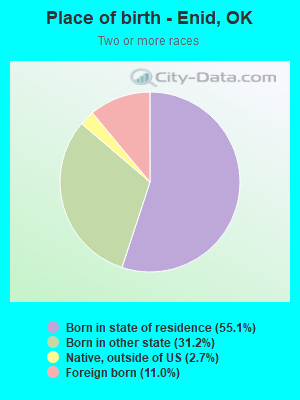
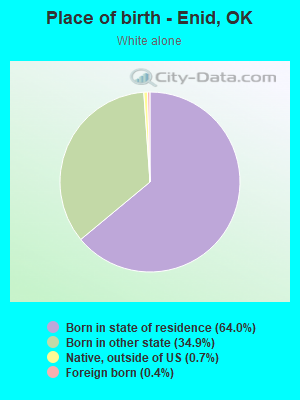
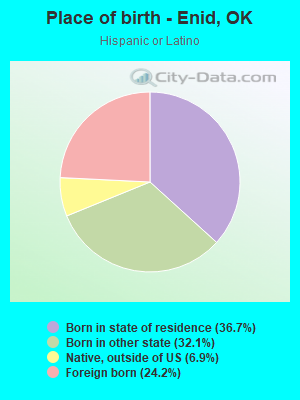
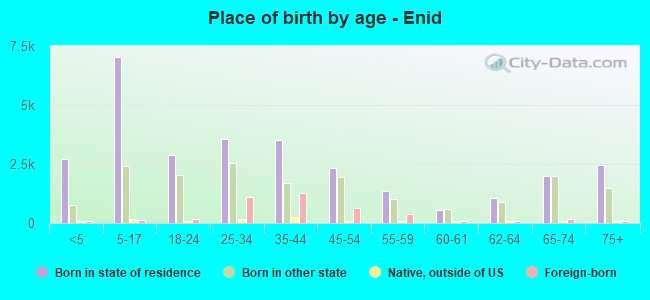
Place of birth - Born in state of residence (%)
Place of birth - Born in state of residence (%) - White
Place of birth - Born in state of residence (%) - Black or African American
Place of birth - Born in state of residence (%) - Asian
Place of birth - Born in state of residence (%) - Hispanic or Latino
Place of birth - Born in state of residence (%) - American Indian and Alaska Native
Place of birth - Born in state of residence (%) - Multirace
Place of birth - Born in state of residence (%) - Other Race
Place of birth - Born in other state (%)
Place of birth - Born in other state (%) - White
Place of birth - Born in other state (%) - Black or African American
Place of birth - Born in other state (%) - Asian
Place of birth - Born in other state (%) - Hispanic or Latino
Place of birth - Born in other state (%) - American Indian and Alaska Native
Place of birth - Born in other state (%) - Multirace
Place of birth - Born in other state (%) - Other Race
Place of birth - Native, outside of US (%)
Place of birth - Native, outside of US (%) - White
Place of birth - Native, outside of US (%) - Black or African American
Place of birth - Native, outside of US (%) - Asian
Place of birth - Native, outside of US (%) - Hispanic or Latino
Place of birth - Native, outside of US (%) - American Indian and Alaska Native
Place of birth - Native, outside of US (%) - Multirace
Place of birth - Native, outside of US (%) - Other Race
Place of birth - Foreign born (%)
Place of birth - Foreign born (%) - White
Place of birth - Foreign born (%) - Black or African American
Place of birth - Foreign born (%) - Asian
Place of birth - Foreign born (%) - Hispanic or Latino
Place of birth - Foreign born (%) - American Indian and Alaska Native
Place of birth - Foreign born (%) - Multirace
Place of birth - Foreign born (%) - Other Race
Residents speaking English at home (%)
Residents speaking English at home - Born in the United States (%)
Residents speaking English at home - Native, born elsewhere (%)
Residents speaking English at home - Foreign born (%)
Residents speaking Spanish at home (%)
Residents speaking Spanish at home - Born in the United States (%)
Residents speaking Spanish at home - Native, born elsewhere (%)
Residents speaking Spanish at home - Foreign born (%)
Residents speaking other language at home (%)
Residents speaking other language at home - Born in the United States (%)
Residents speaking other language at home - Native, born elsewhere (%)
Residents speaking other language at home - Foreign born (%)
Marital status - Never married (%)
Marital status - Now married (%)
Marital status - Separated (%)
Marital status - Widowed (%)
Marital status - Divorced (%)
Ancestries Reported - Arab (%)
Ancestries Reported - Czech (%)
Ancestries Reported - Danish (%)
Ancestries Reported - Dutch (%)
Ancestries Reported - English (%)
Ancestries Reported - French (%)
Ancestries Reported - French Canadian (%)
Ancestries Reported - German (%)
Ancestries Reported - Greek (%)
Ancestries Reported - Hungarian (%)
Ancestries Reported - Irish (%)
Ancestries Reported - Italian (%)
Ancestries Reported - Lithuanian (%)
Ancestries Reported - Norwegian (%)
Ancestries Reported - Polish (%)
Ancestries Reported - Portuguese (%)
Ancestries Reported - Russian (%)
Ancestries Reported - Scotch-Irish (%)
Ancestries Reported - Scottish (%)
Ancestries Reported - Slovak (%)
Ancestries Reported - Subsaharan African (%)
Ancestries Reported - Swedish (%)
Ancestries Reported - Swiss (%)
Ancestries Reported - Ukrainian (%)
Ancestries Reported - United States (%)
Ancestries Reported - Welsh (%)
Ancestries Reported - West Indian (%)
Ancestries Reported - Other (%)
Geographical mobility - Same house 1 year ago (%)
Geographical mobility - Same house 1 year ago (%) - White
Geographical mobility - Same house 1 year ago (%) - Black or African American
Geographical mobility - Same house 1 year ago (%) - Asian
Geographical mobility - Same house 1 year ago (%) - Hispanic or Latino
Geographical mobility - Same house 1 year ago (%) - American Indian and Alaska Native
Geographical mobility - Same house 1 year ago (%) - Multirace
Geographical mobility - Same house 1 year ago (%) - Other Race
Geographical mobility - Moved within same county (%)
Geographical mobility - Moved within same county (%) - White
Geographical mobility - Moved within same county (%) - Black or African American
Geographical mobility - Moved within same county (%) - Asian
Geographical mobility - Moved within same county (%) - Hispanic or Latino
Geographical mobility - Moved within same county (%) - American Indian and Alaska Native
Geographical mobility - Moved within same county (%) - Multirace
Geographical mobility - Moved within same county (%) - Other Race
Geographical mobility - Moved from different county within same state (%)
Geographical mobility - Moved from different county within same state (%) - White
Geographical mobility - Moved from different county within same state (%) - Black or African American
Geographical mobility - Moved from different county within same state (%) - Asian
Geographical mobility - Moved from different county within same state (%) - Hispanic or Latino
Geographical mobility - Moved from different county within same state (%) - American Indian and Alaska Native
Geographical mobility - Moved from different county within same state (%) - Multirace
Geographical mobility - Moved from different county within same state (%) - Other Race
Geographical mobility - Moved from different state (%)
Geographical mobility - Moved from different state (%) - White
Geographical mobility - Moved from different state (%) - Black or African American
Geographical mobility - Moved from different state (%) - Asian
Geographical mobility - Moved from different state (%) - Hispanic or Latino
Geographical mobility - Moved from different state (%) - American Indian and Alaska Native
Geographical mobility - Moved from different state (%) - Multirace
Geographical mobility - Moved from different state (%) - Other Race
Geographical mobility - Moved from abroad (%)
Geographical mobility - Moved from abroad (%) - White
Geographical mobility - Moved from abroad (%) - Black or African American
Geographical mobility - Moved from abroad (%) - Asian
Geographical mobility - Moved from abroad (%) - Hispanic or Latino
Geographical mobility - Moved from abroad (%) - American Indian and Alaska Native
Geographical mobility - Moved from abroad (%) - Multirace
Geographical mobility - Moved from abroad (%) - Other Race
Place of birth for the foreign-born population - Ireland (%)
Place of birth for the foreign-born population - Denmark (%)
Place of birth for the foreign-born population - Norway (%)
Place of birth for the foreign-born population - Sweden (%)
Place of birth for the foreign-born population - United Kingdom (%)
Place of birth for the foreign-born population - England (%)
Place of birth for the foreign-born population - Scotland (%)
Place of birth for the foreign-born population - Other Northern Europe (%)
Place of birth for the foreign-born population - Austria (%)
Place of birth for the foreign-born population - Belgium (%)
Place of birth for the foreign-born population - France (%)
Place of birth for the foreign-born population - Germany (%)
Place of birth for the foreign-born population - Netherlands (%)
Place of birth for the foreign-born population - Switzerland (%)
Place of birth for the foreign-born population - Other Western Europe (%)
Place of birth for the foreign-born population - Greece (%)
Place of birth for the foreign-born population - Italy (%)
Place of birth for the foreign-born population - Portugal (%)
Place of birth for the foreign-born population - Spain (%)
Place of birth for the foreign-born population - Other Southern Europe (%)
Place of birth for the foreign-born population - Albania (%)
Place of birth for the foreign-born population - Belarus (%)
Place of birth for the foreign-born population - Bosnia and Herzegovina (%)
Place of birth for the foreign-born population - Bulgaria (%)
Place of birth for the foreign-born population - Croatia (%)
Place of birth for the foreign-born population - Czechoslovakia (%)
Place of birth for the foreign-born population - Hungary (%)
Place of birth for the foreign-born population - Latvia (%)
Place of birth for the foreign-born population - Lithuania (%)
Place of birth for the foreign-born population - North Macedonia (Macedonia) (%)
Place of birth for the foreign-born population - Moldova (%)
Place of birth for the foreign-born population - Poland (%)
Place of birth for the foreign-born population - Romania (%)
Place of birth for the foreign-born population - Russia (%)
Place of birth for the foreign-born population - Serbia (%)
Place of birth for the foreign-born population - Ukraine (%)
Place of birth for the foreign-born population - Other Eastern Europe (%)
Place of birth for the foreign-born population - China (%)
Place of birth for the foreign-born population - Hong Kong (%)
Place of birth for the foreign-born population - Taiwan (%)
Place of birth for the foreign-born population - Japan (%)
Place of birth for the foreign-born population - Korea (%)
Place of birth for the foreign-born population - Other Eastern Asia (%)
Place of birth for the foreign-born population - Afghanistan (%)
Place of birth for the foreign-born population - Bangladesh (%)
Place of birth for the foreign-born population - India (%)
Place of birth for the foreign-born population - Iran (%)
Place of birth for the foreign-born population - Kazakhstan (%)
Place of birth for the foreign-born population - Nepal (%)
Place of birth for the foreign-born population - Pakistan (%)
Place of birth for the foreign-born population - Sri Lanka (%)
Place of birth for the foreign-born population - Uzbekistan (%)
Place of birth for the foreign-born population - Other South Central Asia (%)
Place of birth for the foreign-born population - Burma (%)
Place of birth for the foreign-born population - Cambodia (%)
Place of birth for the foreign-born population - Indonesia (%)
Place of birth for the foreign-born population - Laos (%)
Place of birth for the foreign-born population - Malaysia (%)
Place of birth for the foreign-born population - Philippines (%)
Place of birth for the foreign-born population - Singapore (%)
Place of birth for the foreign-born population - Thailand (%)
Place of birth for the foreign-born population - Vietnam (%)
Place of birth for the foreign-born population - Other South Eastern Asia (%)
Place of birth for the foreign-born population - Armenia (%)
Place of birth for the foreign-born population - Iraq (%)
Place of birth for the foreign-born population - Israel (%)
Place of birth for the foreign-born population - Jordan (%)
Place of birth for the foreign-born population - Kuwait (%)
Place of birth for the foreign-born population - Lebanon (%)
Place of birth for the foreign-born population - Saudi Arabia (%)
Place of birth for the foreign-born population - Syria (%)
Place of birth for the foreign-born population - Turkey (%)
Place of birth for the foreign-born population - Yemen (%)
Place of birth for the foreign-born population - Other Western Asia (%)
Place of birth for the foreign-born population - Eritrea (%)
Place of birth for the foreign-born population - Ethiopia (%)
Place of birth for the foreign-born population - Kenya (%)
Place of birth for the foreign-born population - Somalia (%)
Place of birth for the foreign-born population - Uganda (%)
Place of birth for the foreign-born population - Zimbabwe (%)
Place of birth for the foreign-born population - Other Eastern Africa (%)
Place of birth for the foreign-born population - Cameroon (%)
Place of birth for the foreign-born population - Congo (%)
Place of birth for the foreign-born population - Democratic Republic of Congo (Zaire) (%)
Place of birth for the foreign-born population - Other Middle Africa (%)
Place of birth for the foreign-born population - Egypt (%)
Place of birth for the foreign-born population - Morocco (%)
Place of birth for the foreign-born population - Sudan (%)
Place of birth for the foreign-born population - Other Northern Africa (%)
Place of birth for the foreign-born population - South Africa (%)
Place of birth for the foreign-born population - Other Southern Africa (%)
Place of birth for the foreign-born population - Cabo Verde (%)
Place of birth for the foreign-born population - Ghana (%)
Place of birth for the foreign-born population - Liberia (%)
Place of birth for the foreign-born population - Nigeria (%)
Place of birth for the foreign-born population - Senegal (%)
Place of birth for the foreign-born population - Sierra Leone (%)
Place of birth for the foreign-born population - Other Western Africa (%)
Place of birth for the foreign-born population - Australia (%)
Place of birth for the foreign-born population - New Zealand (%)
Place of birth for the foreign-born population - Fiji (%)
Place of birth for the foreign-born population - Micronesia (%)
Place of birth for the foreign-born population - Bahamas (%)
Place of birth for the foreign-born population - Barbados (%)
Place of birth for the foreign-born population - Cuba (%)
Place of birth for the foreign-born population - Dominica (%)
Place of birth for the foreign-born population - Dominican Republic (%)
Place of birth for the foreign-born population - Grenada (%)
Place of birth for the foreign-born population - Haiti (%)
Place of birth for the foreign-born population - Jamaica (%)
Place of birth for the foreign-born population - St. Vincent and the Grenadines (%)
Place of birth for the foreign-born population - Trinidad and Tobago (%)
Place of birth for the foreign-born population - West Indies (%)
Place of birth for the foreign-born population - Other Caribbean (%)
Place of birth for the foreign-born population - Belize (%)
Place of birth for the foreign-born population - Costa Rica (%)
Place of birth for the foreign-born population - El Salvador (%)
Place of birth for the foreign-born population - Guatemala (%)
Place of birth for the foreign-born population - Honduras (%)
Place of birth for the foreign-born population - Mexico (%)
Place of birth for the foreign-born population - Nicaragua (%)
Place of birth for the foreign-born population - Panama (%)
Place of birth for the foreign-born population - Other Central America (%)
Place of birth for the foreign-born population - Argentina (%)
Place of birth for the foreign-born population - Bolivia (%)
Place of birth for the foreign-born population - Brazil (%)
Place of birth for the foreign-born population - Chile (%)
Place of birth for the foreign-born population - Colombia (%)
Place of birth for the foreign-born population - Ecuador (%)
Place of birth for the foreign-born population - Guyana (%)
Place of birth for the foreign-born population - Peru (%)
Place of birth for the foreign-born population - Uruguay (%)
Place of birth for the foreign-born population - Venezuela (%)
Place of birth for the foreign-born population - Other South America (%)
Place of birth for the foreign-born population - Canada (%)
Place of birth for the foreign-born population - Other Northern America (%)
Place of birth for the foreign-born population - Other (%)
Latest news about races in Enid, OK collected exclusively by city-data.com from local newspapers, TV, and radio stations
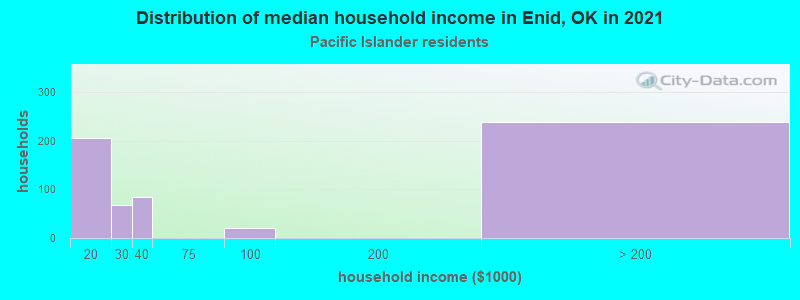
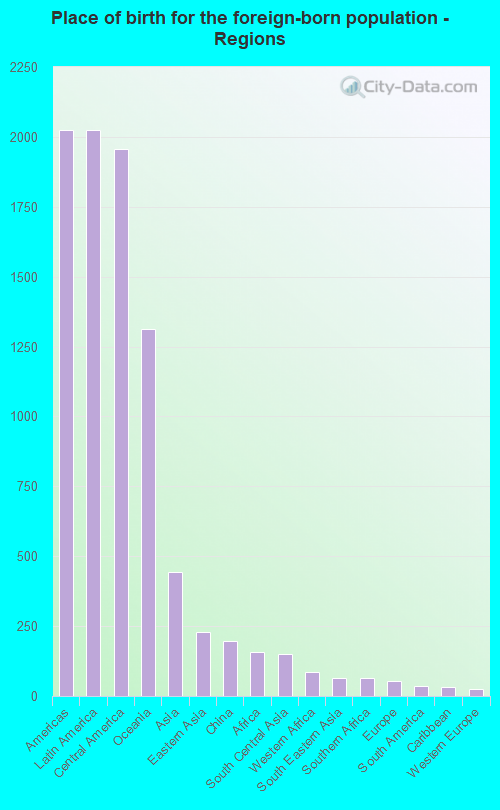
According to 2022 data, the most numerous races in Enid, OK are White alone (34,869 residents), Hispanic (8,416 residents), and Two or more races (3,363 residents). 84.8% of Enid residents speak English at home. 7.7% of Enid, OK residents are foreign-born (4.0% born in Latin America, 2.6% born in Oceania, 0.9% born in Asia), which is 22.6% greater than the foreign-born rate of 6.0% across the entire state of Oklahoma.
Race distribution in Enid
2000 2022
2,556,368 74.1% White alone 266,158 7.7% American Indian alone 257,981 7.5% Black alone 179,304 5.2% Hispanic 140,249 4.1% Two or more races 46,172 1.3% Asian alone 2,322 0.07% Other race alone 2,100 0.06% Native Hawaiian and Other
2,517,403 62.6% White alone 486,692 12.1% Hispanic 364,453 9.1% Two or more races 273,650 6.8% American Indian alone 268,543 6.7% Black alone 92,672 2.3% Asian alone 10,786 0.3% Other race alone 5,601 0.1% Native Hawaiian and Other
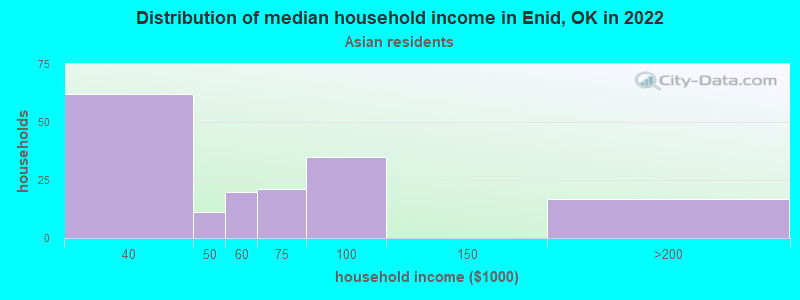
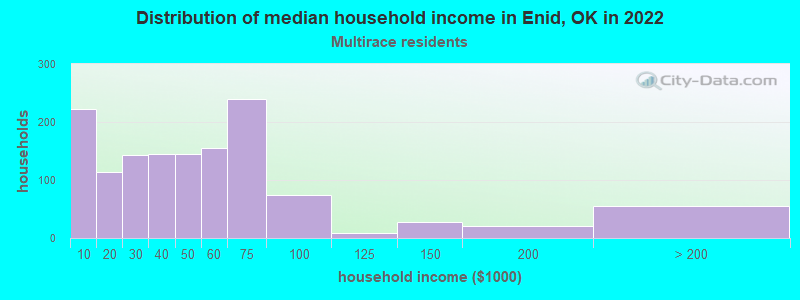
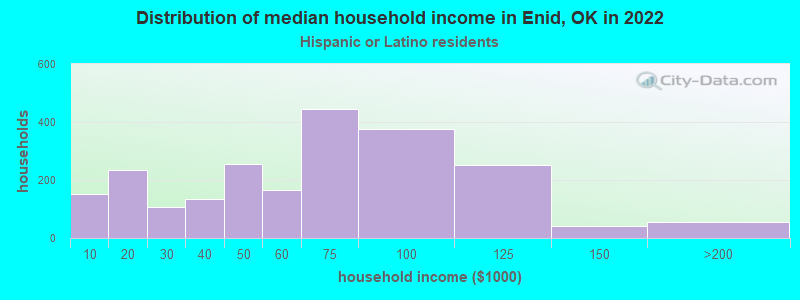
Income and house value in Enid Median household income in 2022 $61,947 White non-Hispanic householders$36,564 Black householders$44,297 American Indian and Alaska Native householders$49,151 Asian householders$61,269 Some other race householders$43,086 Two or more races householders$60,797 Hispanic or Latino race householdersMedian 2022 house value $156,604 White Non-Hispanic householders$97,094 Black or African American householders$145,120 American Indian or Alaska Native householders $166,000 Asian householders$99,182 Some other race householders$128,415 Two or more races householders$116,148 Hispanic or Latino householders
Median age by race in Enid
40.0 Median age for White residents38.1 41.9 37.2 Median age for Black or African American residents37.4 39.9 34.8 Median age for American Indian / Alaska Native residents22.4 45.0 29.8 Median age for Asian residents8.0 39.6 21.6 Median age for Native Hawaiian / Pacific Islander residents25.1 22.3 32.1 Median age for Other race residents34.6 27.5 20.9 Median age for Two or more races residents17.0 24.7 41.0 Median age for White alone residents39.6 43.0 21.9 Median age for Hispanic or Latino residents21.9 21.6
Owner/renter occupied households by race in Enid
House owners and renters - White residents 10,284 64.2% Owner occupied5,746 35.8% Renter occupiedHouse owners and renters - Black or African American residents 251 47.7% Owner occupied276 52.3% Renter occupiedHouse owners and renters - American Indian / Alaska Native residents 205 66.2% Owner occupied104 33.8% Renter occupiedHouse owners and renters - Asian residents 74 41.6% Owner occupied105 58.4% Renter occupiedHouse owners and renters - Native Hawaiian / Pacific Islander residents 36 6.9% Owner occupied489 93.1% Renter occupiedHouse owners and renters - Other race residents 419 42.5% Owner occupied567 57.5% Renter occupiedHouse owners and renters - Two or more races residents 785 59.2% Owner occupied541 40.8% Renter occupiedHouse owners and renters - White alone residents 10,061 64.6% Owner occupied5,522 35.4% Renter occupiedHouse owners and renters - Hispanic or Latino residents 1,137 51.2% Owner occupied1,083 48.8% Renter occupied
Language usage in Enid
English speakers - Total 84.8% of residents of Enid speak English at home.
9.7% of residents speak Spanish at home 2,682 57.5% Speak English very well1,981 42.5% Speak English less than very well5.4% of residents speak other language at home 1,720 66.1% Speak English very well883 33.9% Speak English less than very well
English speakers - Born in the United States 88.9% of residents of Enid speak English at home.
8.9% of residents speak Spanish at home 1,144 77.9% Speak English very well325 22.1% Speak English less than very well2.5% of residents speak other language at home 416 100.0% Speak English very well
English speakers - Native, born elsewhere 66.6% of residents of Enid speak English at home.
29.7% of residents speak Spanish at home 138 58.5% Speak English very well98 41.5% Speak English less than very well3.1% of residents speak other language at home 25 100.0% Speak English very well
English speakers - Foreign-born 11.1% of residents of Enid speak English at home.
47.8% of residents speak Spanish at home 488 25.9% Speak English very well1,395 74.1% Speak English less than very well41.1% of residents speak other language at home 862 53.2% Speak English very well757 46.8% Speak English less than very well
White (Caucasian) - Speak only English Native:
97.3% (33,444)Foreign-born:
13.4% (61)
White (Caucasian) - Speak another language Native:
2.6% (889)Foreign-born:
76.8% (348)
Black or African American - Speak only English Native:
94.3% (1,032)Foreign-born:
22.8% (26)
Black or African American - Speak another language Native:
5.5% (60)Foreign-born:
78.8% (91)
American Indian / Alaska Native - Speak another language Native:
20.9% (205)Foreign-born:
100.0% (88)
Asian - Speak only English Native:
29.1% (86)Foreign-born:
3.6% (15)
Asian - Speak another language Native:
71.0% (209)Foreign-born:
97.2% (402)
Native Hawaiian / Pacific Islander - Speak only English Native:
43.4% (570)Foreign-born:
16.9% (191)
Native Hawaiian / Pacific Islander - Speak another language Native:
55.5% (730)Foreign-born:
82.2% (932)
Other race - Speak only English Native:
35.3% (632)Foreign-born:
0.2% (2)
Other race - Speak another language Native:
65.1% (1,166)Foreign-born:
99.7% (1,009)
Two or more races - Speak only English Native:
87.2% (3,782)Foreign-born:
12.4% (82)
Two or more races - Speak another language Native:
12.0% (519)Foreign-born:
85.0% (564)
White alone - Speak only English Native:
98.7% (32,545)Foreign-born:
27.6% (41)
White alone - Speak another language Native:
1.3% (415)Foreign-born:
71.1% (106)
Hispanic or Latino - Speak only English Native:
51.2% (2,821)Foreign-born:
3.7% (74)
Hispanic or Latino - Speak another language Native:
48.8% (2,688)Foreign-born:
96.0% (1,913)
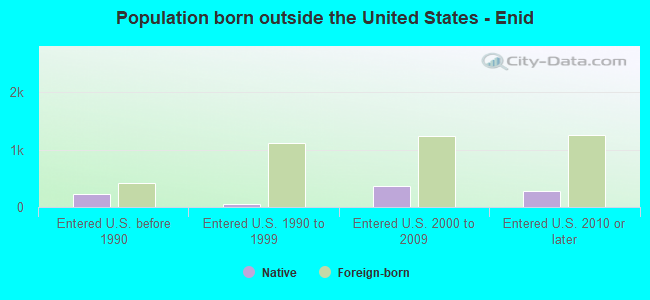
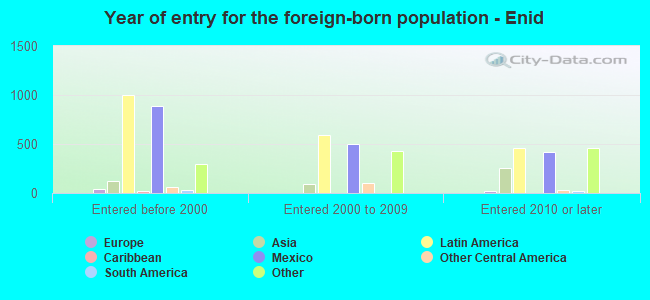
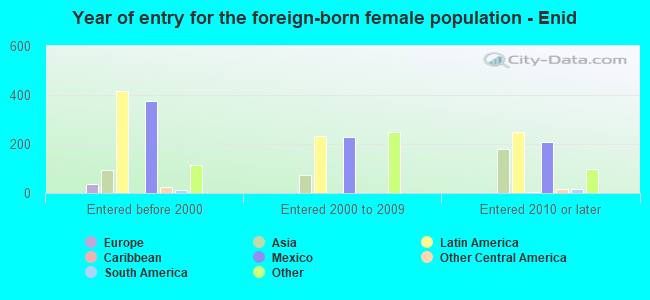
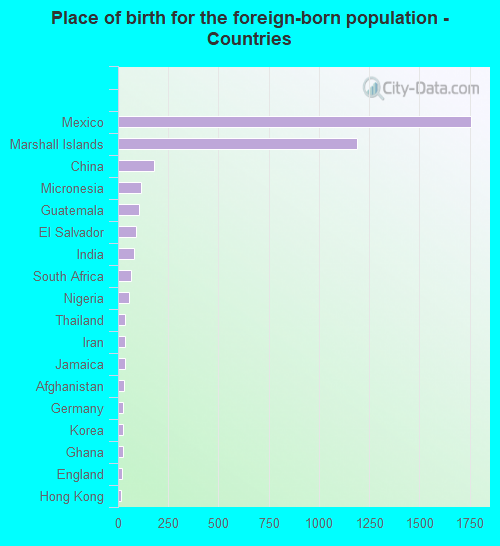
Foreign-born residents in Enid 3,998 residents are foreign born (4.0% Latin America , 2.6% Oceania , 0.9% Asia ).
This city:
7.7%Oklahoma:
6.1%
Marital status for residents in Enid Marital status - White (Caucasian) population 15 years and over
Males 33.7% Never married50.5% Now married1.4% Separated2.6% Widowed11.8% DivorcedFemales 23.8% Never married48.5% Now married1.2% Separated11.6% Widowed14.9% DivorcedWomen who gave birth in the past 12 months Now married:
71.1% (426)Unmarried:
28.9% (174)
Women who did not give birth in the past 12 months Now married:
48.1% (3,402)Unmarried:
51.9% (3,674)
Marital status - Black or African American population 15 years and over
Males 55.3% Never married17.0% Now married4.1% Separated2.9% Widowed20.6% DivorcedFemales 33.9% Never married15.5% Now married0.0% Separated19.0% Widowed31.5% DivorcedWomen who gave birth in the past 12 months Now married:
100.0% (11)Unmarried:
0.0% (0)
Women who did not give birth in the past 12 months Now married:
26.0% (38)Unmarried:
74.0% (107)
Marital status - American Indian / Alaska Native population 15 years and over
Males 55.4% Never married30.1% Now married2.9% Separated5.4% Widowed6.1% DivorcedFemales 33.3% Never married49.2% Now married0.0% Separated9.1% Widowed8.3% DivorcedWomen who gave birth in the past 12 months Now married:
100.0% (7)Unmarried:
0.0% (0)
Women who did not give birth in the past 12 months Now married:
39.2% (74)Unmarried:
60.8% (115)
Marital status - Asian population 15 years and over
Males 65.7% Never married23.0% Now married5.6% Separated0.0% Widowed5.6% DivorcedFemales 13.4% Never married71.7% Now married5.0% Separated10.0% Widowed0.0% DivorcedWomen who gave birth in the past 12 months Now married:
100.0% (25)Unmarried:
0.0% (0)
Women who did not give birth in the past 12 months Now married:
74.7% (127)Unmarried:
25.3% (43)
Marital status - Native Hawaiian / Pacific Islander population 15 years and over
Males 40.4% Never married59.6% Now married0.0% Separated0.0% Widowed0.0% DivorcedFemales 51.1% Never married48.9% Now married0.0% Separated0.0% Widowed0.0% DivorcedWomen who gave birth in the past 12 months Now married:
100.0% (151)Unmarried:
0.0% (0)
Women who did not give birth in the past 12 months Now married:
35.3% (291)Unmarried:
64.7% (532)
Marital status - Other race population 15 years and over
Males 47.6% Never married41.2% Now married0.0% Separated2.1% Widowed9.0% DivorcedFemales 45.3% Never married45.7% Now married0.0% Separated4.7% Widowed4.2% DivorcedWomen who gave birth in the past 12 months Now married:
100.0% (8)Unmarried:
0.0% (0)
Women who did not give birth in the past 12 months Now married:
48.5% (441)Unmarried:
51.5% (469)
Marital status - Two or more races population 15 years and over
Males 54.0% Never married26.6% Now married0.4% Separated7.5% Widowed11.5% DivorcedFemales 43.3% Never married34.6% Now married2.3% Separated4.4% Widowed15.4% DivorcedWomen who did not give birth in the past 12 months Now married:
37.5% (597)Unmarried:
62.5% (995)
Marital status - White alone, not Hispanic / Latino population 15 years and over
Males 32.4% Never married51.2% Now married1.3% Separated2.8% Widowed12.4% DivorcedFemales 23.0% Never married48.2% Now married1.3% Separated12.3% Widowed15.2% DivorcedWomen who gave birth in the past 12 months Now married:
72.2% (407)Unmarried:
27.8% (157)
Women who did not give birth in the past 12 months Now married:
48.2% (3,243)Unmarried:
51.8% (3,484)
Marital status - Hispanic or Latino population 15 years and over
Males 49.2% Never married41.4% Now married1.4% Separated1.5% Widowed6.6% DivorcedFemales 37.7% Never married48.3% Now married0.5% Separated4.3% Widowed9.1% DivorcedWomen who gave birth in the past 12 months Now married:
69.7% (58)Unmarried:
30.3% (25)
Women who did not give birth in the past 12 months Now married:
50.8% (1,011)Unmarried:
49.2% (978)
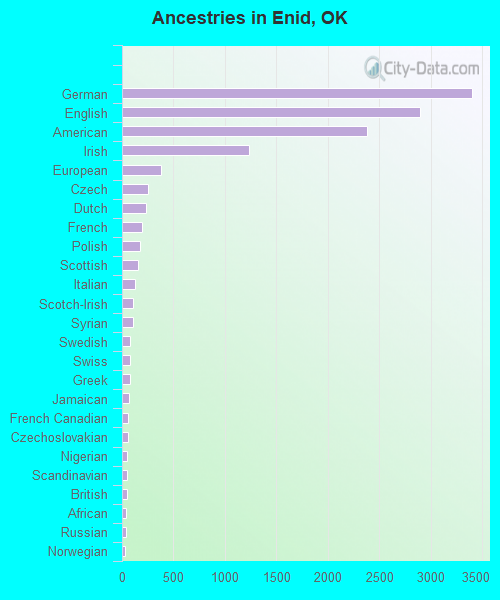
Ancestries in Enid
3,394 14.0% German2,898 12.0% English2,379 9.8% American1,238 5.1% Irish375 1.5% European249 1.0% Czech233 1.0% Dutch190 0.8% French178 0.7% Polish155 0.6% Scottish130 0.5% Italian110 0.5% Scotch-Irish105 0.4% Syrian77 0.3% Swedish76 0.3% Swiss75 0.3% Greek64 0.3% Jamaican62 0.3% French Canadian55 0.2% Czechoslovakian51 0.2% Nigerian48 0.2% Scandinavian44 0.2% British43 0.2% African42 0.2% Russian31 0.1% Norwegian29 0.1% Northern European29 0.1% Australian22 0.09% Afghan17 0.07% Welsh11 0.05% Pennsylvania German10 0.04% Lebanese9 0.04% Iranian8 0.03% Macedonian6 0.02% Moroccan2 0.01% Eastern European
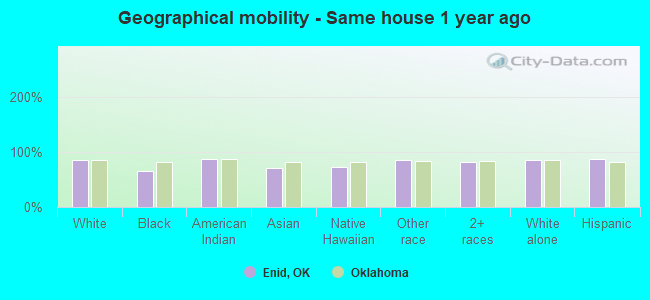
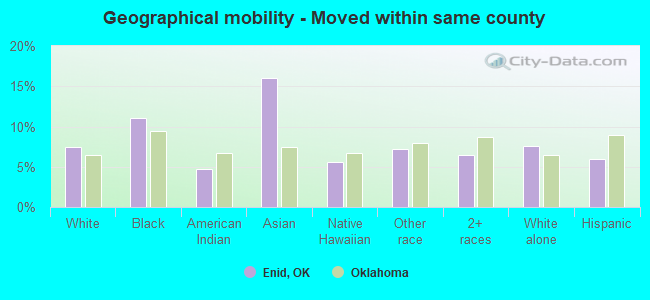
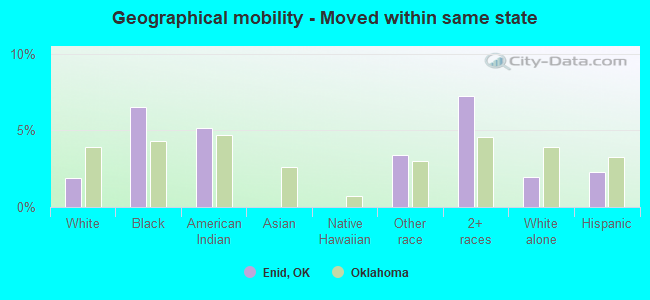
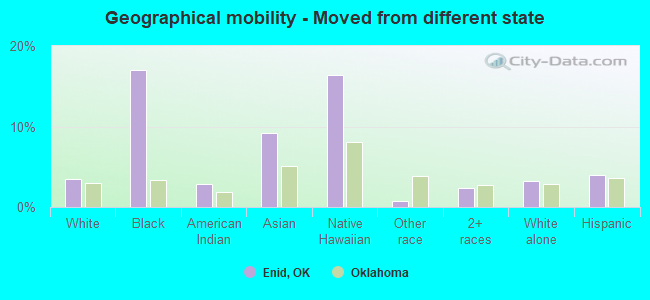
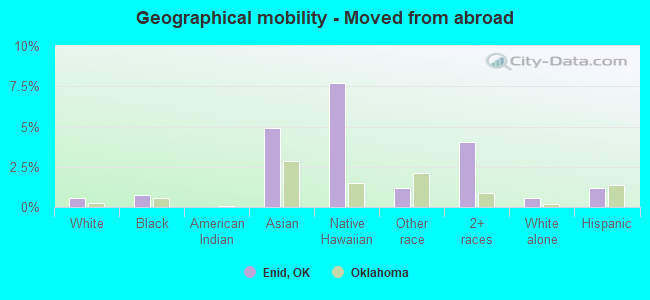
Geographical mobility in Enid Same house 1 year ago 31,228 86.3% White (Caucasian)793 65.3% Black or African American926 87.9% American Indian / Alaska Native525 71.1% Asian2,084 73.7% Native Hawaiian / Pacific Islander2,693 86.1% Other race4,730 81.6% Two or more races29,794 86.5% White alone, not Hispanic / Latino7,281 87.0% Hispanic or LatinoMoved within same county 2,692 7.4% White / Caucasian135 11.1% Black or African American49 4.7% American Indian / Alaska Native118 16.0% Asian157 5.6% Native Hawaiian / Pacific Islander224 7.1% Other race371 6.4% Two or more races2,620 7.6% White alone, not Hispanic / Latino497 5.9% Hispanic or LatinoMoved within same state 695 1.9% White / Caucasian80 6.5% Black or African American54 5.1% American Indian / Alaska Native105 3.4% Other race421 7.3% Two or more races669 1.9% White alone, not Hispanic / Latino190 2.3% Hispanic or LatinoMoved from different state 1,280 3.5% White / Caucasian206 17.0% Black or African American31 2.9% American Indian / Alaska Native68 9.2% Asian463 16.4% Native Hawaiian / Pacific Islander22 0.7% Other race136 2.3% Two or more races1,105 3.2% White alone, not Hispanic / Latino334 4.0% Hispanic or LatinoMoved from abroad 197 0.5% White9 0.8% Black or African American36 4.9% Asian218 7.7% Native Hawaiian / Pacific Islander37 1.2% Other race233 4.0% Two or more races203 0.6% White alone, not Hispanic / Latino96 1.2% Hispanic or Latino
Children Nativity (place of birth) in Enid
Children under 6 years - Living with two parents Both parents native 1,599 100.0% NativeBoth parents foreign-born 407 100.0% NativeOne native, one foreign-born parent 82 59.1% Native57 40.9% Foreign-bornChildren under 6 years - Living with one parent Native parent 1,343 100.0% NativeForeign-born parent 264 100.0% NativeChildren 6 to 17 years - Living with two parents Both parents native 4,021 100.0% NativeBoth parents foreign-born 1,010 92.4% Native83 7.6% Foreign-bornOne native, one foreign-born parent 236 87.4% Native34 12.6% Foreign-bornChildren 6 to 17 years - Living with one parent Native parent 2,894 100.0% NativeForeign-born parent 489 50.8% Native474 49.2% Foreign-born
Grandparents responsible for own grandchildren in Enid
Grandparents (30 to 59 years) White / Caucasian 75 42.4% Responsible for grandchildren102 57.6% Not responsible for grandchildrenAmerican Indian / Alaska Native 9 59.3% Responsible for grandchildren6 40.7% Not responsible for grandchildrenAsian 24 100.0% Not responsible for grandchildrenOther race 19 100.0% Responsible for grandchildrenWhite alone, not Hispanic / Latino 78 41.0% Responsible for grandchildren112 59.0% Not responsible for grandchildrenHispanic or Latino 19 100.0% Responsible for grandchildrenGrandparents (60 years and over) White / Caucasian 179 73.4% Responsible for grandchildren65 26.6% Not responsible for grandchildrenAmerican Indian / Alaska Native 27 100.0% Not responsible for grandchildrenOther race 38 100.0% Not responsible for grandchildrenWhite alone, not Hispanic / Latino 179 72.5% Responsible for grandchildren68 27.5% Not responsible for grandchildrenHispanic or Latino 29 100.0% Not responsible for grandchildren