Races in Eustis, Florida (FL) Detailed Stats
Data:
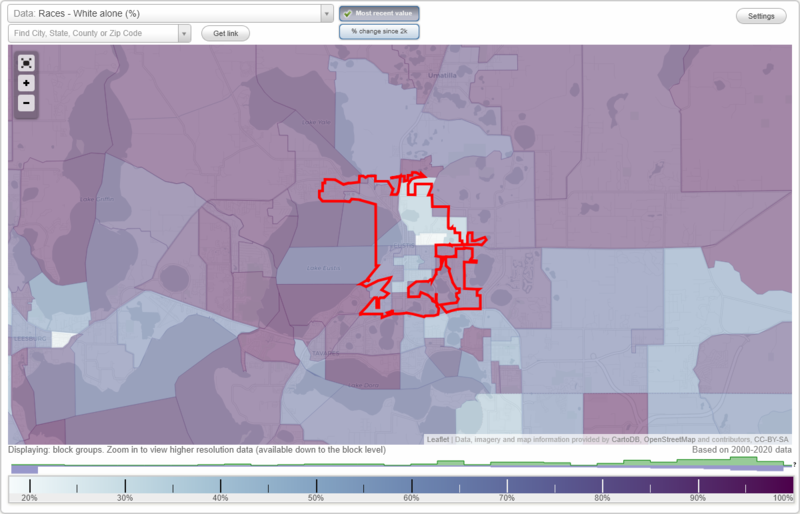
Races - White alone (%)
Races - White alone (% change since 2000)
Races - Black alone (%)
Races - Black alone (% change since 2000)
Races - American Indian alone (%)
Races - American Indian alone (% change since 2000)
Races - Asian alone (%)
Races - Asian alone (% change since 2000)
Races - Hispanic (%)
Races - Hispanic (% change since 2000)
Races - Native Hawaiian and Other Pacific Islander alone (%)
Races - Native Hawaiian and Other Pacific Islander alone (% change since 2000)
Races - Two or more races(%)
Races - Two or more races(% change since 2000)
Races - Other race alone (%)
Races - Other race alone (% change since 2000)
Racial diversity
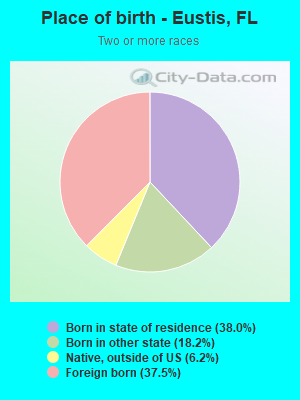
Place of birth - Born in state of residence (%)
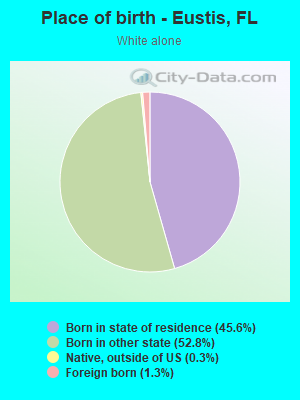
Place of birth - Born in state of residence (%) - White
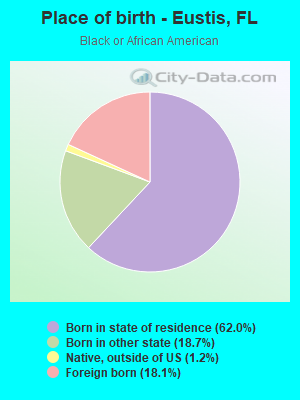
Place of birth - Born in state of residence (%) - Black or African American
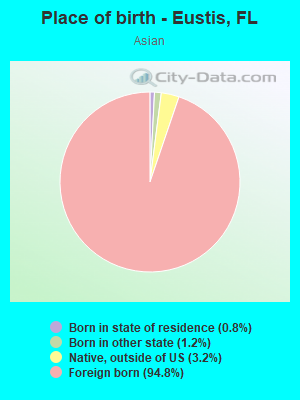
Place of birth - Born in state of residence (%) - Asian
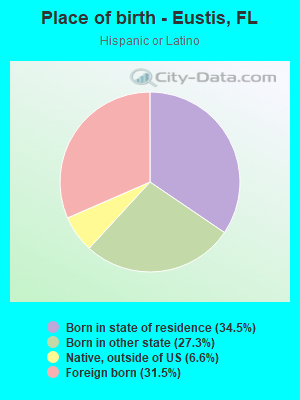
Place of birth - Born in state of residence (%) - Hispanic or Latino
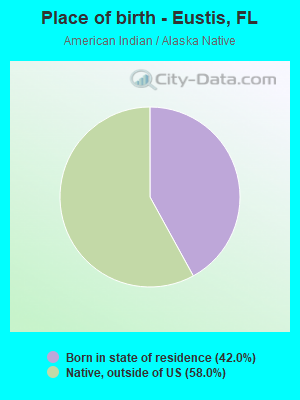
Place of birth - Born in state of residence (%) - American Indian and Alaska Native
Place of birth - Born in state of residence (%) - Multirace
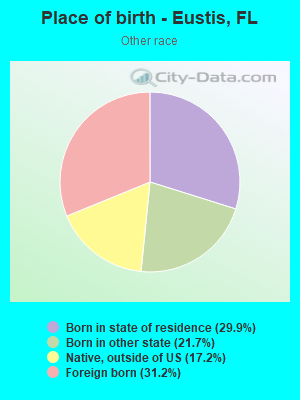
Place of birth - Born in state of residence (%) - Other Race
Place of birth - Born in other state (%)
Place of birth - Born in other state (%) - White
Place of birth - Born in other state (%) - Black or African American
Place of birth - Born in other state (%) - Asian
Place of birth - Born in other state (%) - Hispanic or Latino
Place of birth - Born in other state (%) - American Indian and Alaska Native
Place of birth - Born in other state (%) - Multirace
Place of birth - Born in other state (%) - Other Race
Place of birth - Native, outside of US (%)
Place of birth - Native, outside of US (%) - White
Place of birth - Native, outside of US (%) - Black or African American
Place of birth - Native, outside of US (%) - Asian
Place of birth - Native, outside of US (%) - Hispanic or Latino
Place of birth - Native, outside of US (%) - American Indian and Alaska Native
Place of birth - Native, outside of US (%) - Multirace
Place of birth - Native, outside of US (%) - Other Race
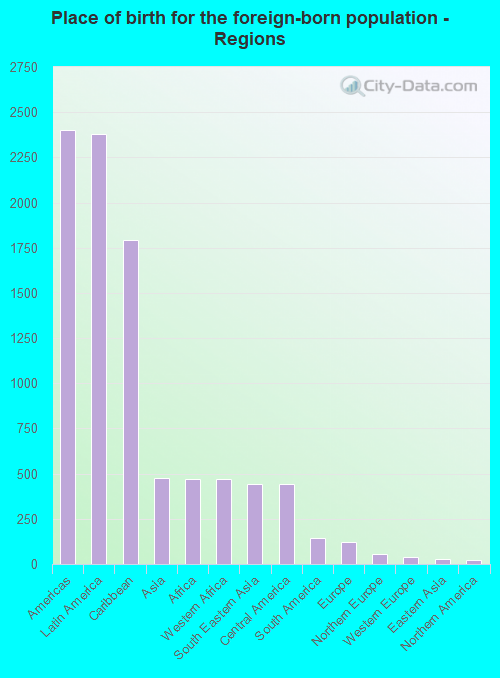
Place of birth - Foreign born (%)
Place of birth - Foreign born (%) - White
Place of birth - Foreign born (%) - Black or African American
Place of birth - Foreign born (%) - Asian
Place of birth - Foreign born (%) - Hispanic or Latino
Place of birth - Foreign born (%) - American Indian and Alaska Native
Place of birth - Foreign born (%) - Multirace
Place of birth - Foreign born (%) - Other Race
Residents speaking English at home (%)
Residents speaking English at home - Born in the United States (%)
Residents speaking English at home - Native, born elsewhere (%)
Residents speaking English at home - Foreign born (%)
Residents speaking Spanish at home (%)
Residents speaking Spanish at home - Born in the United States (%)
Residents speaking Spanish at home - Native, born elsewhere (%)
Residents speaking Spanish at home - Foreign born (%)
Residents speaking other language at home (%)
Residents speaking other language at home - Born in the United States (%)
Residents speaking other language at home - Native, born elsewhere (%)
Residents speaking other language at home - Foreign born (%)
Marital status - Never married (%)
Marital status - Now married (%)
Marital status - Separated (%)
Marital status - Widowed (%)
Marital status - Divorced (%)
Ancestries Reported - Arab (%)
Ancestries Reported - Czech (%)
Ancestries Reported - Danish (%)
Ancestries Reported - Dutch (%)
Ancestries Reported - English (%)
Ancestries Reported - French (%)
Ancestries Reported - French Canadian (%)
Ancestries Reported - German (%)
Ancestries Reported - Greek (%)
Ancestries Reported - Hungarian (%)
Ancestries Reported - Irish (%)
Ancestries Reported - Italian (%)
Ancestries Reported - Lithuanian (%)
Ancestries Reported - Norwegian (%)
Ancestries Reported - Polish (%)
Ancestries Reported - Portuguese (%)
Ancestries Reported - Russian (%)
Ancestries Reported - Scotch-Irish (%)
Ancestries Reported - Scottish (%)
Ancestries Reported - Slovak (%)
Ancestries Reported - Subsaharan African (%)
Ancestries Reported - Swedish (%)
Ancestries Reported - Swiss (%)
Ancestries Reported - Ukrainian (%)
Ancestries Reported - United States (%)
Ancestries Reported - Welsh (%)
Ancestries Reported - West Indian (%)
Ancestries Reported - Other (%)
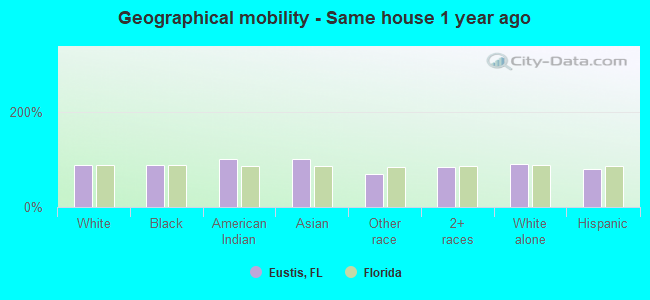
Geographical mobility - Same house 1 year ago (%)
Geographical mobility - Same house 1 year ago (%) - White
Geographical mobility - Same house 1 year ago (%) - Black or African American
Geographical mobility - Same house 1 year ago (%) - Asian
Geographical mobility - Same house 1 year ago (%) - Hispanic or Latino
Geographical mobility - Same house 1 year ago (%) - American Indian and Alaska Native
Geographical mobility - Same house 1 year ago (%) - Multirace
Geographical mobility - Same house 1 year ago (%) - Other Race
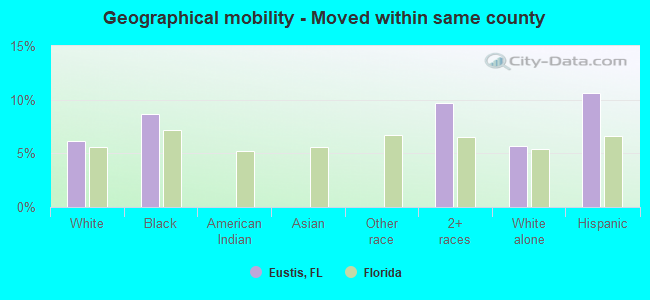
Geographical mobility - Moved within same county (%)
Geographical mobility - Moved within same county (%) - White
Geographical mobility - Moved within same county (%) - Black or African American
Geographical mobility - Moved within same county (%) - Asian
Geographical mobility - Moved within same county (%) - Hispanic or Latino
Geographical mobility - Moved within same county (%) - American Indian and Alaska Native
Geographical mobility - Moved within same county (%) - Multirace
Geographical mobility - Moved within same county (%) - Other Race
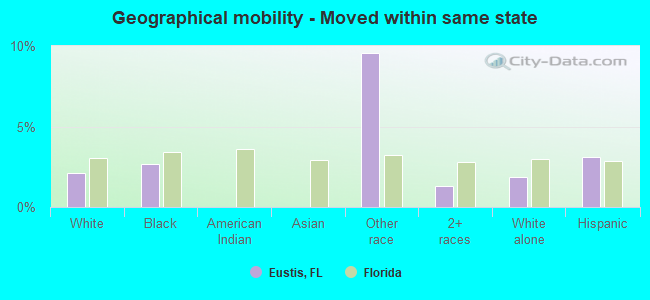
Geographical mobility - Moved from different county within same state (%)
Geographical mobility - Moved from different county within same state (%) - White
Geographical mobility - Moved from different county within same state (%) - Black or African American
Geographical mobility - Moved from different county within same state (%) - Asian
Geographical mobility - Moved from different county within same state (%) - Hispanic or Latino
Geographical mobility - Moved from different county within same state (%) - American Indian and Alaska Native
Geographical mobility - Moved from different county within same state (%) - Multirace
Geographical mobility - Moved from different county within same state (%) - Other Race
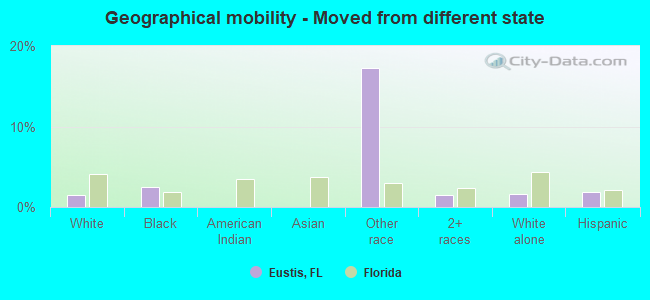
Geographical mobility - Moved from different state (%)
Geographical mobility - Moved from different state (%) - White
Geographical mobility - Moved from different state (%) - Black or African American
Geographical mobility - Moved from different state (%) - Asian
Geographical mobility - Moved from different state (%) - Hispanic or Latino
Geographical mobility - Moved from different state (%) - American Indian and Alaska Native
Geographical mobility - Moved from different state (%) - Multirace
Geographical mobility - Moved from different state (%) - Other Race
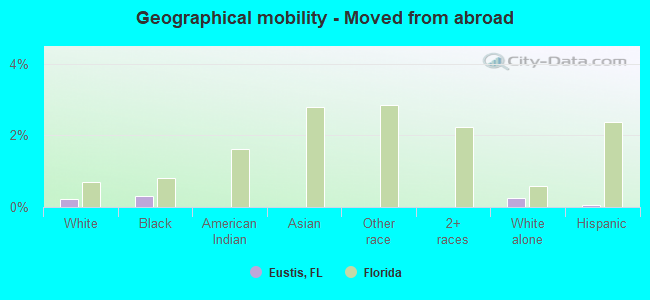
Geographical mobility - Moved from abroad (%)
Geographical mobility - Moved from abroad (%) - White
Geographical mobility - Moved from abroad (%) - Black or African American
Geographical mobility - Moved from abroad (%) - Asian
Geographical mobility - Moved from abroad (%) - Hispanic or Latino
Geographical mobility - Moved from abroad (%) - American Indian and Alaska Native
Geographical mobility - Moved from abroad (%) - Multirace
Geographical mobility - Moved from abroad (%) - Other Race
Place of birth for the foreign-born population - Ireland (%)
Place of birth for the foreign-born population - Denmark (%)
Place of birth for the foreign-born population - Norway (%)
Place of birth for the foreign-born population - Sweden (%)
Place of birth for the foreign-born population - United Kingdom (%)
Place of birth for the foreign-born population - England (%)
Place of birth for the foreign-born population - Scotland (%)
Place of birth for the foreign-born population - Other Northern Europe (%)
Place of birth for the foreign-born population - Austria (%)
Place of birth for the foreign-born population - Belgium (%)
Place of birth for the foreign-born population - France (%)
Place of birth for the foreign-born population - Germany (%)
Place of birth for the foreign-born population - Netherlands (%)
Place of birth for the foreign-born population - Switzerland (%)
Place of birth for the foreign-born population - Other Western Europe (%)
Place of birth for the foreign-born population - Greece (%)
Place of birth for the foreign-born population - Italy (%)
Place of birth for the foreign-born population - Portugal (%)
Place of birth for the foreign-born population - Spain (%)
Place of birth for the foreign-born population - Other Southern Europe (%)
Place of birth for the foreign-born population - Albania (%)
Place of birth for the foreign-born population - Belarus (%)
Place of birth for the foreign-born population - Bosnia and Herzegovina (%)
Place of birth for the foreign-born population - Bulgaria (%)
Place of birth for the foreign-born population - Croatia (%)
Place of birth for the foreign-born population - Czechoslovakia (%)
Place of birth for the foreign-born population - Hungary (%)
Place of birth for the foreign-born population - Latvia (%)
Place of birth for the foreign-born population - Lithuania (%)
Place of birth for the foreign-born population - North Macedonia (Macedonia) (%)
Place of birth for the foreign-born population - Moldova (%)
Place of birth for the foreign-born population - Poland (%)
Place of birth for the foreign-born population - Romania (%)
Place of birth for the foreign-born population - Russia (%)
Place of birth for the foreign-born population - Serbia (%)
Place of birth for the foreign-born population - Ukraine (%)
Place of birth for the foreign-born population - Other Eastern Europe (%)
Place of birth for the foreign-born population - China (%)
Place of birth for the foreign-born population - Hong Kong (%)
Place of birth for the foreign-born population - Taiwan (%)
Place of birth for the foreign-born population - Japan (%)
Place of birth for the foreign-born population - Korea (%)
Place of birth for the foreign-born population - Other Eastern Asia (%)
Place of birth for the foreign-born population - Afghanistan (%)
Place of birth for the foreign-born population - Bangladesh (%)
Place of birth for the foreign-born population - India (%)
Place of birth for the foreign-born population - Iran (%)
Place of birth for the foreign-born population - Kazakhstan (%)
Place of birth for the foreign-born population - Nepal (%)
Place of birth for the foreign-born population - Pakistan (%)
Place of birth for the foreign-born population - Sri Lanka (%)
Place of birth for the foreign-born population - Uzbekistan (%)
Place of birth for the foreign-born population - Other South Central Asia (%)
Place of birth for the foreign-born population - Burma (%)
Place of birth for the foreign-born population - Cambodia (%)
Place of birth for the foreign-born population - Indonesia (%)
Place of birth for the foreign-born population - Laos (%)
Place of birth for the foreign-born population - Malaysia (%)
Place of birth for the foreign-born population - Philippines (%)
Place of birth for the foreign-born population - Singapore (%)
Place of birth for the foreign-born population - Thailand (%)
Place of birth for the foreign-born population - Vietnam (%)
Place of birth for the foreign-born population - Other South Eastern Asia (%)
Place of birth for the foreign-born population - Armenia (%)
Place of birth for the foreign-born population - Iraq (%)
Place of birth for the foreign-born population - Israel (%)
Place of birth for the foreign-born population - Jordan (%)
Place of birth for the foreign-born population - Kuwait (%)
Place of birth for the foreign-born population - Lebanon (%)
Place of birth for the foreign-born population - Saudi Arabia (%)
Place of birth for the foreign-born population - Syria (%)
Place of birth for the foreign-born population - Turkey (%)
Place of birth for the foreign-born population - Yemen (%)
Place of birth for the foreign-born population - Other Western Asia (%)
Place of birth for the foreign-born population - Eritrea (%)
Place of birth for the foreign-born population - Ethiopia (%)
Place of birth for the foreign-born population - Kenya (%)
Place of birth for the foreign-born population - Somalia (%)
Place of birth for the foreign-born population - Uganda (%)
Place of birth for the foreign-born population - Zimbabwe (%)
Place of birth for the foreign-born population - Other Eastern Africa (%)
Place of birth for the foreign-born population - Cameroon (%)
Place of birth for the foreign-born population - Congo (%)
Place of birth for the foreign-born population - Democratic Republic of Congo (Zaire) (%)
Place of birth for the foreign-born population - Other Middle Africa (%)
Place of birth for the foreign-born population - Egypt (%)
Place of birth for the foreign-born population - Morocco (%)
Place of birth for the foreign-born population - Sudan (%)
Place of birth for the foreign-born population - Other Northern Africa (%)
Place of birth for the foreign-born population - South Africa (%)
Place of birth for the foreign-born population - Other Southern Africa (%)
Place of birth for the foreign-born population - Cabo Verde (%)
Place of birth for the foreign-born population - Ghana (%)
Place of birth for the foreign-born population - Liberia (%)
Place of birth for the foreign-born population - Nigeria (%)
Place of birth for the foreign-born population - Senegal (%)
Place of birth for the foreign-born population - Sierra Leone (%)
Place of birth for the foreign-born population - Other Western Africa (%)
Place of birth for the foreign-born population - Australia (%)
Place of birth for the foreign-born population - New Zealand (%)
Place of birth for the foreign-born population - Fiji (%)
Place of birth for the foreign-born population - Micronesia (%)
Place of birth for the foreign-born population - Bahamas (%)
Place of birth for the foreign-born population - Barbados (%)
Place of birth for the foreign-born population - Cuba (%)
Place of birth for the foreign-born population - Dominica (%)
Place of birth for the foreign-born population - Dominican Republic (%)
Place of birth for the foreign-born population - Grenada (%)
Place of birth for the foreign-born population - Haiti (%)
Place of birth for the foreign-born population - Jamaica (%)
Place of birth for the foreign-born population - St. Vincent and the Grenadines (%)
Place of birth for the foreign-born population - Trinidad and Tobago (%)
Place of birth for the foreign-born population - West Indies (%)
Place of birth for the foreign-born population - Other Caribbean (%)
Place of birth for the foreign-born population - Belize (%)
Place of birth for the foreign-born population - Costa Rica (%)
Place of birth for the foreign-born population - El Salvador (%)
Place of birth for the foreign-born population - Guatemala (%)
Place of birth for the foreign-born population - Honduras (%)
Place of birth for the foreign-born population - Mexico (%)
Place of birth for the foreign-born population - Nicaragua (%)
Place of birth for the foreign-born population - Panama (%)
Place of birth for the foreign-born population - Other Central America (%)
Place of birth for the foreign-born population - Argentina (%)
Place of birth for the foreign-born population - Bolivia (%)
Place of birth for the foreign-born population - Brazil (%)
Place of birth for the foreign-born population - Chile (%)
Place of birth for the foreign-born population - Colombia (%)
Place of birth for the foreign-born population - Ecuador (%)
Place of birth for the foreign-born population - Guyana (%)
Place of birth for the foreign-born population - Peru (%)
Place of birth for the foreign-born population - Uruguay (%)
Place of birth for the foreign-born population - Venezuela (%)
Place of birth for the foreign-born population - Other South America (%)
Place of birth for the foreign-born population - Canada (%)
Place of birth for the foreign-born population - Other Northern America (%)
Place of birth for the foreign-born population - Other (%)
Latest news about races in Eustis, FL collected exclusively by city-data.com from local newspapers, TV, and radio stations
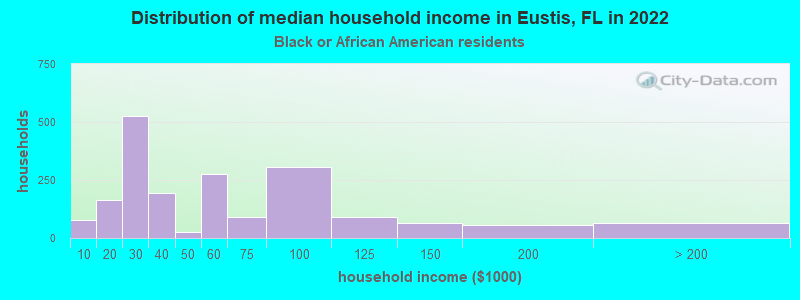
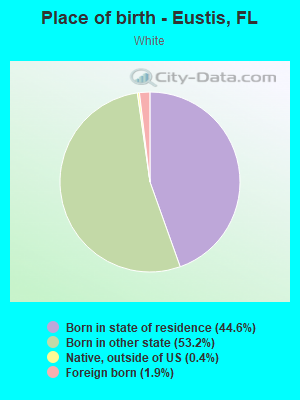
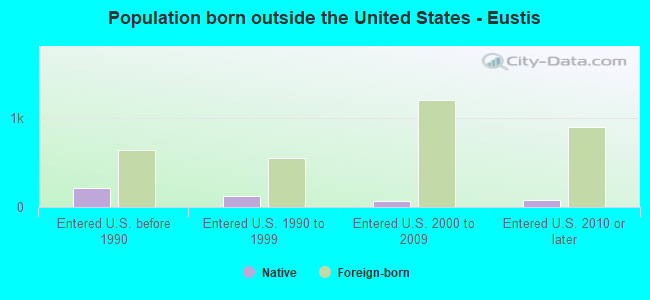
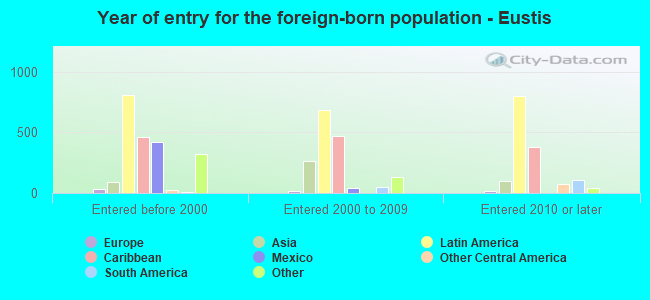
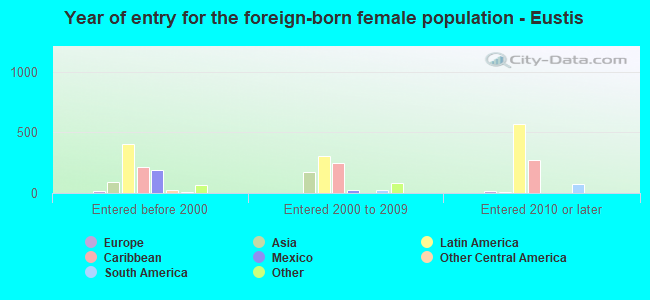
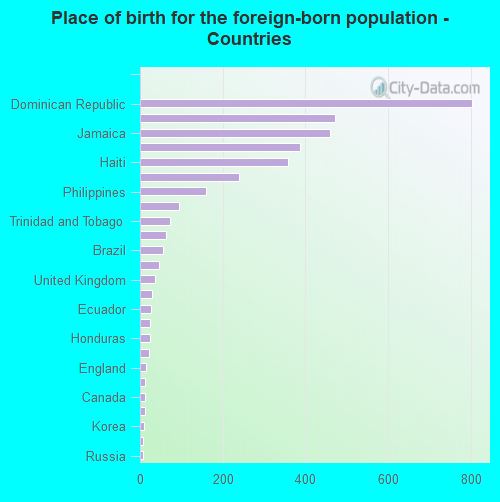
According to 2022 data, the most numerous races in Eustis, FL are White alone (12,721 residents), Hispanic (4,567 residents), and Black alone (5,440 residents). 82.6% of Eustis residents speak English at home. 14.2% of Eustis, FL residents are foreign-born (9.8% born in Latin America, 2.0% born in Asia, 1.9% born in Africa), which is 48.3% less than the foreign-born rate of 21.0% across the entire state of Florida.
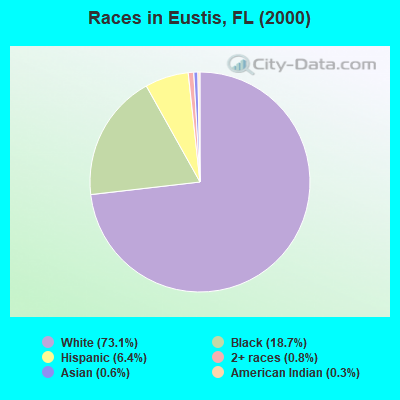
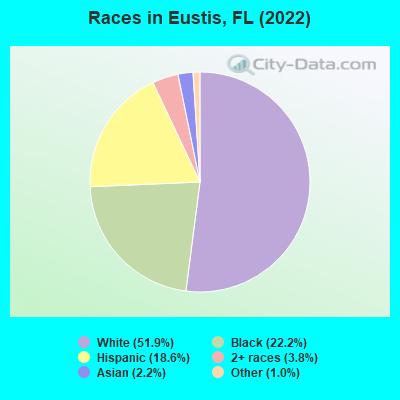
Race distribution in Eustis
2000 2022
10,458,509 65.4% White alone 2,682,715 16.8% Hispanic 2,264,268 14.2% Black alone 261,693 1.6% Asian alone 236,954 1.5% Two or more races 42,358 0.3% American Indian alone 28,994 0.2% Other race alone 6,887 0.04% Native Hawaiian and Other
11,309,403 50.8% White alone 6,025,039 27.1% Hispanic 3,241,015 14.6% Black alone 861,630 3.9% Two or more races 623,692 2.8% Asian alone 152,054 0.7% Other race alone 22,504 0.1% American Indian alone 9,486 0.04% Native Hawaiian and Other
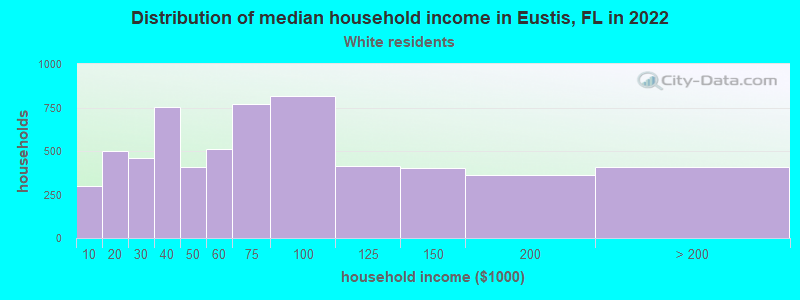
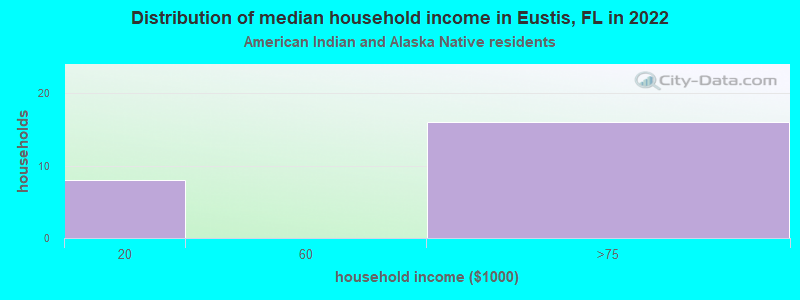
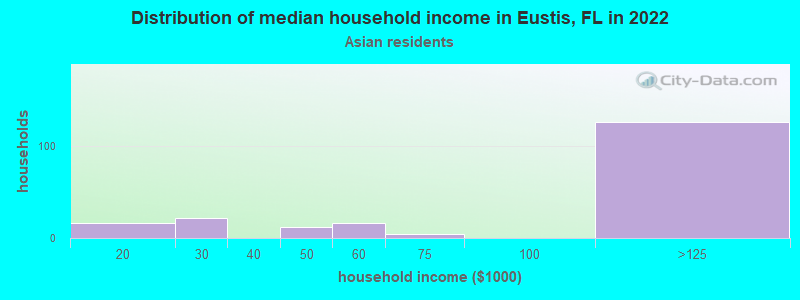
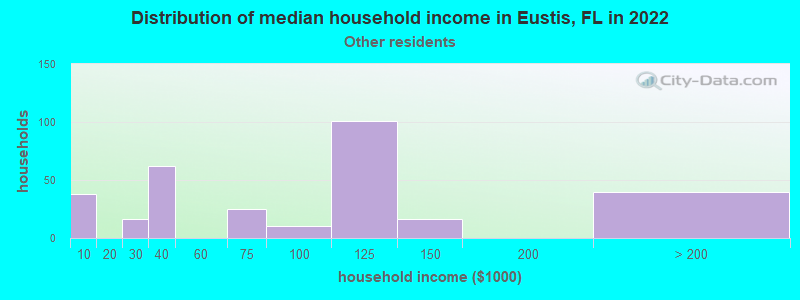
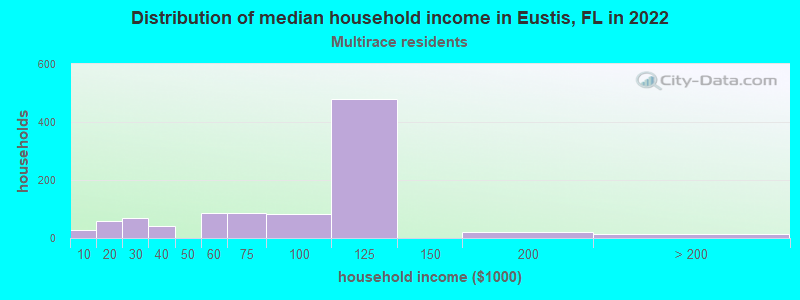
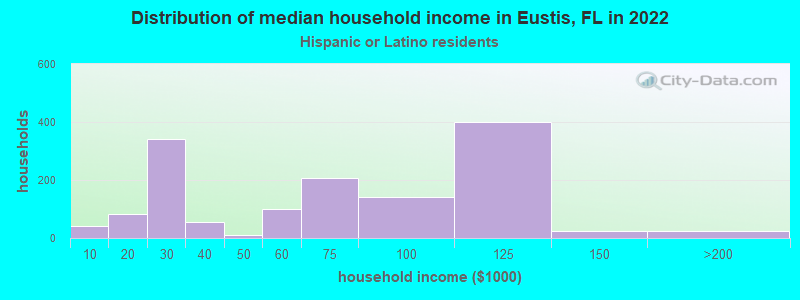
Income and house value in Eustis Median household income in 2022 $61,786 White non-Hispanic householders$38,872 Black householders$89,555 Asian householders$100,026 Some other race householders$110,740 Two or more races householders$86,920 Hispanic or Latino race householdersMedian 2022 house value $298,076 White Non-Hispanic householders$203,983 Black or African American householders$326,236 American Indian or Alaska Native householders $944,368 Asian householders$386,332 Some other race householders$304,258 Two or more races householders$313,530 Hispanic or Latino householders
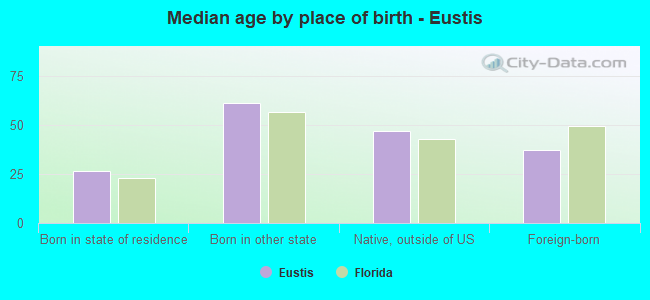
Median age by race in Eustis
52.3 Median age for White residents43.9 54.9 31.6 Median age for Black or African American residents29.9 31.3 -654,353,561.4 Median age for American Indian / Alaska Native residents-665,012,406.3 -591,194,968.0 61.5 Median age for Asian residents73.2 61.3 -679,849,340.2 Median age for Native Hawaiian / Pacific Islander residents-858,307,848.3 -443,298,968.6 46.9 Median age for Other race residents50.1 42.3 32.4 Median age for Two or more races residents36.5 31.3 53.6 Median age for White alone residents45.8 56.1 34.7 Median age for Hispanic or Latino residents34.1 34.3
Owner/renter occupied households by race in Eustis
House owners and renters - White residents 4,631 75.4% Owner occupied1,515 24.6% Renter occupiedHouse owners and renters - Black or African American residents 844 39.6% Owner occupied1,289 60.4% Renter occupiedHouse owners and renters - American Indian / Alaska Native residents 13 51.1% Owner occupied13 48.9% Renter occupiedHouse owners and renters - Asian residents 182 85.1% Owner occupied32 14.9% Renter occupiedHouse owners and renters - Other race residents 158 42.6% Owner occupied213 57.4% Renter occupiedHouse owners and renters - Two or more races residents 1,135 88.9% Owner occupied142 11.1% Renter occupiedHouse owners and renters - White alone residents 4,406 75.1% Owner occupied1,462 24.9% Renter occupiedHouse owners and renters - Hispanic or Latino residents 1,183 73.9% Owner occupied418 26.1% Renter occupied
Language usage in Eustis
English speakers - Total 82.6% of residents of Eustis speak English at home.
11.3% of residents speak Spanish at home 1,433 55.2% Speak English very well1,161 44.8% Speak English less than very well6.1% of residents speak other language at home 690 49.4% Speak English very well706 50.6% Speak English less than very well
English speakers - Born in the United States 94.9% of residents of Eustis speak English at home.
4.6% of residents speak Spanish at home 427 98.4% Speak English very well7 1.6% Speak English less than very well0.4% of residents speak other language at home 26 72.2% Speak English very well10 27.8% Speak English less than very well
English speakers - Native, born elsewhere 50.1% of residents of Eustis speak English at home.
51.3% of residents speak Spanish at home 203 80.9% Speak English very well48 19.1% Speak English less than very well1.2% of residents speak other language at home 6 100.0% Speak English very well
English speakers - Foreign-born 27.1% of residents of Eustis speak English at home.
41.8% of residents speak Spanish at home 330 24.3% Speak English very well1,029 75.7% Speak English less than very well34.1% of residents speak other language at home 420 37.9% Speak English very well688 62.1% Speak English less than very well
White (Caucasian) - Speak only English Native:
97.0% (12,486)Foreign-born:
68.7% (178)
White (Caucasian) - Speak another language Native:
3.1% (403)Foreign-born:
65.8% (171)
Black or African American - Speak only English Native:
93.2% (3,693)Foreign-born:
57.5% (568)
Black or African American - Speak another language Native:
5.6% (221)Foreign-born:
48.4% (478)
Asian - Speak only English Native:
50.2% (16)Foreign-born:
8.4% (49)
Asian - Speak another language Native:
48.5% (15)Foreign-born:
100.0% (589)
Other race - Speak another language Native:
50.3% (372)Foreign-born:
100.0% (334)
Two or more races - Speak only English Native:
84.6% (1,658)Foreign-born:
2.6% (36)
Two or more races - Speak another language Native:
17.7% (346)Foreign-born:
100.0% (1,361)
White alone - Speak only English Native:
98.8% (11,818)Foreign-born:
94.8% (156)
White alone - Speak another language Native:
1.2% (140)Foreign-born:
14.2% (23)
Hispanic or Latino - Speak only English Native:
57.5% (1,585)Foreign-born:
3.4% (49)
Hispanic or Latino - Speak another language Native:
39.6% (1,092)Foreign-born:
98.6% (1,417)
Foreign-born residents in Eustis 3,469 residents are foreign born (9.8% Latin America , 2.0% Asia , 1.9% Africa ).
This city:
14.2%Florida:
21.1%
Marital status for residents in Eustis Marital status - White (Caucasian) population 15 years and over
Males 30.9% Never married57.1% Now married0.9% Separated3.7% Widowed7.5% DivorcedFemales 16.9% Never married51.3% Now married1.1% Separated14.0% Widowed16.7% DivorcedWomen who gave birth in the past 12 months Now married:
94.7% (188)Unmarried:
5.3% (10)
Women who did not give birth in the past 12 months Now married:
45.6% (938)Unmarried:
54.4% (1,118)
Marital status - Black or African American population 15 years and over
Males 38.3% Never married46.3% Now married1.9% Separated7.3% Widowed6.3% DivorcedFemales 36.0% Never married43.9% Now married6.4% Separated4.7% Widowed9.0% DivorcedWomen who did not give birth in the past 12 months Now married:
43.5% (576)Unmarried:
56.5% (747)
Marital status - Asian population 15 years and over
Males 33.7% Never married66.3% Now married0.0% Separated0.0% Widowed0.0% DivorcedFemales 26.5% Never married54.2% Now married0.0% Separated6.2% Widowed13.1% DivorcedWomen who did not give birth in the past 12 months Now married:
25.5% (28)Unmarried:
74.5% (81)
Marital status - Other race population 15 years and over
Males 48.9% Never married24.6% Now married0.0% Separated0.0% Widowed26.4% DivorcedFemales 52.2% Never married31.6% Now married1.0% Separated7.2% Widowed7.9% DivorcedWomen who did not give birth in the past 12 months Now married:
3.7% (14)Unmarried:
96.3% (360)
Marital status - Two or more races population 15 years and over
Males 44.1% Never married53.7% Now married1.2% Separated1.1% Widowed0.0% DivorcedFemales 18.8% Never married59.0% Now married0.0% Separated2.7% Widowed19.5% DivorcedWomen who did not give birth in the past 12 months Now married:
73.0% (457)Unmarried:
27.0% (169)
Marital status - White alone, not Hispanic / Latino population 15 years and over
Males 29.9% Never married58.2% Now married0.1% Separated4.1% Widowed7.7% DivorcedFemales 15.2% Never married51.6% Now married1.2% Separated15.0% Widowed17.0% DivorcedWomen who gave birth in the past 12 months Now married:
94.1% (163)Unmarried:
5.9% (10)
Women who did not give birth in the past 12 months Now married:
46.6% (811)Unmarried:
53.4% (930)
Marital status - Hispanic or Latino population 15 years and over
Males 43.8% Never married47.1% Now married2.3% Separated0.6% Widowed6.2% DivorcedFemales 28.6% Never married51.7% Now married0.2% Separated5.1% Widowed14.3% DivorcedWomen who gave birth in the past 12 months Now married:
97.5% (44)Unmarried:
2.5% (1)
Women who did not give birth in the past 12 months Now married:
52.4% (604)Unmarried:
47.6% (549)
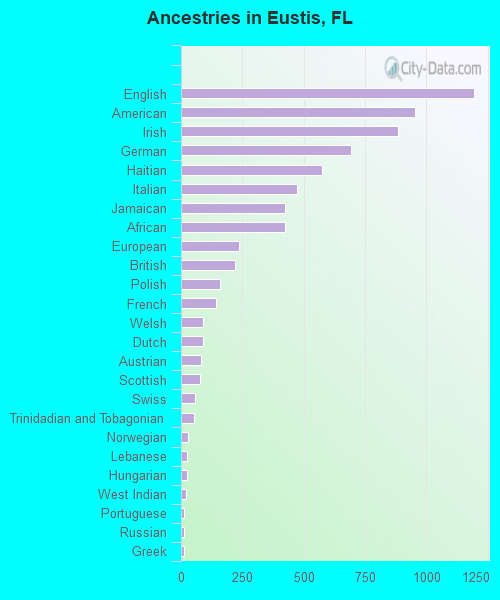
Ancestries in Eustis
1,195 10.3% English955 8.2% American885 7.6% Irish694 6.0% German575 4.9% Haitian471 4.0% Italian425 3.7% Jamaican424 3.6% African235 2.0% European218 1.9% British160 1.4% Polish141 1.2% French90 0.8% Welsh89 0.8% Dutch80 0.7% Austrian76 0.7% Scottish57 0.5% Swiss52 0.4% Trinidadian and Tobagonian30 0.3% Norwegian26 0.2% Lebanese23 0.2% Hungarian21 0.2% West Indian14 0.1% Portuguese14 0.1% Russian13 0.1% Greek12 0.1% Canadian12 0.1% Czech12 0.1% French Canadian9 0.08% Ukrainian3 0.03% Scotch-Irish
Geographical mobility in Eustis Same house 1 year ago 11,974 89.0% White (Caucasian)4,895 87.8% Black or African American27 100.0% American Indian / Alaska Native514 100.0% Asian760 68.8% Other race2,955 82.6% Two or more races11,301 90.0% White alone, not Hispanic / Latino3,596 80.0% Hispanic or LatinoMoved within same county 832 6.2% White / Caucasian484 8.7% Black or African American346 9.7% Two or more races709 5.6% White alone, not Hispanic / Latino479 10.7% Hispanic or LatinoMoved within same state 288 2.1% White / Caucasian150 2.7% Black or African American106 9.6% Other race46 1.3% Two or more races234 1.9% White alone, not Hispanic / Latino139 3.1% Hispanic or LatinoMoved from different state 199 1.5% White / Caucasian140 2.5% Black or African American191 17.3% Other race55 1.5% Two or more races196 1.6% White alone, not Hispanic / Latino82 1.8% Hispanic or LatinoMoved from abroad 29 0.2% White17 0.3% Black or African American33 0.3% White alone, not Hispanic / Latino2 0.0% Hispanic or Latino
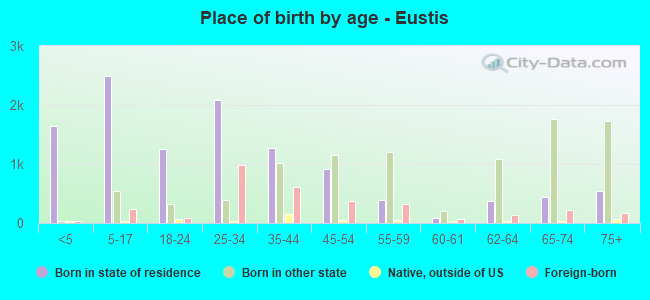
Children Nativity (place of birth) in Eustis
Children under 6 years - Living with two parents Both parents native 876 100.0% NativeBoth parents foreign-born 169 100.0% NativeOne native, one foreign-born parent 66 100.0% NativeChildren under 6 years - Living with one parent Native parent 666 100.0% NativeForeign-born parent 71 100.0% NativeChildren 6 to 17 years - Living with two parents Both parents native 1,088 100.0% NativeBoth parents foreign-born 259 100.0% Foreign-bornOne native, one foreign-born parent 92 70.9% Native38 29.1% Foreign-bornChildren 6 to 17 years - Living with one parent Native parent 1,046 100.0% NativeForeign-born parent 255 51.4% Native241 48.6% Foreign-born
Grandparents responsible for own grandchildren in Eustis
Grandparents (30 to 59 years) White / Caucasian 103 75.9% Responsible for grandchildren33 24.1% Not responsible for grandchildrenBlack or African American 41 100.0% Not responsible for grandchildrenTwo or more races 165 100.0% Not responsible for grandchildrenWhite alone, not Hispanic / Latino 111 74.8% Responsible for grandchildren37 25.2% Not responsible for grandchildrenHispanic or Latino 106 100.0% Not responsible for grandchildrenGrandparents (60 years and over) White / Caucasian 19 65.4% Responsible for grandchildren10 34.6% Not responsible for grandchildrenBlack or African American 98 40.9% Responsible for grandchildren142 59.1% Not responsible for grandchildrenWhite alone, not Hispanic / Latino 21 66.8% Responsible for grandchildren11 33.2% Not responsible for grandchildren