Races in Floral Park, New York (NY) Detailed Stats
Data:
Races - White alone (%)
Races - White alone (% change since 2000)
Races - Black alone (%)
Races - Black alone (% change since 2000)
Races - American Indian alone (%)
Races - American Indian alone (% change since 2000)
Races - Asian alone (%)
Races - Asian alone (% change since 2000)
Races - Hispanic (%)
Races - Hispanic (% change since 2000)
Races - Native Hawaiian and Other Pacific Islander alone (%)
Races - Native Hawaiian and Other Pacific Islander alone (% change since 2000)
Races - Two or more races(%)
Races - Two or more races(% change since 2000)
Races - Other race alone (%)
Races - Other race alone (% change since 2000)
Racial diversity
Place of birth - Born in state of residence (%)
Place of birth - Born in state of residence (%) - White
Place of birth - Born in state of residence (%) - Black or African American
Place of birth - Born in state of residence (%) - Asian
Place of birth - Born in state of residence (%) - Hispanic or Latino
Place of birth - Born in state of residence (%) - American Indian and Alaska Native
Place of birth - Born in state of residence (%) - Multirace
Place of birth - Born in state of residence (%) - Other Race
Place of birth - Born in other state (%)
Place of birth - Born in other state (%) - White
Place of birth - Born in other state (%) - Black or African American
Place of birth - Born in other state (%) - Asian
Place of birth - Born in other state (%) - Hispanic or Latino
Place of birth - Born in other state (%) - American Indian and Alaska Native
Place of birth - Born in other state (%) - Multirace
Place of birth - Born in other state (%) - Other Race
Place of birth - Native, outside of US (%)
Place of birth - Native, outside of US (%) - White
Place of birth - Native, outside of US (%) - Black or African American
Place of birth - Native, outside of US (%) - Asian
Place of birth - Native, outside of US (%) - Hispanic or Latino
Place of birth - Native, outside of US (%) - American Indian and Alaska Native
Place of birth - Native, outside of US (%) - Multirace
Place of birth - Native, outside of US (%) - Other Race
Place of birth - Foreign born (%)
Place of birth - Foreign born (%) - White
Place of birth - Foreign born (%) - Black or African American
Place of birth - Foreign born (%) - Asian
Place of birth - Foreign born (%) - Hispanic or Latino
Place of birth - Foreign born (%) - American Indian and Alaska Native
Place of birth - Foreign born (%) - Multirace
Place of birth - Foreign born (%) - Other Race
Residents speaking English at home (%)
Residents speaking English at home - Born in the United States (%)
Residents speaking English at home - Native, born elsewhere (%)
Residents speaking English at home - Foreign born (%)
Residents speaking Spanish at home (%)
Residents speaking Spanish at home - Born in the United States (%)
Residents speaking Spanish at home - Native, born elsewhere (%)
Residents speaking Spanish at home - Foreign born (%)
Residents speaking other language at home (%)
Residents speaking other language at home - Born in the United States (%)
Residents speaking other language at home - Native, born elsewhere (%)
Residents speaking other language at home - Foreign born (%)
Marital status - Never married (%)
Marital status - Now married (%)
Marital status - Separated (%)
Marital status - Widowed (%)
Marital status - Divorced (%)
Ancestries Reported - Arab (%)
Ancestries Reported - Czech (%)
Ancestries Reported - Danish (%)
Ancestries Reported - Dutch (%)
Ancestries Reported - English (%)
Ancestries Reported - French (%)
Ancestries Reported - French Canadian (%)
Ancestries Reported - German (%)
Ancestries Reported - Greek (%)
Ancestries Reported - Hungarian (%)
Ancestries Reported - Irish (%)
Ancestries Reported - Italian (%)
Ancestries Reported - Lithuanian (%)
Ancestries Reported - Norwegian (%)
Ancestries Reported - Polish (%)
Ancestries Reported - Portuguese (%)
Ancestries Reported - Russian (%)
Ancestries Reported - Scotch-Irish (%)
Ancestries Reported - Scottish (%)
Ancestries Reported - Slovak (%)
Ancestries Reported - Subsaharan African (%)
Ancestries Reported - Swedish (%)
Ancestries Reported - Swiss (%)
Ancestries Reported - Ukrainian (%)
Ancestries Reported - United States (%)
Ancestries Reported - Welsh (%)
Ancestries Reported - West Indian (%)
Ancestries Reported - Other (%)
Geographical mobility - Same house 1 year ago (%)
Geographical mobility - Same house 1 year ago (%) - White
Geographical mobility - Same house 1 year ago (%) - Black or African American
Geographical mobility - Same house 1 year ago (%) - Asian
Geographical mobility - Same house 1 year ago (%) - Hispanic or Latino
Geographical mobility - Same house 1 year ago (%) - American Indian and Alaska Native
Geographical mobility - Same house 1 year ago (%) - Multirace
Geographical mobility - Same house 1 year ago (%) - Other Race
Geographical mobility - Moved within same county (%)
Geographical mobility - Moved within same county (%) - White
Geographical mobility - Moved within same county (%) - Black or African American
Geographical mobility - Moved within same county (%) - Asian
Geographical mobility - Moved within same county (%) - Hispanic or Latino
Geographical mobility - Moved within same county (%) - American Indian and Alaska Native
Geographical mobility - Moved within same county (%) - Multirace
Geographical mobility - Moved within same county (%) - Other Race
Geographical mobility - Moved from different county within same state (%)
Geographical mobility - Moved from different county within same state (%) - White
Geographical mobility - Moved from different county within same state (%) - Black or African American
Geographical mobility - Moved from different county within same state (%) - Asian
Geographical mobility - Moved from different county within same state (%) - Hispanic or Latino
Geographical mobility - Moved from different county within same state (%) - American Indian and Alaska Native
Geographical mobility - Moved from different county within same state (%) - Multirace
Geographical mobility - Moved from different county within same state (%) - Other Race
Geographical mobility - Moved from different state (%)
Geographical mobility - Moved from different state (%) - White
Geographical mobility - Moved from different state (%) - Black or African American
Geographical mobility - Moved from different state (%) - Asian
Geographical mobility - Moved from different state (%) - Hispanic or Latino
Geographical mobility - Moved from different state (%) - American Indian and Alaska Native
Geographical mobility - Moved from different state (%) - Multirace
Geographical mobility - Moved from different state (%) - Other Race
Geographical mobility - Moved from abroad (%)
Geographical mobility - Moved from abroad (%) - White
Geographical mobility - Moved from abroad (%) - Black or African American
Geographical mobility - Moved from abroad (%) - Asian
Geographical mobility - Moved from abroad (%) - Hispanic or Latino
Geographical mobility - Moved from abroad (%) - American Indian and Alaska Native
Geographical mobility - Moved from abroad (%) - Multirace
Geographical mobility - Moved from abroad (%) - Other Race
Place of birth for the foreign-born population - Ireland (%)
Place of birth for the foreign-born population - Denmark (%)
Place of birth for the foreign-born population - Norway (%)
Place of birth for the foreign-born population - Sweden (%)
Place of birth for the foreign-born population - United Kingdom (%)
Place of birth for the foreign-born population - England (%)
Place of birth for the foreign-born population - Scotland (%)
Place of birth for the foreign-born population - Other Northern Europe (%)
Place of birth for the foreign-born population - Austria (%)
Place of birth for the foreign-born population - Belgium (%)
Place of birth for the foreign-born population - France (%)
Place of birth for the foreign-born population - Germany (%)
Place of birth for the foreign-born population - Netherlands (%)
Place of birth for the foreign-born population - Switzerland (%)
Place of birth for the foreign-born population - Other Western Europe (%)
Place of birth for the foreign-born population - Greece (%)
Place of birth for the foreign-born population - Italy (%)
Place of birth for the foreign-born population - Portugal (%)
Place of birth for the foreign-born population - Spain (%)
Place of birth for the foreign-born population - Other Southern Europe (%)
Place of birth for the foreign-born population - Albania (%)
Place of birth for the foreign-born population - Belarus (%)
Place of birth for the foreign-born population - Bosnia and Herzegovina (%)
Place of birth for the foreign-born population - Bulgaria (%)
Place of birth for the foreign-born population - Croatia (%)
Place of birth for the foreign-born population - Czechoslovakia (%)
Place of birth for the foreign-born population - Hungary (%)
Place of birth for the foreign-born population - Latvia (%)
Place of birth for the foreign-born population - Lithuania (%)
Place of birth for the foreign-born population - North Macedonia (Macedonia) (%)
Place of birth for the foreign-born population - Moldova (%)
Place of birth for the foreign-born population - Poland (%)
Place of birth for the foreign-born population - Romania (%)
Place of birth for the foreign-born population - Russia (%)
Place of birth for the foreign-born population - Serbia (%)
Place of birth for the foreign-born population - Ukraine (%)
Place of birth for the foreign-born population - Other Eastern Europe (%)
Place of birth for the foreign-born population - China (%)
Place of birth for the foreign-born population - Hong Kong (%)
Place of birth for the foreign-born population - Taiwan (%)
Place of birth for the foreign-born population - Japan (%)
Place of birth for the foreign-born population - Korea (%)
Place of birth for the foreign-born population - Other Eastern Asia (%)
Place of birth for the foreign-born population - Afghanistan (%)
Place of birth for the foreign-born population - Bangladesh (%)
Place of birth for the foreign-born population - India (%)
Place of birth for the foreign-born population - Iran (%)
Place of birth for the foreign-born population - Kazakhstan (%)
Place of birth for the foreign-born population - Nepal (%)
Place of birth for the foreign-born population - Pakistan (%)
Place of birth for the foreign-born population - Sri Lanka (%)
Place of birth for the foreign-born population - Uzbekistan (%)
Place of birth for the foreign-born population - Other South Central Asia (%)
Place of birth for the foreign-born population - Burma (%)
Place of birth for the foreign-born population - Cambodia (%)
Place of birth for the foreign-born population - Indonesia (%)
Place of birth for the foreign-born population - Laos (%)
Place of birth for the foreign-born population - Malaysia (%)
Place of birth for the foreign-born population - Philippines (%)
Place of birth for the foreign-born population - Singapore (%)
Place of birth for the foreign-born population - Thailand (%)
Place of birth for the foreign-born population - Vietnam (%)
Place of birth for the foreign-born population - Other South Eastern Asia (%)
Place of birth for the foreign-born population - Armenia (%)
Place of birth for the foreign-born population - Iraq (%)
Place of birth for the foreign-born population - Israel (%)
Place of birth for the foreign-born population - Jordan (%)
Place of birth for the foreign-born population - Kuwait (%)
Place of birth for the foreign-born population - Lebanon (%)
Place of birth for the foreign-born population - Saudi Arabia (%)
Place of birth for the foreign-born population - Syria (%)
Place of birth for the foreign-born population - Turkey (%)
Place of birth for the foreign-born population - Yemen (%)
Place of birth for the foreign-born population - Other Western Asia (%)
Place of birth for the foreign-born population - Eritrea (%)
Place of birth for the foreign-born population - Ethiopia (%)
Place of birth for the foreign-born population - Kenya (%)
Place of birth for the foreign-born population - Somalia (%)
Place of birth for the foreign-born population - Uganda (%)
Place of birth for the foreign-born population - Zimbabwe (%)
Place of birth for the foreign-born population - Other Eastern Africa (%)
Place of birth for the foreign-born population - Cameroon (%)
Place of birth for the foreign-born population - Congo (%)
Place of birth for the foreign-born population - Democratic Republic of Congo (Zaire) (%)
Place of birth for the foreign-born population - Other Middle Africa (%)
Place of birth for the foreign-born population - Egypt (%)
Place of birth for the foreign-born population - Morocco (%)
Place of birth for the foreign-born population - Sudan (%)
Place of birth for the foreign-born population - Other Northern Africa (%)
Place of birth for the foreign-born population - South Africa (%)
Place of birth for the foreign-born population - Other Southern Africa (%)
Place of birth for the foreign-born population - Cabo Verde (%)
Place of birth for the foreign-born population - Ghana (%)
Place of birth for the foreign-born population - Liberia (%)
Place of birth for the foreign-born population - Nigeria (%)
Place of birth for the foreign-born population - Senegal (%)
Place of birth for the foreign-born population - Sierra Leone (%)
Place of birth for the foreign-born population - Other Western Africa (%)
Place of birth for the foreign-born population - Australia (%)
Place of birth for the foreign-born population - New Zealand (%)
Place of birth for the foreign-born population - Fiji (%)
Place of birth for the foreign-born population - Micronesia (%)
Place of birth for the foreign-born population - Bahamas (%)
Place of birth for the foreign-born population - Barbados (%)
Place of birth for the foreign-born population - Cuba (%)
Place of birth for the foreign-born population - Dominica (%)
Place of birth for the foreign-born population - Dominican Republic (%)
Place of birth for the foreign-born population - Grenada (%)
Place of birth for the foreign-born population - Haiti (%)
Place of birth for the foreign-born population - Jamaica (%)
Place of birth for the foreign-born population - St. Vincent and the Grenadines (%)
Place of birth for the foreign-born population - Trinidad and Tobago (%)
Place of birth for the foreign-born population - West Indies (%)
Place of birth for the foreign-born population - Other Caribbean (%)
Place of birth for the foreign-born population - Belize (%)
Place of birth for the foreign-born population - Costa Rica (%)
Place of birth for the foreign-born population - El Salvador (%)
Place of birth for the foreign-born population - Guatemala (%)
Place of birth for the foreign-born population - Honduras (%)
Place of birth for the foreign-born population - Mexico (%)
Place of birth for the foreign-born population - Nicaragua (%)
Place of birth for the foreign-born population - Panama (%)
Place of birth for the foreign-born population - Other Central America (%)
Place of birth for the foreign-born population - Argentina (%)
Place of birth for the foreign-born population - Bolivia (%)
Place of birth for the foreign-born population - Brazil (%)
Place of birth for the foreign-born population - Chile (%)
Place of birth for the foreign-born population - Colombia (%)
Place of birth for the foreign-born population - Ecuador (%)
Place of birth for the foreign-born population - Guyana (%)
Place of birth for the foreign-born population - Peru (%)
Place of birth for the foreign-born population - Uruguay (%)
Place of birth for the foreign-born population - Venezuela (%)
Place of birth for the foreign-born population - Other South America (%)
Place of birth for the foreign-born population - Canada (%)
Place of birth for the foreign-born population - Other Northern America (%)
Place of birth for the foreign-born population - Other (%)
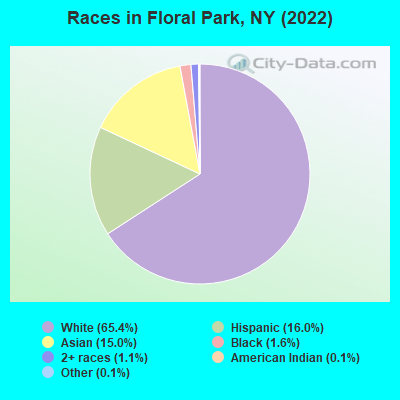
According to 2022 data, the most numerous races in Floral Park, NY are White alone (10,348 residents), Hispanic (2,533 residents), and Black alone (251 residents). 74.8% of Floral Park residents speak English at home. 20.3% of Floral Park, NY residents are foreign-born (9.4% born in Asia, 5.9% born in Latin America, 5.0% born in Europe), which is 8.5% less than the foreign-born rate of 22.0% across the entire state of New York.
Race distribution in Floral Park
2000 2022
11,760,981 62.0% White alone 2,867,583 15.1% Hispanic 2,812,623 14.8% Black alone 1,035,926 5.5% Asian alone 366,116 1.9% Two or more races 75,499 0.4% Other race alone 52,499 0.3% American Indian alone 5,230 0.03% Native Hawaiian and Other
10,408,933 52.9% White alone 3,867,299 19.7% Hispanic 2,633,840 13.4% Black alone 1,776,286 9.0% Asian alone 732,670 3.7% Two or more races 216,110 1.1% Other race alone 35,082 0.2% American Indian alone 6,931 0.04% Native Hawaiian and Other
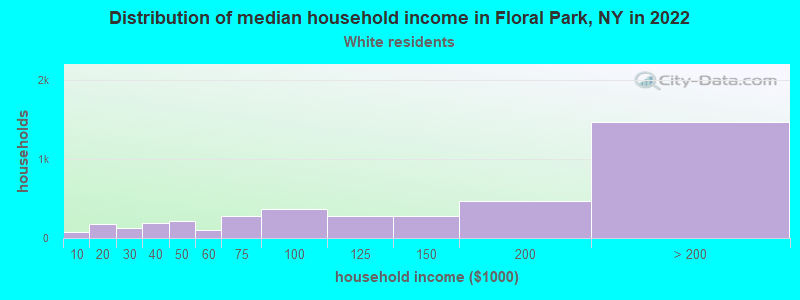
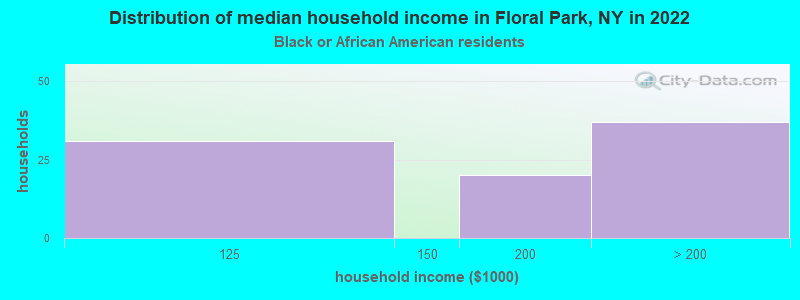
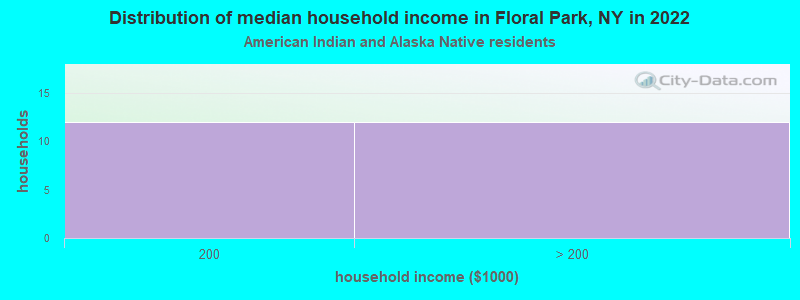
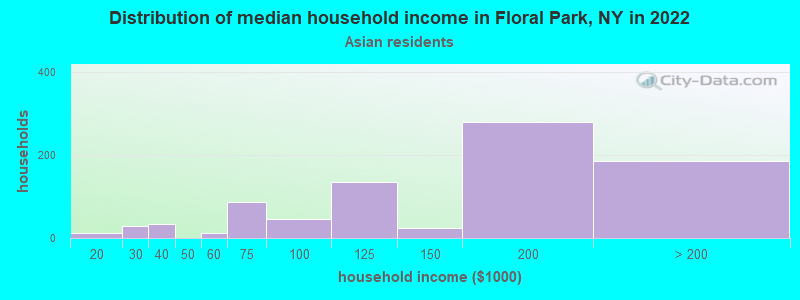
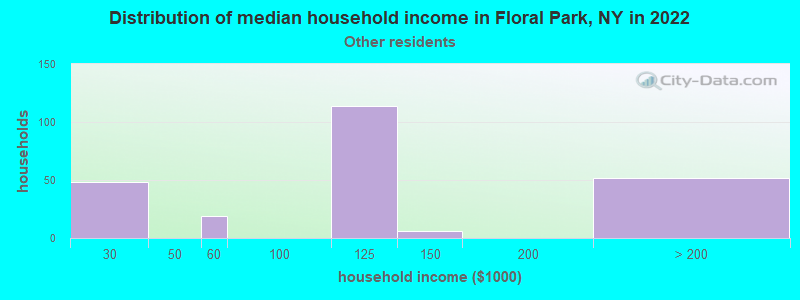
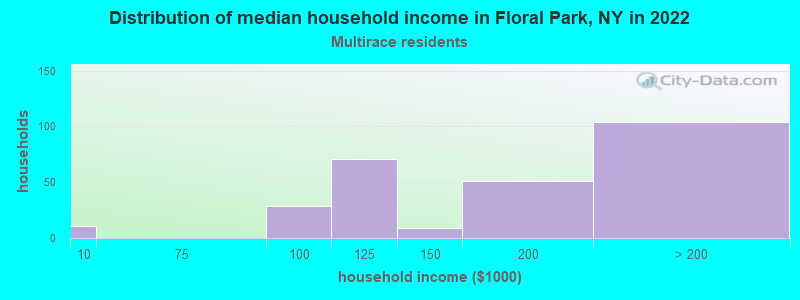
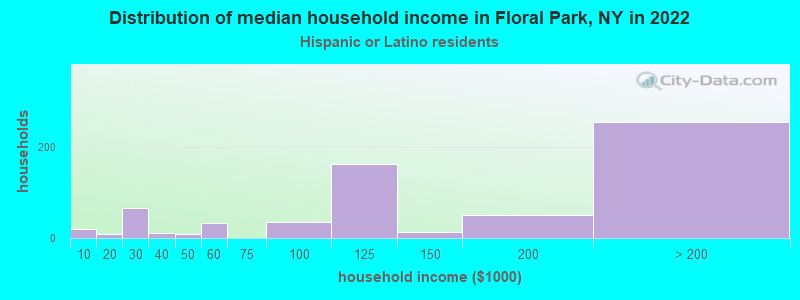
Income and house value in Floral Park Median household income in 2022 $141,775 White non-Hispanic householdersover $200,000 Black householdersover $200,000 American Indian and Alaska Native householders$178,851 Asian householders$126,657 Some other race householders$157,351 Two or more races householders$162,940 Hispanic or Latino race householdersMedian 2022 house value $734,686 White Non-Hispanic householders$512,095 Black or African American householders$512,095 American Indian or Alaska Native householders $795,592 Asian householders$586,110 Some other race householders$584,472 Two or more races householders$667,499 Hispanic or Latino householders
Median age by race in Floral Park
48.9 Median age for White residents45.7 52.9 30.2 Median age for Black or African American residents26.6 43.8 44.1 Median age for American Indian / Alaska Native residents7.6 45.7 37.6 Median age for Asian residents39.6 37.2 -487,992,314.6 Median age for Native Hawaiian / Pacific Islander residents-477,502,295.2 -497,387,669.3 41.5 Median age for Other race residents43.7 32.2 23.7 Median age for Two or more races residents28.4 21.5 49.1 Median age for White alone residents45.3 52.7 35.5 Median age for Hispanic or Latino residents36.6 31.9
Owner/renter occupied households by race in Floral Park
House owners and renters - White residents 3,458 86.4% Owner occupied545 13.6% Renter occupiedHouse owners and renters - Black or African American residents 82 91.6% Owner occupied8 8.4% Renter occupiedHouse owners and renters - American Indian / Alaska Native residents 27 100.0% Owner occupiedHouse owners and renters - Asian residents 785 89.9% Owner occupied88 10.1% Renter occupiedHouse owners and renters - Other race residents 178 78.7% Owner occupied48 21.3% Renter occupiedHouse owners and renters - Two or more races residents 202 73.2% Owner occupied74 26.8% Renter occupiedHouse owners and renters - White alone residents 3,365 86.6% Owner occupied519 13.4% Renter occupiedHouse owners and renters - Hispanic or Latino residents 517 76.0% Owner occupied164 24.0% Renter occupied
Language usage in Floral Park
English speakers - Total 74.8% of residents of Floral Park speak English at home.
10.3% of residents speak Spanish at home 1,145 73.3% Speak English very well418 26.7% Speak English less than very well14.6% of residents speak other language at home 1,594 72.0% Speak English very well619 28.0% Speak English less than very well
English speakers - Born in the United States 86.1% of residents of Floral Park speak English at home.
13.5% of residents speak Spanish at home 93 100.0% Speak English very well3.5% of residents speak other language at home 24 100.0% Speak English very well
English speakers - Native, born elsewhere 55.1% of residents of Floral Park speak English at home.
21.4% of residents speak Spanish at home 15 71.4% Speak English very well6 28.6% Speak English less than very well23.5% of residents speak other language at home 11 47.8% Speak English very well12 52.2% Speak English less than very well
English speakers - Foreign-born 29.1% of residents of Floral Park speak English at home.
20.4% of residents speak Spanish at home 317 46.9% Speak English very well359 53.1% Speak English less than very well50.2% of residents speak other language at home 1,098 65.9% Speak English very well569 34.1% Speak English less than very well
White (Caucasian) - Speak only English Native:
94.2% (9,035)Foreign-born:
56.5% (483)
White (Caucasian) - Speak another language Native:
5.9% (570)Foreign-born:
49.4% (422)
Black or African American - Speak only English Native:
62.3% (105)Foreign-born:
26.7% (45)
Black or African American - Speak another language Native:
40.1% (68)Foreign-born:
74.1% (125)
American Indian / Alaska Native - Speak only English Native:
46.7% (12)Foreign-born:
65.9% (1)
Asian - Speak only English Native:
62.4% (410)Foreign-born:
24.8% (391)
Asian - Speak another language Native:
38.4% (253)Foreign-born:
71.9% (1,134)
Other race - Speak another language Native:
76.9% (188)Foreign-born:
100.0% (329)
Two or more races - Speak only English Native:
66.5% (605)Foreign-born:
7.0% (27)
Two or more races - Speak another language Native:
33.3% (303)Foreign-born:
94.7% (368)
White alone - Speak only English Native:
96.6% (8,799)Foreign-born:
53.0% (490)
White alone - Speak another language Native:
3.6% (327)Foreign-born:
46.4% (428)
Hispanic or Latino - Speak only English Native:
47.5% (767)Foreign-born:
5.6% (44)
Hispanic or Latino - Speak another language Native:
52.5% (848)Foreign-born:
94.4% (751)
Foreign-born residents in Floral Park 3,211 residents are foreign born (9.4% Asia , 5.9% Latin America , 5.0% Europe ).
This city:
20.3%New York:
22.6%
Marital status for residents in Floral Park Marital status - White (Caucasian) population 15 years and over
Males 31.6% Never married59.9% Now married0.0% Separated2.2% Widowed6.3% DivorcedFemales 26.7% Never married55.3% Now married0.7% Separated10.5% Widowed6.8% DivorcedWomen who gave birth in the past 12 months Now married:
82.7% (60)Unmarried:
17.3% (13)
Women who did not give birth in the past 12 months Now married:
43.5% (787)Unmarried:
56.5% (1,020)
Marital status - Black or African American population 15 years and over
Males 46.4% Never married53.6% Now married0.0% Separated0.0% Widowed0.0% DivorcedFemales 29.8% Never married60.3% Now married0.0% Separated0.0% Widowed9.9% DivorcedWomen who did not give birth in the past 12 months Now married:
52.6% (48)Unmarried:
47.4% (43)
Marital status - American Indian / Alaska Native population 15 years and over
Males 0.0% Never married100.0% Now married0.0% Separated0.0% Widowed0.0% DivorcedFemales 0.0% Never married100.0% Now married0.0% Separated0.0% Widowed0.0% DivorcedWomen who did not give birth in the past 12 months Now married:
100.0% (19)Unmarried:
0.0% (0)
Marital status - Asian population 15 years and over
Males 19.1% Never married77.8% Now married0.0% Separated0.7% Widowed2.5% DivorcedFemales 26.0% Never married68.4% Now married3.3% Separated0.0% Widowed2.3% DivorcedWomen who gave birth in the past 12 months Now married:
100.0% (28)Unmarried:
0.0% (0)
Women who did not give birth in the past 12 months Now married:
63.5% (411)Unmarried:
36.5% (236)
Marital status - Other race population 15 years and over
Males 24.5% Never married56.4% Now married0.0% Separated0.0% Widowed19.1% DivorcedFemales 38.0% Never married45.9% Now married0.0% Separated0.0% Widowed16.1% DivorcedWomen who did not give birth in the past 12 months Now married:
47.7% (81)Unmarried:
52.3% (89)
Marital status - Two or more races population 15 years and over
Males 37.8% Never married54.4% Now married0.0% Separated0.0% Widowed7.7% DivorcedFemales 42.2% Never married57.5% Now married0.0% Separated0.3% Widowed0.0% DivorcedWomen who did not give birth in the past 12 months Now married:
34.8% (104)Unmarried:
65.2% (195)
Marital status - White alone, not Hispanic / Latino population 15 years and over
Males 31.4% Never married59.5% Now married0.0% Separated2.3% Widowed6.8% DivorcedFemales 25.6% Never married55.1% Now married0.8% Separated11.3% Widowed7.2% DivorcedWomen who gave birth in the past 12 months Now married:
79.7% (52)Unmarried:
20.3% (13)
Women who did not give birth in the past 12 months Now married:
44.2% (730)Unmarried:
55.8% (920)
Marital status - Hispanic or Latino population 15 years and over
Males 33.7% Never married58.1% Now married0.0% Separated0.0% Widowed8.2% DivorcedFemales 37.2% Never married56.8% Now married0.0% Separated1.1% Widowed4.8% DivorcedWomen who gave birth in the past 12 months Now married:
100.0% (12)Unmarried:
0.0% (0)
Women who did not give birth in the past 12 months Now married:
42.5% (277)Unmarried:
57.5% (374)
Ancestries in Floral Park
1,668 22.1% Irish1,366 18.1% Italian617 8.2% American219 2.9% Polish180 2.4% German154 2.0% English81 1.1% Hungarian74 1.0% European71 0.9% British61 0.8% Turkish49 0.6% Lithuanian33 0.4% Ukrainian31 0.4% Armenian27 0.4% Croatian26 0.3% Scotch-Irish19 0.3% Haitian17 0.2% Scottish16 0.2% Iraqi15 0.2% Portuguese13 0.2% Jamaican13 0.2% Austrian13 0.2% Guyanese11 0.1% Greek10 0.1% Eastern European9 0.1% Maltese7 0.09% French Canadian7 0.09% Northern European6 0.08% Swedish5 0.07% Albanian5 0.07% Canadian5 0.07% Scandinavian4 0.05% French4 0.05% Afghan4 0.05% Iranian3 0.04% Slavic3 0.04% Swiss
Geographical mobility in Floral Park Same house 1 year ago 9,988 93.4% White (Caucasian)335 98.2% Black or African American49 100.0% American Indian / Alaska Native2,037 85.7% Asian626 92.3% Other race1,319 96.3% Two or more races9,575 93.0% White alone, not Hispanic / Latino2,422 96.4% Hispanic or LatinoMoved within same county 211 2.0% White / Caucasian13 2.0% Other race44 3.2% Two or more races225 2.2% White alone, not Hispanic / Latino41 1.6% Hispanic or LatinoMoved within same state 449 4.2% White / Caucasian2 0.7% Black or African American390 16.4% Asian18 2.7% Other race459 4.5% White alone, not Hispanic / Latino24 1.0% Hispanic or LatinoMoved from different state 40 0.4% White / Caucasian8 1.2% Other race41 0.4% White alone, not Hispanic / Latino6 0.2% Hispanic or LatinoMoved from abroad 12 0.1% White25 1.1% Asian2 0.1% Two or more races13 0.1% White alone, not Hispanic / Latino2 0.1% Hispanic or Latino
Children Nativity (place of birth) in Floral Park
Children under 6 years - Living with two parents Both parents native 428 100.0% NativeBoth parents foreign-born 332 100.0% NativeOne native, one foreign-born parent 194 100.0% NativeChildren under 6 years - Living with one parent Native parent 48 100.0% NativeForeign-born parent 18 100.0% NativeChildren 6 to 17 years - Living with two parents Both parents native 1,081 99.6% Native4 0.4% Foreign-bornBoth parents foreign-born 341 92.4% Native28 7.6% Foreign-bornOne native, one foreign-born parent 483 100.0% NativeChildren 6 to 17 years - Living with one parent Native parent 328 100.0% NativeForeign-born parent 36 60.5% Native23 39.5% Foreign-born
Grandparents responsible for own grandchildren in Floral Park
Grandparents (30 to 59 years) Other race 18 100.0% Not responsible for grandchildrenHispanic or Latino 13 100.0% Not responsible for grandchildren
Grandparents (60 years and over) Hispanic or Latino 30 100.0% Responsible for grandchildren