Races in Florham Park, New Jersey (NJ) Detailed Stats
Data:
Races - White alone (%)
Races - White alone (% change since 2000)
Races - Black alone (%)
Races - Black alone (% change since 2000)
Races - American Indian alone (%)
Races - American Indian alone (% change since 2000)
Races - Asian alone (%)
Races - Asian alone (% change since 2000)
Races - Hispanic (%)
Races - Hispanic (% change since 2000)
Races - Native Hawaiian and Other Pacific Islander alone (%)
Races - Native Hawaiian and Other Pacific Islander alone (% change since 2000)
Races - Two or more races(%)
Races - Two or more races(% change since 2000)
Races - Other race alone (%)
Races - Other race alone (% change since 2000)
Racial diversity
Place of birth - Born in state of residence (%)
Place of birth - Born in state of residence (%) - White
Place of birth - Born in state of residence (%) - Black or African American
Place of birth - Born in state of residence (%) - Asian
Place of birth - Born in state of residence (%) - Hispanic or Latino
Place of birth - Born in state of residence (%) - American Indian and Alaska Native
Place of birth - Born in state of residence (%) - Multirace
Place of birth - Born in state of residence (%) - Other Race
Place of birth - Born in other state (%)
Place of birth - Born in other state (%) - White
Place of birth - Born in other state (%) - Black or African American
Place of birth - Born in other state (%) - Asian
Place of birth - Born in other state (%) - Hispanic or Latino
Place of birth - Born in other state (%) - American Indian and Alaska Native
Place of birth - Born in other state (%) - Multirace
Place of birth - Born in other state (%) - Other Race
Place of birth - Native, outside of US (%)
Place of birth - Native, outside of US (%) - White
Place of birth - Native, outside of US (%) - Black or African American
Place of birth - Native, outside of US (%) - Asian
Place of birth - Native, outside of US (%) - Hispanic or Latino
Place of birth - Native, outside of US (%) - American Indian and Alaska Native
Place of birth - Native, outside of US (%) - Multirace
Place of birth - Native, outside of US (%) - Other Race
Place of birth - Foreign born (%)
Place of birth - Foreign born (%) - White
Place of birth - Foreign born (%) - Black or African American
Place of birth - Foreign born (%) - Asian
Place of birth - Foreign born (%) - Hispanic or Latino
Place of birth - Foreign born (%) - American Indian and Alaska Native
Place of birth - Foreign born (%) - Multirace
Place of birth - Foreign born (%) - Other Race
Residents speaking English at home (%)
Residents speaking English at home - Born in the United States (%)
Residents speaking English at home - Native, born elsewhere (%)
Residents speaking English at home - Foreign born (%)
Residents speaking Spanish at home (%)
Residents speaking Spanish at home - Born in the United States (%)
Residents speaking Spanish at home - Native, born elsewhere (%)
Residents speaking Spanish at home - Foreign born (%)
Residents speaking other language at home (%)
Residents speaking other language at home - Born in the United States (%)
Residents speaking other language at home - Native, born elsewhere (%)
Residents speaking other language at home - Foreign born (%)
Marital status - Never married (%)
Marital status - Now married (%)
Marital status - Separated (%)
Marital status - Widowed (%)
Marital status - Divorced (%)
Ancestries Reported - Arab (%)
Ancestries Reported - Czech (%)
Ancestries Reported - Danish (%)
Ancestries Reported - Dutch (%)
Ancestries Reported - English (%)
Ancestries Reported - French (%)
Ancestries Reported - French Canadian (%)
Ancestries Reported - German (%)
Ancestries Reported - Greek (%)
Ancestries Reported - Hungarian (%)
Ancestries Reported - Irish (%)
Ancestries Reported - Italian (%)
Ancestries Reported - Lithuanian (%)
Ancestries Reported - Norwegian (%)
Ancestries Reported - Polish (%)
Ancestries Reported - Portuguese (%)
Ancestries Reported - Russian (%)
Ancestries Reported - Scotch-Irish (%)
Ancestries Reported - Scottish (%)
Ancestries Reported - Slovak (%)
Ancestries Reported - Subsaharan African (%)
Ancestries Reported - Swedish (%)
Ancestries Reported - Swiss (%)
Ancestries Reported - Ukrainian (%)
Ancestries Reported - United States (%)
Ancestries Reported - Welsh (%)
Ancestries Reported - West Indian (%)
Ancestries Reported - Other (%)
Geographical mobility - Same house 1 year ago (%)
Geographical mobility - Same house 1 year ago (%) - White
Geographical mobility - Same house 1 year ago (%) - Black or African American
Geographical mobility - Same house 1 year ago (%) - Asian
Geographical mobility - Same house 1 year ago (%) - Hispanic or Latino
Geographical mobility - Same house 1 year ago (%) - American Indian and Alaska Native
Geographical mobility - Same house 1 year ago (%) - Multirace
Geographical mobility - Same house 1 year ago (%) - Other Race
Geographical mobility - Moved within same county (%)
Geographical mobility - Moved within same county (%) - White
Geographical mobility - Moved within same county (%) - Black or African American
Geographical mobility - Moved within same county (%) - Asian
Geographical mobility - Moved within same county (%) - Hispanic or Latino
Geographical mobility - Moved within same county (%) - American Indian and Alaska Native
Geographical mobility - Moved within same county (%) - Multirace
Geographical mobility - Moved within same county (%) - Other Race
Geographical mobility - Moved from different county within same state (%)
Geographical mobility - Moved from different county within same state (%) - White
Geographical mobility - Moved from different county within same state (%) - Black or African American
Geographical mobility - Moved from different county within same state (%) - Asian
Geographical mobility - Moved from different county within same state (%) - Hispanic or Latino
Geographical mobility - Moved from different county within same state (%) - American Indian and Alaska Native
Geographical mobility - Moved from different county within same state (%) - Multirace
Geographical mobility - Moved from different county within same state (%) - Other Race
Geographical mobility - Moved from different state (%)
Geographical mobility - Moved from different state (%) - White
Geographical mobility - Moved from different state (%) - Black or African American
Geographical mobility - Moved from different state (%) - Asian
Geographical mobility - Moved from different state (%) - Hispanic or Latino
Geographical mobility - Moved from different state (%) - American Indian and Alaska Native
Geographical mobility - Moved from different state (%) - Multirace
Geographical mobility - Moved from different state (%) - Other Race
Geographical mobility - Moved from abroad (%)
Geographical mobility - Moved from abroad (%) - White
Geographical mobility - Moved from abroad (%) - Black or African American
Geographical mobility - Moved from abroad (%) - Asian
Geographical mobility - Moved from abroad (%) - Hispanic or Latino
Geographical mobility - Moved from abroad (%) - American Indian and Alaska Native
Geographical mobility - Moved from abroad (%) - Multirace
Geographical mobility - Moved from abroad (%) - Other Race
Place of birth for the foreign-born population - Ireland (%)
Place of birth for the foreign-born population - Denmark (%)
Place of birth for the foreign-born population - Norway (%)
Place of birth for the foreign-born population - Sweden (%)
Place of birth for the foreign-born population - United Kingdom (%)
Place of birth for the foreign-born population - England (%)
Place of birth for the foreign-born population - Scotland (%)
Place of birth for the foreign-born population - Other Northern Europe (%)
Place of birth for the foreign-born population - Austria (%)
Place of birth for the foreign-born population - Belgium (%)
Place of birth for the foreign-born population - France (%)
Place of birth for the foreign-born population - Germany (%)
Place of birth for the foreign-born population - Netherlands (%)
Place of birth for the foreign-born population - Switzerland (%)
Place of birth for the foreign-born population - Other Western Europe (%)
Place of birth for the foreign-born population - Greece (%)
Place of birth for the foreign-born population - Italy (%)
Place of birth for the foreign-born population - Portugal (%)
Place of birth for the foreign-born population - Spain (%)
Place of birth for the foreign-born population - Other Southern Europe (%)
Place of birth for the foreign-born population - Albania (%)
Place of birth for the foreign-born population - Belarus (%)
Place of birth for the foreign-born population - Bosnia and Herzegovina (%)
Place of birth for the foreign-born population - Bulgaria (%)
Place of birth for the foreign-born population - Croatia (%)
Place of birth for the foreign-born population - Czechoslovakia (%)
Place of birth for the foreign-born population - Hungary (%)
Place of birth for the foreign-born population - Latvia (%)
Place of birth for the foreign-born population - Lithuania (%)
Place of birth for the foreign-born population - North Macedonia (Macedonia) (%)
Place of birth for the foreign-born population - Moldova (%)
Place of birth for the foreign-born population - Poland (%)
Place of birth for the foreign-born population - Romania (%)
Place of birth for the foreign-born population - Russia (%)
Place of birth for the foreign-born population - Serbia (%)
Place of birth for the foreign-born population - Ukraine (%)
Place of birth for the foreign-born population - Other Eastern Europe (%)
Place of birth for the foreign-born population - China (%)
Place of birth for the foreign-born population - Hong Kong (%)
Place of birth for the foreign-born population - Taiwan (%)
Place of birth for the foreign-born population - Japan (%)
Place of birth for the foreign-born population - Korea (%)
Place of birth for the foreign-born population - Other Eastern Asia (%)
Place of birth for the foreign-born population - Afghanistan (%)
Place of birth for the foreign-born population - Bangladesh (%)
Place of birth for the foreign-born population - India (%)
Place of birth for the foreign-born population - Iran (%)
Place of birth for the foreign-born population - Kazakhstan (%)
Place of birth for the foreign-born population - Nepal (%)
Place of birth for the foreign-born population - Pakistan (%)
Place of birth for the foreign-born population - Sri Lanka (%)
Place of birth for the foreign-born population - Uzbekistan (%)
Place of birth for the foreign-born population - Other South Central Asia (%)
Place of birth for the foreign-born population - Burma (%)
Place of birth for the foreign-born population - Cambodia (%)
Place of birth for the foreign-born population - Indonesia (%)
Place of birth for the foreign-born population - Laos (%)
Place of birth for the foreign-born population - Malaysia (%)
Place of birth for the foreign-born population - Philippines (%)
Place of birth for the foreign-born population - Singapore (%)
Place of birth for the foreign-born population - Thailand (%)
Place of birth for the foreign-born population - Vietnam (%)
Place of birth for the foreign-born population - Other South Eastern Asia (%)
Place of birth for the foreign-born population - Armenia (%)
Place of birth for the foreign-born population - Iraq (%)
Place of birth for the foreign-born population - Israel (%)
Place of birth for the foreign-born population - Jordan (%)
Place of birth for the foreign-born population - Kuwait (%)
Place of birth for the foreign-born population - Lebanon (%)
Place of birth for the foreign-born population - Saudi Arabia (%)
Place of birth for the foreign-born population - Syria (%)
Place of birth for the foreign-born population - Turkey (%)
Place of birth for the foreign-born population - Yemen (%)
Place of birth for the foreign-born population - Other Western Asia (%)
Place of birth for the foreign-born population - Eritrea (%)
Place of birth for the foreign-born population - Ethiopia (%)
Place of birth for the foreign-born population - Kenya (%)
Place of birth for the foreign-born population - Somalia (%)
Place of birth for the foreign-born population - Uganda (%)
Place of birth for the foreign-born population - Zimbabwe (%)
Place of birth for the foreign-born population - Other Eastern Africa (%)
Place of birth for the foreign-born population - Cameroon (%)
Place of birth for the foreign-born population - Congo (%)
Place of birth for the foreign-born population - Democratic Republic of Congo (Zaire) (%)
Place of birth for the foreign-born population - Other Middle Africa (%)
Place of birth for the foreign-born population - Egypt (%)
Place of birth for the foreign-born population - Morocco (%)
Place of birth for the foreign-born population - Sudan (%)
Place of birth for the foreign-born population - Other Northern Africa (%)
Place of birth for the foreign-born population - South Africa (%)
Place of birth for the foreign-born population - Other Southern Africa (%)
Place of birth for the foreign-born population - Cabo Verde (%)
Place of birth for the foreign-born population - Ghana (%)
Place of birth for the foreign-born population - Liberia (%)
Place of birth for the foreign-born population - Nigeria (%)
Place of birth for the foreign-born population - Senegal (%)
Place of birth for the foreign-born population - Sierra Leone (%)
Place of birth for the foreign-born population - Other Western Africa (%)
Place of birth for the foreign-born population - Australia (%)
Place of birth for the foreign-born population - New Zealand (%)
Place of birth for the foreign-born population - Fiji (%)
Place of birth for the foreign-born population - Micronesia (%)
Place of birth for the foreign-born population - Bahamas (%)
Place of birth for the foreign-born population - Barbados (%)
Place of birth for the foreign-born population - Cuba (%)
Place of birth for the foreign-born population - Dominica (%)
Place of birth for the foreign-born population - Dominican Republic (%)
Place of birth for the foreign-born population - Grenada (%)
Place of birth for the foreign-born population - Haiti (%)
Place of birth for the foreign-born population - Jamaica (%)
Place of birth for the foreign-born population - St. Vincent and the Grenadines (%)
Place of birth for the foreign-born population - Trinidad and Tobago (%)
Place of birth for the foreign-born population - West Indies (%)
Place of birth for the foreign-born population - Other Caribbean (%)
Place of birth for the foreign-born population - Belize (%)
Place of birth for the foreign-born population - Costa Rica (%)
Place of birth for the foreign-born population - El Salvador (%)
Place of birth for the foreign-born population - Guatemala (%)
Place of birth for the foreign-born population - Honduras (%)
Place of birth for the foreign-born population - Mexico (%)
Place of birth for the foreign-born population - Nicaragua (%)
Place of birth for the foreign-born population - Panama (%)
Place of birth for the foreign-born population - Other Central America (%)
Place of birth for the foreign-born population - Argentina (%)
Place of birth for the foreign-born population - Bolivia (%)
Place of birth for the foreign-born population - Brazil (%)
Place of birth for the foreign-born population - Chile (%)
Place of birth for the foreign-born population - Colombia (%)
Place of birth for the foreign-born population - Ecuador (%)
Place of birth for the foreign-born population - Guyana (%)
Place of birth for the foreign-born population - Peru (%)
Place of birth for the foreign-born population - Uruguay (%)
Place of birth for the foreign-born population - Venezuela (%)
Place of birth for the foreign-born population - Other South America (%)
Place of birth for the foreign-born population - Canada (%)
Place of birth for the foreign-born population - Other Northern America (%)
Place of birth for the foreign-born population - Other (%)
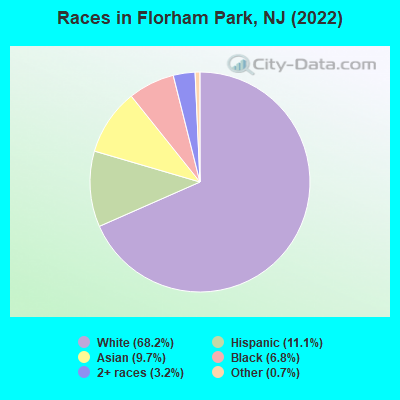
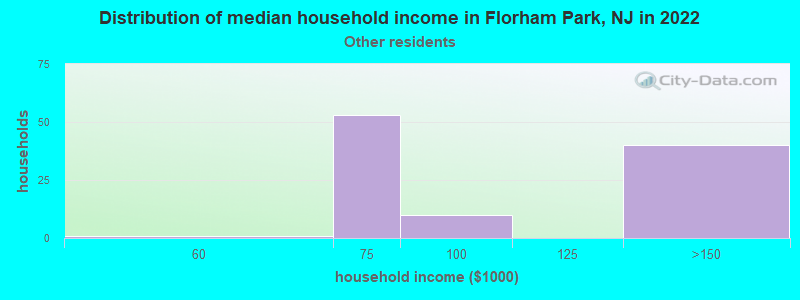
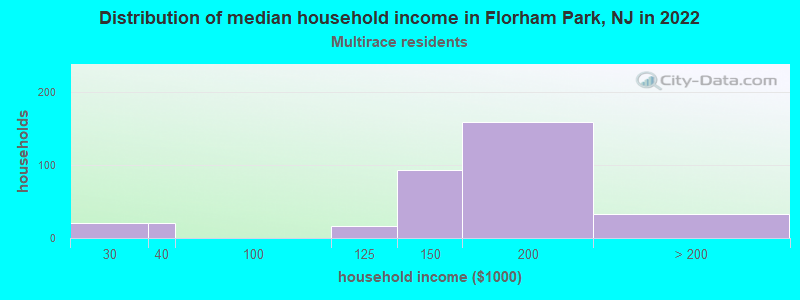
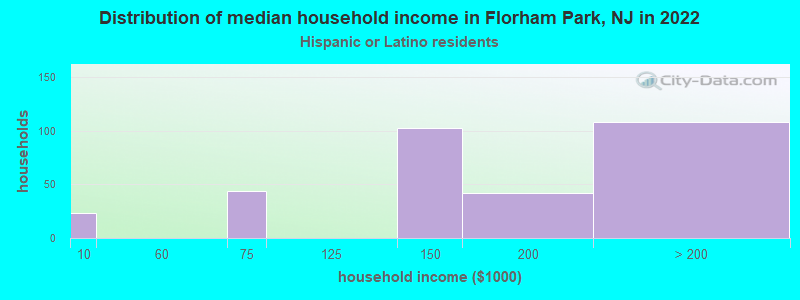
According to 2022 data, the most numerous races in Florham Park, NJ are White alone (8,768 residents), Hispanic (1,421 residents), and Black alone (878 residents). 84.0% of Florham Park residents speak English at home. 12.8% of Florham Park, NJ residents are foreign-born (6.0% born in Asia, 3.7% born in Latin America, 2.5% born in Europe), which is 79.1% less than the foreign-born rate of 23.0% across the entire state of New Jersey.
Race distribution in Florham Park
2000 2022
5,557,209 66.0% White alone 1,117,191 13.3% Hispanic 1,096,171 13.0% Black alone 477,012 5.7% Asian alone 133,689 1.6% Two or more races 19,565 0.2% Other race alone 11,338 0.1% American Indian alone 2,175 0.03% Native Hawaiian and Other
4,766,476 51.5% White alone 2,028,470 21.9% Hispanic 1,111,632 12.0% Black alone 923,546 10.0% Asian alone 332,237 3.6% Two or more races 89,847 1.0% Other race alone 8,557 0.09% American Indian alone 934 0.01% Native Hawaiian and Other
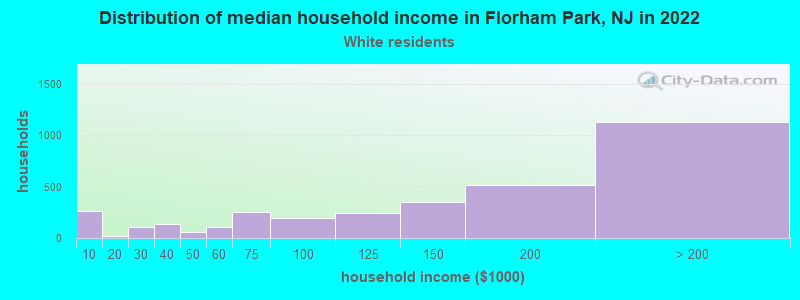
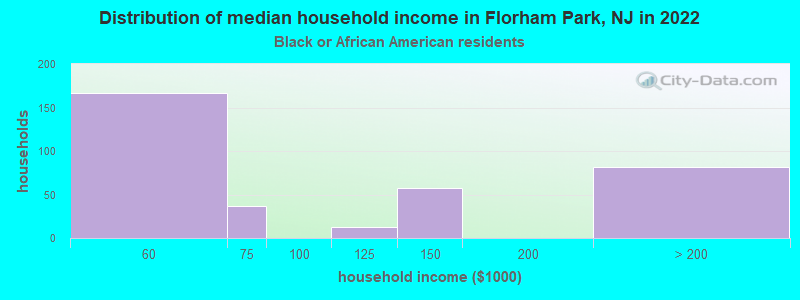
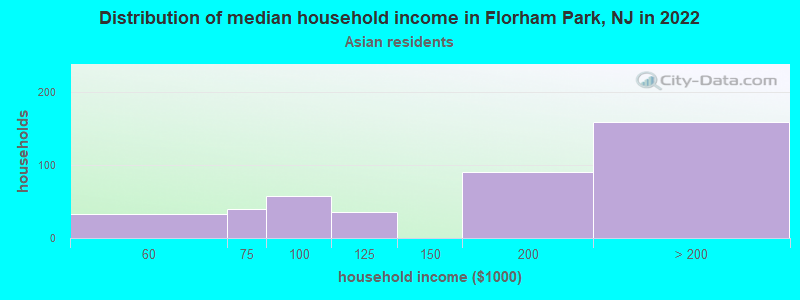
Income and house value in Florham Park Median household income in 2022 $138,625 White non-Hispanic householders$170,016 Asian householders$87,295 Some other race householders$171,220 Two or more races householders$142,592 Hispanic or Latino race householdersMedian 2022 house value $743,216 White Non-Hispanic householders$804,595 Black or African American householders $610,113 Asian householdersover $1,000,000 Two or more races householders$663,446 Hispanic or Latino householders
Median age by race in Florham Park
45.0 Median age for White residents36.2 50.1 31.1 Median age for Black or African American residents32.6 37.6 -847,710,329.3 Median age for American Indian / Alaska Native residents-707,246,376.1 -671,264,367.1 38.7 Median age for Asian residents29.5 40.8 -804,177,544.9 Median age for Native Hawaiian / Pacific Islander residents-666,666,666.0 -713,070,378.3 39.0 Median age for Other race residents46.3 33.6 28.1 Median age for Two or more races residents54.2 22.6 46.3 Median age for White alone residents40.8 51.3 21.3 Median age for Hispanic or Latino residents21.2 21.7
Owner/renter occupied households by race in Florham Park
House owners and renters - White residents 2,505 75.3% Owner occupied821 24.7% Renter occupiedHouse owners and renters - Black or African American residents 200 53.7% Owner occupied173 46.3% Renter occupiedHouse owners and renters - Asian residents 244 63.3% Owner occupied142 36.7% Renter occupiedHouse owners and renters - Other race residents 52 54.6% Owner occupied44 45.4% Renter occupiedHouse owners and renters - Two or more races residents 248 68.2% Owner occupied116 31.8% Renter occupiedHouse owners and renters - White alone residents 2,478 73.9% Owner occupied874 26.1% Renter occupiedHouse owners and renters - Hispanic or Latino residents 144 54.1% Owner occupied122 45.9% Renter occupied
Language usage in Florham Park
English speakers - Total 84.0% of residents of Florham Park speak English at home.
4.0% of residents speak Spanish at home 340 67.9% Speak English very well161 32.1% Speak English less than very well11.9% of residents speak other language at home 956 64.7% Speak English very well521 35.3% Speak English less than very well
English speakers - Born in the United States 91.3% of residents of Florham Park speak English at home.
1.8% of residents speak Spanish at home 58 100.0% Speak English very well6.5% of residents speak other language at home 134 64.7% Speak English very well73 35.3% Speak English less than very well
English speakers - Native, born elsewhere 66.0% of residents of Florham Park speak English at home.
25.5% of residents speak Spanish at home 13 54.2% Speak English very well11 45.8% Speak English less than very well8.5% of residents speak other language at home 8 100.0% Speak English very well
English speakers - Foreign-born 30.4% of residents of Florham Park speak English at home.
17.5% of residents speak Spanish at home 151 55.9% Speak English very well119 44.1% Speak English less than very well51.0% of residents speak other language at home 566 71.7% Speak English very well223 28.3% Speak English less than very well
White (Caucasian) - Speak only English Native:
96.4% (8,172)Foreign-born:
56.2% (197)
White (Caucasian) - Speak another language Native:
3.9% (331)Foreign-born:
50.0% (175)
Black or African American - Speak only English Native:
98.0% (932)Foreign-born:
86.2% (43)
Black or African American - Speak another language Native:
2.2% (21)Foreign-born:
24.4% (12)
Asian - Speak only English Native:
27.8% (149)Foreign-born:
15.8% (105)
Asian - Speak another language Native:
70.3% (377)Foreign-born:
82.2% (547)
Other race - Speak only English Native:
61.8% (109)Foreign-born:
48.1% (90)
Other race - Speak another language Native:
33.3% (59)Foreign-born:
54.4% (102)
Two or more races - Speak only English Native:
84.5% (612)Foreign-born:
12.8% (28)
Two or more races - Speak another language Native:
14.6% (106)Foreign-born:
87.0% (192)
White alone - Speak only English Native:
97.0% (7,853)Foreign-born:
48.1% (184)
White alone - Speak another language Native:
3.0% (243)Foreign-born:
49.8% (190)
Hispanic or Latino - Speak only English Native:
74.0% (730)Foreign-born:
33.8% (127)
Hispanic or Latino - Speak another language Native:
27.9% (276)Foreign-born:
72.7% (273)
Foreign-born residents in Florham Park 1,650 residents are foreign born (6.0% Asia , 3.7% Latin America , 2.5% Europe ).
This city:
12.8%New Jersey:
23.2%
Marital status for residents in Florham Park Marital status - White (Caucasian) population 15 years and over
Males 41.1% Never married50.3% Now married0.9% Separated0.9% Widowed6.8% DivorcedFemales 34.5% Never married41.7% Now married0.3% Separated13.2% Widowed10.3% DivorcedWomen who gave birth in the past 12 months Now married:
86.7% (65)Unmarried:
13.3% (10)
Women who did not give birth in the past 12 months Now married:
32.9% (640)Unmarried:
67.1% (1,303)
Marital status - Black or African American population 15 years and over
Males 66.7% Never married28.4% Now married0.0% Separated0.0% Widowed4.9% DivorcedFemales 59.3% Never married36.9% Now married3.7% Separated0.0% Widowed0.0% DivorcedWomen who did not give birth in the past 12 months Now married:
3.1% (8)Unmarried:
96.9% (243)
Marital status - Asian population 15 years and over
Males 26.1% Never married73.1% Now married0.0% Separated0.8% Widowed0.0% DivorcedFemales 20.0% Never married70.7% Now married0.0% Separated0.0% Widowed9.3% DivorcedWomen who gave birth in the past 12 months Now married:
100.0% (25)Unmarried:
0.0% (0)
Women who did not give birth in the past 12 months Now married:
48.8% (112)Unmarried:
51.2% (118)
Marital status - Other race population 15 years and over
Males 15.1% Never married72.0% Now married12.9% Separated0.0% Widowed0.0% DivorcedFemales 26.7% Never married72.5% Now married0.0% Separated0.8% Widowed0.0% DivorcedWomen who did not give birth in the past 12 months Now married:
60.2% (70)Unmarried:
39.8% (46)
Marital status - Two or more races population 15 years and over
Males 44.9% Never married39.4% Now married0.0% Separated0.0% Widowed15.7% DivorcedFemales 65.5% Never married15.8% Now married0.0% Separated18.7% Widowed0.0% DivorcedWomen who did not give birth in the past 12 months Now married:
13.8% (25)Unmarried:
86.2% (155)
Marital status - White alone, not Hispanic / Latino population 15 years and over
Males 40.7% Never married51.2% Now married0.0% Separated1.0% Widowed7.1% DivorcedFemales 33.0% Never married42.0% Now married0.4% Separated14.0% Widowed10.7% DivorcedWomen who gave birth in the past 12 months Now married:
86.7% (69)Unmarried:
13.3% (11)
Women who did not give birth in the past 12 months Now married:
31.7% (557)Unmarried:
68.3% (1,202)
Marital status - Hispanic or Latino population 15 years and over
Males 39.6% Never married49.7% Now married10.8% Separated0.0% Widowed0.0% DivorcedFemales 55.3% Never married39.1% Now married0.0% Separated2.6% Widowed3.1% DivorcedWomen who did not give birth in the past 12 months Now married:
35.8% (200)Unmarried:
64.2% (359)
Ancestries in Florham Park
1,136 17.9% Italian419 6.6% Irish389 6.1% American249 3.9% German168 2.7% Lebanese157 2.5% African131 2.1% Russian115 1.8% Polish114 1.8% Portuguese110 1.7% Greek103 1.6% European80 1.3% Iranian54 0.9% English51 0.8% Albanian49 0.8% Ukrainian35 0.6% Brazilian35 0.6% Jamaican34 0.5% Slavic25 0.4% Czechoslovakian25 0.4% Haitian21 0.3% Danish21 0.3% Hungarian18 0.3% Canadian18 0.3% Yugoslavian17 0.3% Lithuanian17 0.3% Eastern European16 0.3% Guyanese15 0.2% Israeli14 0.2% French13 0.2% French Canadian12 0.2% Syrian11 0.2% Slovak10 0.2% Pennsylvania German10 0.2% Scottish10 0.2% Ethiopian9 0.1% Turkish8 0.1% Northern European
Children Nativity (place of birth) in Florham Park
Children under 6 years - Living with two parents Both parents native 365 100.0% NativeBoth parents foreign-born 13 39.7% Native20 60.3% Foreign-bornOne native, one foreign-born parent 74 100.0% NativeChildren under 6 years - Living with one parent Native parent 116 100.0% NativeChildren 6 to 17 years - Living with two parents Both parents native 596 98.8% Native7 1.2% Foreign-bornBoth parents foreign-born 107 74.9% Native36 25.1% Foreign-bornOne native, one foreign-born parent 386 100.0% NativeChildren 6 to 17 years - Living with one parent Native parent 272 100.0% Native
Grandparents responsible for own grandchildren in Florham Park
Grandparents (30 to 59 years) White / Caucasian 85 100.0% Not responsible for grandchildrenAsian 19 100.0% Not responsible for grandchildrenWhite alone, not Hispanic / Latino 96 100.0% Not responsible for grandchildrenGrandparents (60 years and over) White / Caucasian 40 42.4% Responsible for grandchildren55 57.6% Not responsible for grandchildrenAsian 29 100.0% Not responsible for grandchildrenWhite alone, not Hispanic / Latino 46 43.1% Responsible for grandchildren61 56.9% Not responsible for grandchildren