Races in Forest Grove, Oregon (OR) Detailed Stats
Data:
Races - White alone (%)
Races - White alone (% change since 2000)
Races - Black alone (%)
Races - Black alone (% change since 2000)
Races - American Indian alone (%)
Races - American Indian alone (% change since 2000)
Races - Asian alone (%)
Races - Asian alone (% change since 2000)
Races - Hispanic (%)
Races - Hispanic (% change since 2000)
Races - Native Hawaiian and Other Pacific Islander alone (%)
Races - Native Hawaiian and Other Pacific Islander alone (% change since 2000)
Races - Two or more races(%)
Races - Two or more races(% change since 2000)
Races - Other race alone (%)
Races - Other race alone (% change since 2000)
Racial diversity
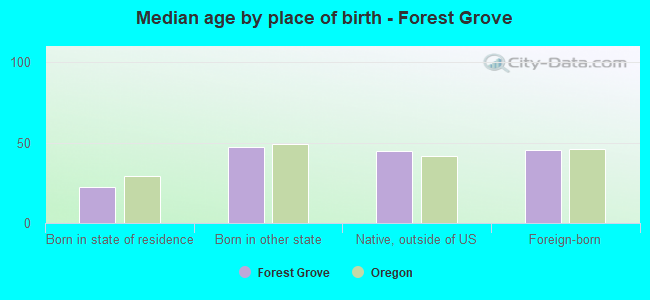
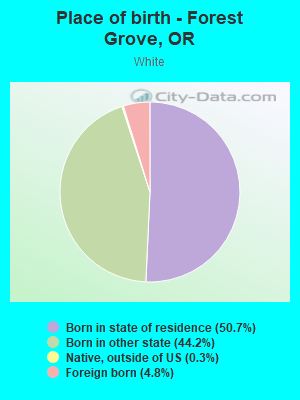
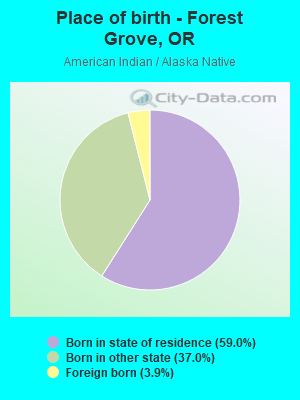
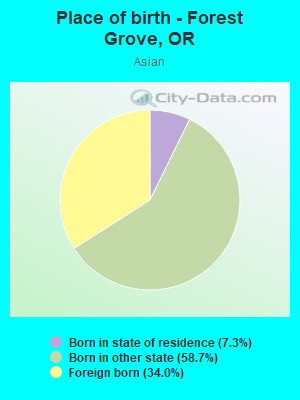
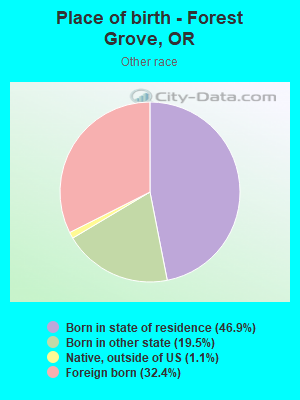
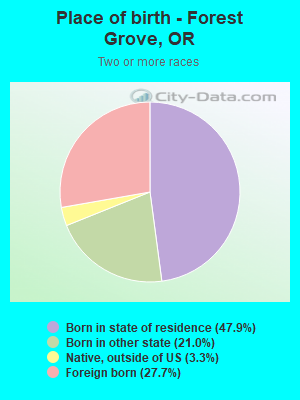
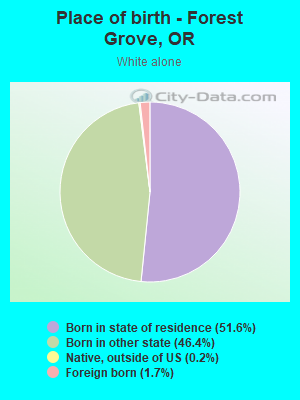
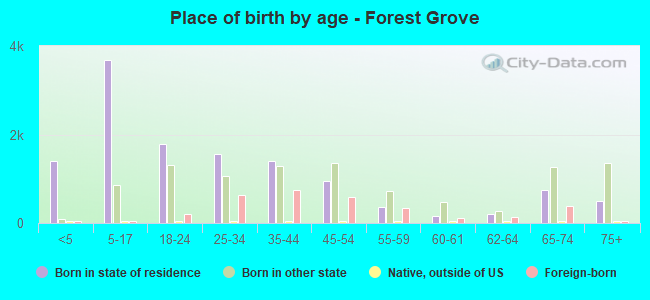
Place of birth - Born in state of residence (%)
Place of birth - Born in state of residence (%) - White
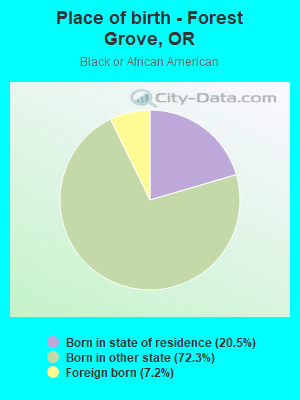
Place of birth - Born in state of residence (%) - Black or African American
Place of birth - Born in state of residence (%) - Asian
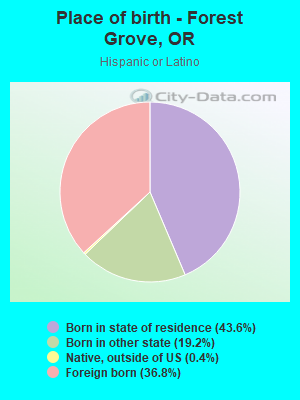
Place of birth - Born in state of residence (%) - Hispanic or Latino
Place of birth - Born in state of residence (%) - American Indian and Alaska Native
Place of birth - Born in state of residence (%) - Multirace
Place of birth - Born in state of residence (%) - Other Race
Place of birth - Born in other state (%)
Place of birth - Born in other state (%) - White
Place of birth - Born in other state (%) - Black or African American
Place of birth - Born in other state (%) - Asian
Place of birth - Born in other state (%) - Hispanic or Latino
Place of birth - Born in other state (%) - American Indian and Alaska Native
Place of birth - Born in other state (%) - Multirace
Place of birth - Born in other state (%) - Other Race
Place of birth - Native, outside of US (%)
Place of birth - Native, outside of US (%) - White
Place of birth - Native, outside of US (%) - Black or African American
Place of birth - Native, outside of US (%) - Asian
Place of birth - Native, outside of US (%) - Hispanic or Latino
Place of birth - Native, outside of US (%) - American Indian and Alaska Native
Place of birth - Native, outside of US (%) - Multirace
Place of birth - Native, outside of US (%) - Other Race
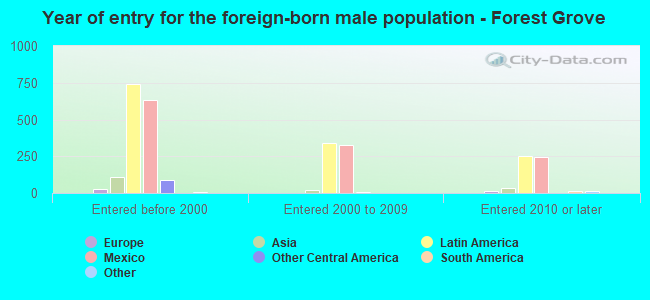
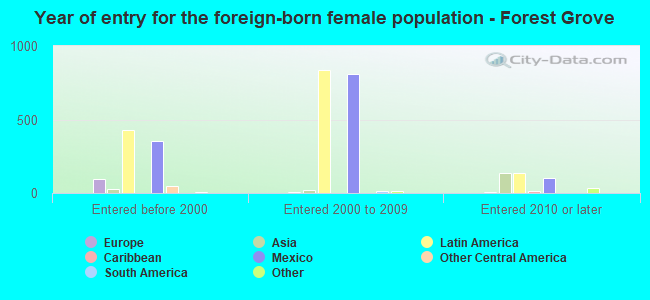
Place of birth - Foreign born (%)
Place of birth - Foreign born (%) - White
Place of birth - Foreign born (%) - Black or African American
Place of birth - Foreign born (%) - Asian
Place of birth - Foreign born (%) - Hispanic or Latino
Place of birth - Foreign born (%) - American Indian and Alaska Native
Place of birth - Foreign born (%) - Multirace
Place of birth - Foreign born (%) - Other Race
Residents speaking English at home (%)
Residents speaking English at home - Born in the United States (%)
Residents speaking English at home - Native, born elsewhere (%)
Residents speaking English at home - Foreign born (%)
Residents speaking Spanish at home (%)
Residents speaking Spanish at home - Born in the United States (%)
Residents speaking Spanish at home - Native, born elsewhere (%)
Residents speaking Spanish at home - Foreign born (%)
Residents speaking other language at home (%)
Residents speaking other language at home - Born in the United States (%)
Residents speaking other language at home - Native, born elsewhere (%)
Residents speaking other language at home - Foreign born (%)
Marital status - Never married (%)
Marital status - Now married (%)
Marital status - Separated (%)
Marital status - Widowed (%)
Marital status - Divorced (%)
Ancestries Reported - Arab (%)
Ancestries Reported - Czech (%)
Ancestries Reported - Danish (%)
Ancestries Reported - Dutch (%)
Ancestries Reported - English (%)
Ancestries Reported - French (%)
Ancestries Reported - French Canadian (%)
Ancestries Reported - German (%)
Ancestries Reported - Greek (%)
Ancestries Reported - Hungarian (%)
Ancestries Reported - Irish (%)
Ancestries Reported - Italian (%)
Ancestries Reported - Lithuanian (%)
Ancestries Reported - Norwegian (%)
Ancestries Reported - Polish (%)
Ancestries Reported - Portuguese (%)
Ancestries Reported - Russian (%)
Ancestries Reported - Scotch-Irish (%)
Ancestries Reported - Scottish (%)
Ancestries Reported - Slovak (%)
Ancestries Reported - Subsaharan African (%)
Ancestries Reported - Swedish (%)
Ancestries Reported - Swiss (%)
Ancestries Reported - Ukrainian (%)
Ancestries Reported - United States (%)
Ancestries Reported - Welsh (%)
Ancestries Reported - West Indian (%)
Ancestries Reported - Other (%)
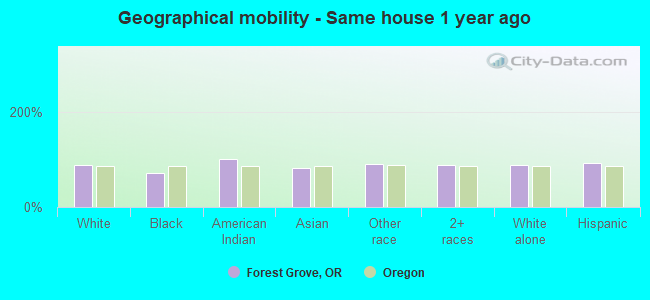
Geographical mobility - Same house 1 year ago (%)
Geographical mobility - Same house 1 year ago (%) - White
Geographical mobility - Same house 1 year ago (%) - Black or African American
Geographical mobility - Same house 1 year ago (%) - Asian
Geographical mobility - Same house 1 year ago (%) - Hispanic or Latino
Geographical mobility - Same house 1 year ago (%) - American Indian and Alaska Native
Geographical mobility - Same house 1 year ago (%) - Multirace
Geographical mobility - Same house 1 year ago (%) - Other Race
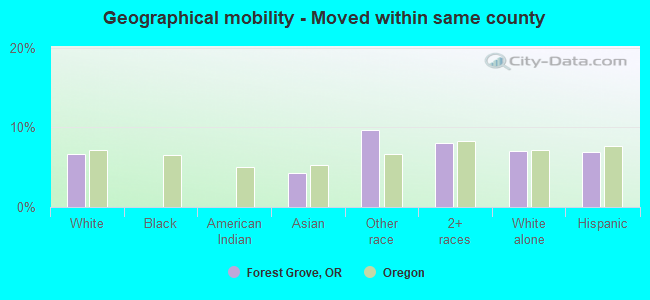
Geographical mobility - Moved within same county (%)
Geographical mobility - Moved within same county (%) - White
Geographical mobility - Moved within same county (%) - Black or African American
Geographical mobility - Moved within same county (%) - Asian
Geographical mobility - Moved within same county (%) - Hispanic or Latino
Geographical mobility - Moved within same county (%) - American Indian and Alaska Native
Geographical mobility - Moved within same county (%) - Multirace
Geographical mobility - Moved within same county (%) - Other Race
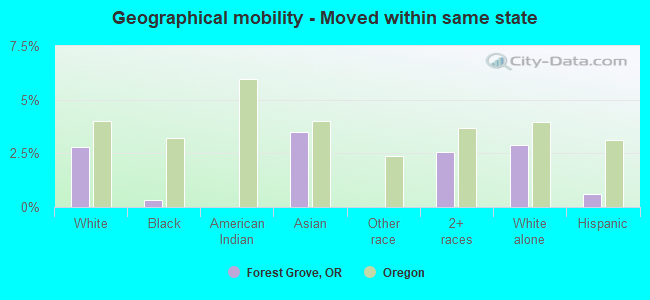
Geographical mobility - Moved from different county within same state (%)
Geographical mobility - Moved from different county within same state (%) - White
Geographical mobility - Moved from different county within same state (%) - Black or African American
Geographical mobility - Moved from different county within same state (%) - Asian
Geographical mobility - Moved from different county within same state (%) - Hispanic or Latino
Geographical mobility - Moved from different county within same state (%) - American Indian and Alaska Native
Geographical mobility - Moved from different county within same state (%) - Multirace
Geographical mobility - Moved from different county within same state (%) - Other Race
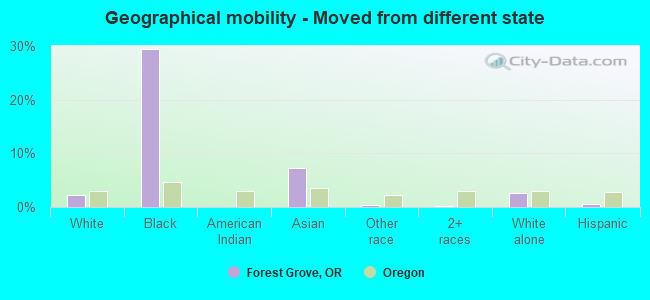
Geographical mobility - Moved from different state (%)
Geographical mobility - Moved from different state (%) - White
Geographical mobility - Moved from different state (%) - Black or African American
Geographical mobility - Moved from different state (%) - Asian
Geographical mobility - Moved from different state (%) - Hispanic or Latino
Geographical mobility - Moved from different state (%) - American Indian and Alaska Native
Geographical mobility - Moved from different state (%) - Multirace
Geographical mobility - Moved from different state (%) - Other Race
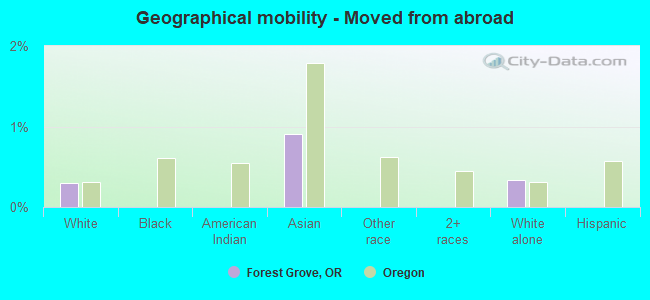
Geographical mobility - Moved from abroad (%)
Geographical mobility - Moved from abroad (%) - White
Geographical mobility - Moved from abroad (%) - Black or African American
Geographical mobility - Moved from abroad (%) - Asian
Geographical mobility - Moved from abroad (%) - Hispanic or Latino
Geographical mobility - Moved from abroad (%) - American Indian and Alaska Native
Geographical mobility - Moved from abroad (%) - Multirace
Geographical mobility - Moved from abroad (%) - Other Race
Place of birth for the foreign-born population - Ireland (%)
Place of birth for the foreign-born population - Denmark (%)
Place of birth for the foreign-born population - Norway (%)
Place of birth for the foreign-born population - Sweden (%)
Place of birth for the foreign-born population - United Kingdom (%)
Place of birth for the foreign-born population - England (%)
Place of birth for the foreign-born population - Scotland (%)
Place of birth for the foreign-born population - Other Northern Europe (%)
Place of birth for the foreign-born population - Austria (%)
Place of birth for the foreign-born population - Belgium (%)
Place of birth for the foreign-born population - France (%)
Place of birth for the foreign-born population - Germany (%)
Place of birth for the foreign-born population - Netherlands (%)
Place of birth for the foreign-born population - Switzerland (%)
Place of birth for the foreign-born population - Other Western Europe (%)
Place of birth for the foreign-born population - Greece (%)
Place of birth for the foreign-born population - Italy (%)
Place of birth for the foreign-born population - Portugal (%)
Place of birth for the foreign-born population - Spain (%)
Place of birth for the foreign-born population - Other Southern Europe (%)
Place of birth for the foreign-born population - Albania (%)
Place of birth for the foreign-born population - Belarus (%)
Place of birth for the foreign-born population - Bosnia and Herzegovina (%)
Place of birth for the foreign-born population - Bulgaria (%)
Place of birth for the foreign-born population - Croatia (%)
Place of birth for the foreign-born population - Czechoslovakia (%)
Place of birth for the foreign-born population - Hungary (%)
Place of birth for the foreign-born population - Latvia (%)
Place of birth for the foreign-born population - Lithuania (%)
Place of birth for the foreign-born population - North Macedonia (Macedonia) (%)
Place of birth for the foreign-born population - Moldova (%)
Place of birth for the foreign-born population - Poland (%)
Place of birth for the foreign-born population - Romania (%)
Place of birth for the foreign-born population - Russia (%)
Place of birth for the foreign-born population - Serbia (%)
Place of birth for the foreign-born population - Ukraine (%)
Place of birth for the foreign-born population - Other Eastern Europe (%)
Place of birth for the foreign-born population - China (%)
Place of birth for the foreign-born population - Hong Kong (%)
Place of birth for the foreign-born population - Taiwan (%)
Place of birth for the foreign-born population - Japan (%)
Place of birth for the foreign-born population - Korea (%)
Place of birth for the foreign-born population - Other Eastern Asia (%)
Place of birth for the foreign-born population - Afghanistan (%)
Place of birth for the foreign-born population - Bangladesh (%)
Place of birth for the foreign-born population - India (%)
Place of birth for the foreign-born population - Iran (%)
Place of birth for the foreign-born population - Kazakhstan (%)
Place of birth for the foreign-born population - Nepal (%)
Place of birth for the foreign-born population - Pakistan (%)
Place of birth for the foreign-born population - Sri Lanka (%)
Place of birth for the foreign-born population - Uzbekistan (%)
Place of birth for the foreign-born population - Other South Central Asia (%)
Place of birth for the foreign-born population - Burma (%)
Place of birth for the foreign-born population - Cambodia (%)
Place of birth for the foreign-born population - Indonesia (%)
Place of birth for the foreign-born population - Laos (%)
Place of birth for the foreign-born population - Malaysia (%)
Place of birth for the foreign-born population - Philippines (%)
Place of birth for the foreign-born population - Singapore (%)
Place of birth for the foreign-born population - Thailand (%)
Place of birth for the foreign-born population - Vietnam (%)
Place of birth for the foreign-born population - Other South Eastern Asia (%)
Place of birth for the foreign-born population - Armenia (%)
Place of birth for the foreign-born population - Iraq (%)
Place of birth for the foreign-born population - Israel (%)
Place of birth for the foreign-born population - Jordan (%)
Place of birth for the foreign-born population - Kuwait (%)
Place of birth for the foreign-born population - Lebanon (%)
Place of birth for the foreign-born population - Saudi Arabia (%)
Place of birth for the foreign-born population - Syria (%)
Place of birth for the foreign-born population - Turkey (%)
Place of birth for the foreign-born population - Yemen (%)
Place of birth for the foreign-born population - Other Western Asia (%)
Place of birth for the foreign-born population - Eritrea (%)
Place of birth for the foreign-born population - Ethiopia (%)
Place of birth for the foreign-born population - Kenya (%)
Place of birth for the foreign-born population - Somalia (%)
Place of birth for the foreign-born population - Uganda (%)
Place of birth for the foreign-born population - Zimbabwe (%)
Place of birth for the foreign-born population - Other Eastern Africa (%)
Place of birth for the foreign-born population - Cameroon (%)
Place of birth for the foreign-born population - Congo (%)
Place of birth for the foreign-born population - Democratic Republic of Congo (Zaire) (%)
Place of birth for the foreign-born population - Other Middle Africa (%)
Place of birth for the foreign-born population - Egypt (%)
Place of birth for the foreign-born population - Morocco (%)
Place of birth for the foreign-born population - Sudan (%)
Place of birth for the foreign-born population - Other Northern Africa (%)
Place of birth for the foreign-born population - South Africa (%)
Place of birth for the foreign-born population - Other Southern Africa (%)
Place of birth for the foreign-born population - Cabo Verde (%)
Place of birth for the foreign-born population - Ghana (%)
Place of birth for the foreign-born population - Liberia (%)
Place of birth for the foreign-born population - Nigeria (%)
Place of birth for the foreign-born population - Senegal (%)
Place of birth for the foreign-born population - Sierra Leone (%)
Place of birth for the foreign-born population - Other Western Africa (%)
Place of birth for the foreign-born population - Australia (%)
Place of birth for the foreign-born population - New Zealand (%)
Place of birth for the foreign-born population - Fiji (%)
Place of birth for the foreign-born population - Micronesia (%)
Place of birth for the foreign-born population - Bahamas (%)
Place of birth for the foreign-born population - Barbados (%)
Place of birth for the foreign-born population - Cuba (%)
Place of birth for the foreign-born population - Dominica (%)
Place of birth for the foreign-born population - Dominican Republic (%)
Place of birth for the foreign-born population - Grenada (%)
Place of birth for the foreign-born population - Haiti (%)
Place of birth for the foreign-born population - Jamaica (%)
Place of birth for the foreign-born population - St. Vincent and the Grenadines (%)
Place of birth for the foreign-born population - Trinidad and Tobago (%)
Place of birth for the foreign-born population - West Indies (%)
Place of birth for the foreign-born population - Other Caribbean (%)
Place of birth for the foreign-born population - Belize (%)
Place of birth for the foreign-born population - Costa Rica (%)
Place of birth for the foreign-born population - El Salvador (%)
Place of birth for the foreign-born population - Guatemala (%)
Place of birth for the foreign-born population - Honduras (%)
Place of birth for the foreign-born population - Mexico (%)
Place of birth for the foreign-born population - Nicaragua (%)
Place of birth for the foreign-born population - Panama (%)
Place of birth for the foreign-born population - Other Central America (%)
Place of birth for the foreign-born population - Argentina (%)
Place of birth for the foreign-born population - Bolivia (%)
Place of birth for the foreign-born population - Brazil (%)
Place of birth for the foreign-born population - Chile (%)
Place of birth for the foreign-born population - Colombia (%)
Place of birth for the foreign-born population - Ecuador (%)
Place of birth for the foreign-born population - Guyana (%)
Place of birth for the foreign-born population - Peru (%)
Place of birth for the foreign-born population - Uruguay (%)
Place of birth for the foreign-born population - Venezuela (%)
Place of birth for the foreign-born population - Other South America (%)
Place of birth for the foreign-born population - Canada (%)
Place of birth for the foreign-born population - Other Northern America (%)
Place of birth for the foreign-born population - Other (%)
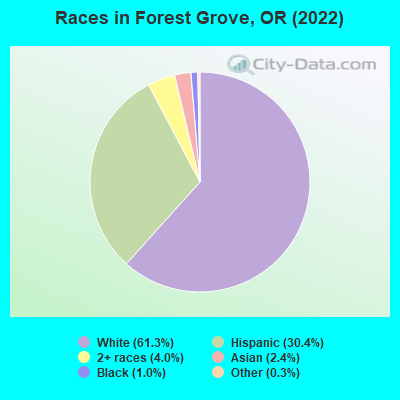
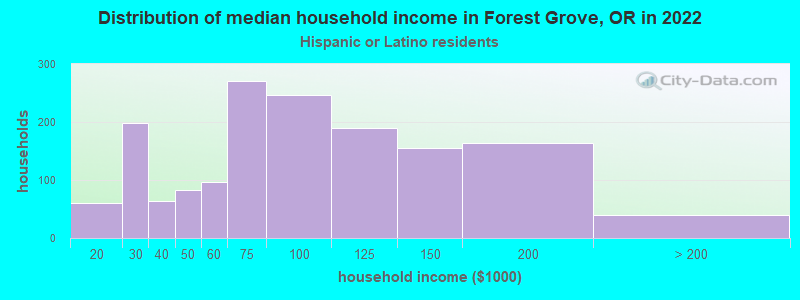
According to 2022 data, the most numerous races in Forest Grove, OR are White alone (16,060 residents), Hispanic (7,949 residents), and Two or more races (1,055 residents). 75.0% of Forest Grove residents speak English at home. 12.1% of Forest Grove, OR residents are foreign-born (9.7% born in Latin America, 1.3% born in Asia), which is 25.9% greater than the foreign-born rate of 9.0% across the entire state of Oregon.
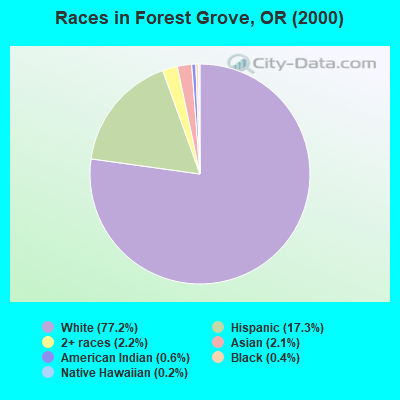
Race distribution in Forest Grove
2000 2022
2,857,616 83.5% White alone 275,314 8.0% Hispanic 100,333 2.9% Asian alone 82,733 2.4% Two or more races 53,325 1.6% Black alone 40,130 1.2% American Indian alone 7,398 0.2% Native Hawaiian and Other 4,550 0.1% Other race alone
3,037,571 71.6% White alone 609,538 14.4% Hispanic 252,744 6.0% Two or more races 191,283 4.5% Asian alone 78,228 1.8% Black alone 29,399 0.7% American Indian alone 25,731 0.6% Other race alone 15,643 0.4% Native Hawaiian and Other
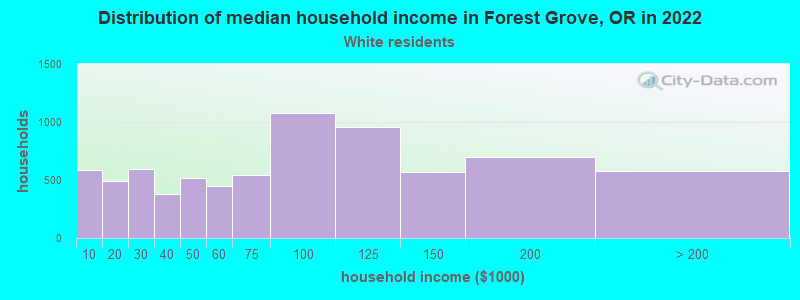
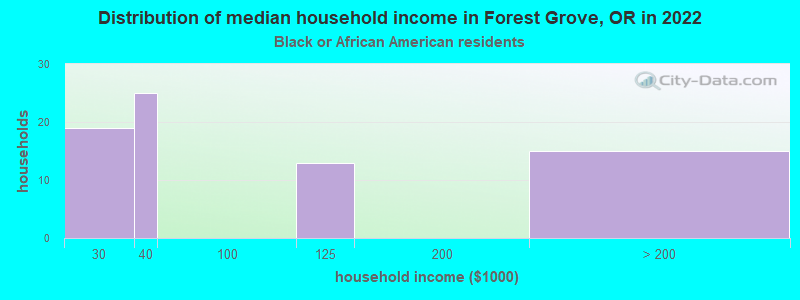
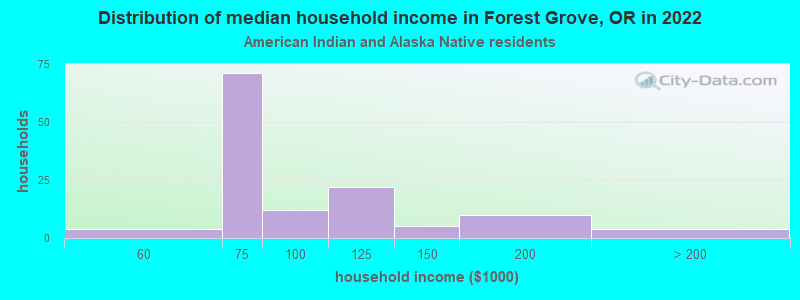
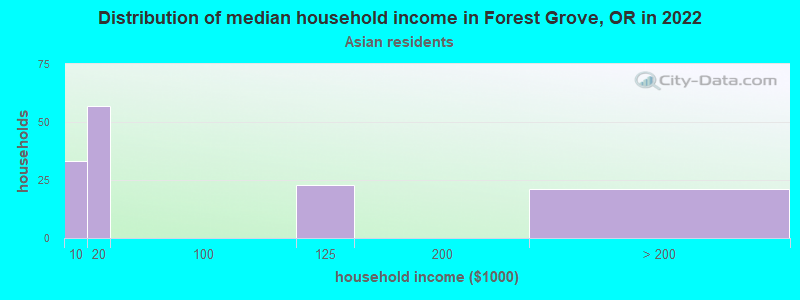
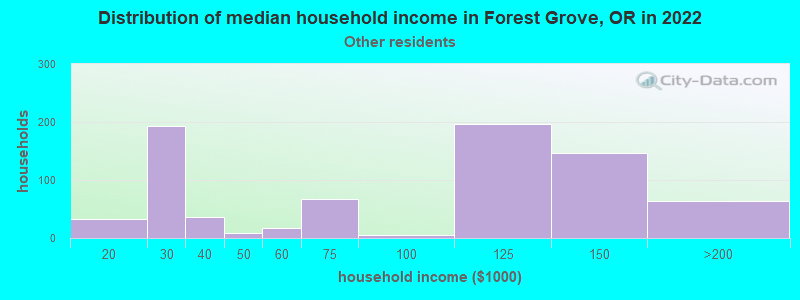
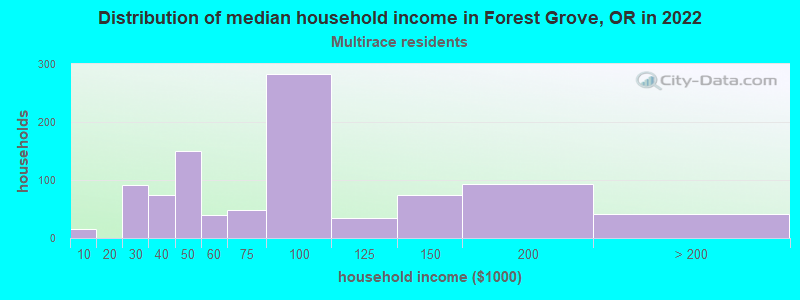
Income and house value in Forest Grove Median household income in 2022 $75,964 White non-Hispanic householders$71,707 American Indian and Alaska Native householders$109,957 Some other race householders$78,671 Two or more races householders$80,804 Hispanic or Latino race householdersMedian 2022 house value $553,132 White Non-Hispanic householders$794,729 American Indian or Alaska Native householders $520,989 Asian householders$495,911 Some other race householders$441,516 Two or more races householders$446,108 Hispanic or Latino householders
Median age by race in Forest Grove
41.7 Median age for White residents39.5 43.1 28.4 Median age for Black or African American residents29.0 17.2 25.4 Median age for American Indian / Alaska Native residents35.1 20.7 26.6 Median age for Asian residents23.9 36.9 -642,169,728.1 Median age for Native Hawaiian / Pacific Islander residents-476,923,076.4 -850,649,349.8 27.0 Median age for Other race residents34.8 21.2 21.5 Median age for Two or more races residents22.8 20.5 43.0 Median age for White alone residents40.8 44.4 23.3 Median age for Hispanic or Latino residents28.3 21.5
Owner/renter occupied households by race in Forest Grove
House owners and renters - White residents 4,747 63.5% Owner occupied2,730 36.5% Renter occupiedHouse owners and renters - Black or African American residents 9 11.7% Owner occupied66 88.3% Renter occupiedHouse owners and renters - American Indian / Alaska Native residents 38 26.2% Owner occupied107 73.8% Renter occupiedHouse owners and renters - Asian residents 92 61.6% Owner occupied58 38.4% Renter occupiedHouse owners and renters - Other race residents 577 76.4% Owner occupied178 23.6% Renter occupiedHouse owners and renters - Two or more races residents 397 48.7% Owner occupied418 51.3% Renter occupiedHouse owners and renters - White alone residents 4,583 63.9% Owner occupied2,586 36.1% Renter occupiedHouse owners and renters - Hispanic or Latino residents 879 52.8% Owner occupied785 47.2% Renter occupied
Language usage in Forest Grove
English speakers - Total 75.0% of residents of Forest Grove speak English at home.
22.8% of residents speak Spanish at home 3,758 66.9% Speak English very well1,861 33.1% Speak English less than very well2.4% of residents speak other language at home 468 80.7% Speak English very well112 19.3% Speak English less than very well
English speakers - Born in the United States 89.9% of residents of Forest Grove speak English at home.
8.5% of residents speak Spanish at home 779 92.0% Speak English very well68 8.0% Speak English less than very well1.7% of residents speak other language at home 159 91.4% Speak English very well15 8.6% Speak English less than very well
English speakers - Native, born elsewhere 58.7% of residents of Forest Grove speak English at home.
33.6% of residents speak Spanish at home 48 100.0% Speak English very well11.9% of residents speak other language at home 17 100.0% Speak English very well
English speakers - Foreign-born 11.2% of residents of Forest Grove speak English at home.
85.7% of residents speak Spanish at home 1,148 42.2% Speak English very well1,571 57.8% Speak English less than very well9.2% of residents speak other language at home 192 66.0% Speak English very well99 34.0% Speak English less than very well
White (Caucasian) - Speak only English Native:
94.7% (15,089)Foreign-born:
22.2% (188)
White (Caucasian) - Speak another language Native:
5.3% (840)Foreign-born:
77.0% (653)
American Indian / Alaska Native - Speak another language Native:
17.4% (30)Foreign-born:
100.0% (7)
Asian - Speak only English Native:
69.8% (293)Foreign-born:
22.8% (52)
Asian - Speak another language Native:
27.4% (115)Foreign-born:
74.8% (171)
Other race - Speak only English Native:
27.8% (651)Foreign-born:
2.9% (36)
Other race - Speak another language Native:
72.6% (1,703)Foreign-born:
97.5% (1,184)
Two or more races - Speak only English Native:
71.1% (1,797)Foreign-born:
9.3% (104)
Two or more races - Speak another language Native:
29.7% (751)Foreign-born:
90.6% (1,010)
White alone - Speak only English Native:
96.6% (14,731)Foreign-born:
68.9% (195)
White alone - Speak another language Native:
3.3% (505)Foreign-born:
31.7% (90)
Hispanic or Latino - Speak only English Native:
41.6% (1,760)Foreign-born:
3.5% (102)
Hispanic or Latino - Speak another language Native:
59.0% (2,496)Foreign-born:
96.8% (2,794)
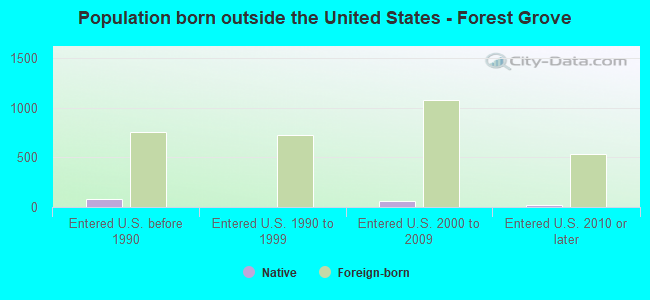
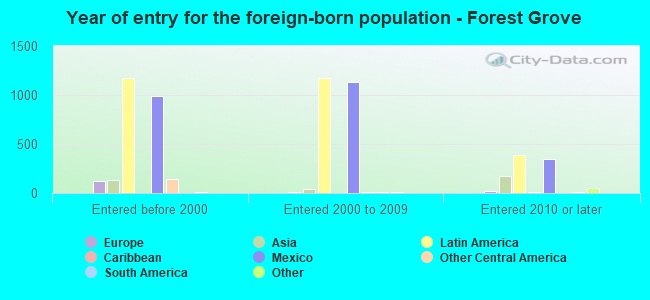
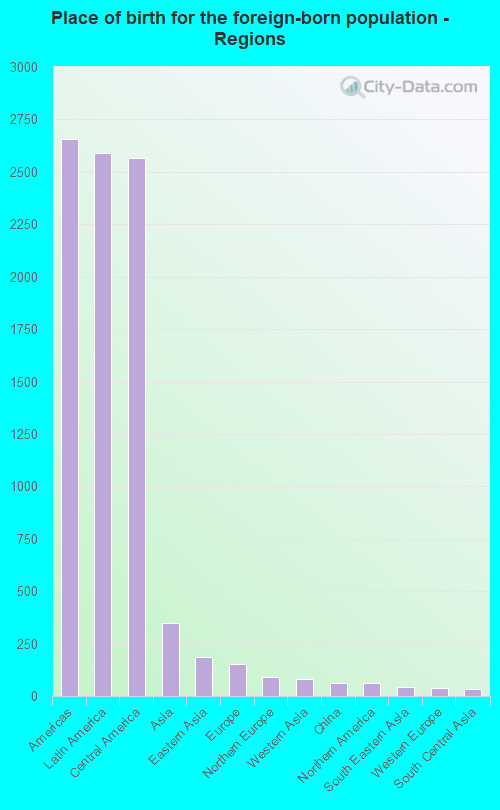
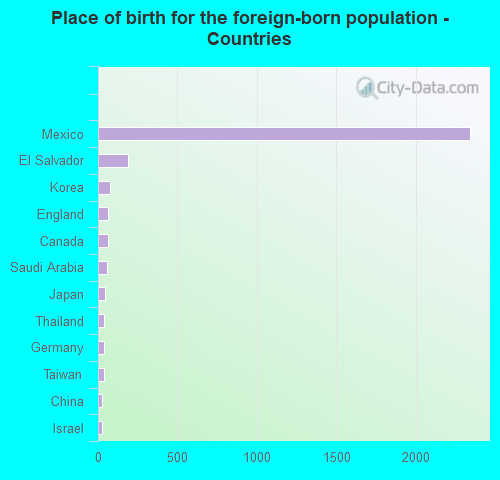
Foreign-born residents in Forest Grove 3,179 residents are foreign born (9.7% Latin America , 1.3% Asia ).
This city:
12.1%Oregon:
9.8%
Marital status for residents in Forest Grove Marital status - White (Caucasian) population 15 years and over
Males 31.6% Never married53.7% Now married0.6% Separated3.5% Widowed10.7% DivorcedFemales 29.3% Never married45.4% Now married1.9% Separated9.3% Widowed14.1% DivorcedWomen who gave birth in the past 12 months Now married:
56.6% (155)Unmarried:
43.4% (119)
Women who did not give birth in the past 12 months Now married:
46.0% (1,959)Unmarried:
54.0% (2,299)
Marital status - Black or African American population 15 years and over
Males 70.1% Never married29.9% Now married0.0% Separated0.0% Widowed0.0% DivorcedFemales 82.5% Never married17.5% Now married0.0% Separated0.0% Widowed0.0% DivorcedWomen who did not give birth in the past 12 months Now married:
18.2% (15)Unmarried:
81.8% (67)
Marital status - American Indian / Alaska Native population 15 years and over
Males 54.8% Never married45.2% Now married0.0% Separated0.0% Widowed0.0% DivorcedFemales 54.5% Never married30.9% Now married0.0% Separated14.5% Widowed0.0% DivorcedWomen who did not give birth in the past 12 months Now married:
28.6% (13)Unmarried:
71.4% (33)
Marital status - Asian population 15 years and over
Males 86.9% Never married13.1% Now married0.0% Separated0.0% Widowed0.0% DivorcedFemales 51.5% Never married33.4% Now married0.0% Separated0.3% Widowed14.7% DivorcedWomen who gave birth in the past 12 months Now married:
100.0% (17)Unmarried:
0.0% (0)
Women who did not give birth in the past 12 months Now married:
32.8% (80)Unmarried:
67.2% (164)
Marital status - Other race population 15 years and over
Males 40.4% Never married45.1% Now married1.1% Separated0.0% Widowed13.4% DivorcedFemales 52.6% Never married41.1% Now married0.0% Separated3.5% Widowed2.9% DivorcedWomen who gave birth in the past 12 months Now married:
100.0% (53)Unmarried:
0.0% (0)
Women who did not give birth in the past 12 months Now married:
36.6% (352)Unmarried:
63.4% (608)
Marital status - Two or more races population 15 years and over
Males 59.8% Never married38.1% Now married0.0% Separated0.9% Widowed1.2% DivorcedFemales 45.6% Never married39.0% Now married0.0% Separated10.0% Widowed5.4% DivorcedWomen who gave birth in the past 12 months Now married:
48.9% (53)Unmarried:
51.1% (55)
Women who did not give birth in the past 12 months Now married:
31.6% (311)Unmarried:
68.4% (675)
Marital status - White alone, not Hispanic / Latino population 15 years and over
Males 31.0% Never married53.5% Now married0.6% Separated3.5% Widowed11.4% DivorcedFemales 28.3% Never married44.4% Now married1.9% Separated10.4% Widowed15.0% DivorcedWomen who gave birth in the past 12 months Now married:
100.0% (157)Unmarried:
0.0% (0)
Women who did not give birth in the past 12 months Now married:
43.5% (1,684)Unmarried:
56.5% (2,185)
Marital status - Hispanic or Latino population 15 years and over
Males 47.6% Never married44.2% Now married0.5% Separated1.1% Widowed6.6% DivorcedFemales 45.0% Never married45.4% Now married0.5% Separated4.4% Widowed4.7% DivorcedWomen who gave birth in the past 12 months Now married:
33.6% (92)Unmarried:
66.4% (182)
Women who did not give birth in the past 12 months Now married:
43.9% (870)Unmarried:
56.1% (1,113)
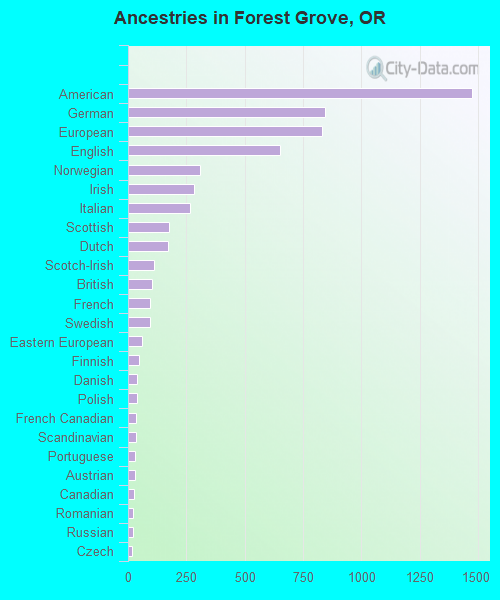
Ancestries in Forest Grove
1,474 11.1% American845 6.4% German831 6.3% European653 4.9% English308 2.3% Norwegian282 2.1% Irish267 2.0% Italian176 1.3% Scottish172 1.3% Dutch111 0.8% Scotch-Irish104 0.8% British96 0.7% French94 0.7% Swedish60 0.5% Eastern European48 0.4% Finnish39 0.3% Danish38 0.3% Polish36 0.3% French Canadian36 0.3% Scandinavian31 0.2% Portuguese29 0.2% Austrian25 0.2% Canadian23 0.2% Romanian20 0.2% Russian17 0.1% Czech17 0.1% Yugoslavian15 0.1% Slavic11 0.08% Belgian11 0.08% Greek10 0.08% Hungarian9 0.07% Slovene8 0.06% New Zealander6 0.05% Swiss5 0.04% Estonian5 0.04% Czechoslovakian4 0.03% Croatian4 0.03% Brazilian3 0.02% South African2 0.02% Ukrainian
Geographical mobility in Forest Grove Same house 1 year ago 15,096 87.6% White (Caucasian)192 71.9% Black or African American240 100.0% American Indian / Alaska Native528 82.1% Asian3,231 90.0% Other race3,449 88.0% Two or more races13,855 86.9% White alone, not Hispanic / Latino7,007 92.0% Hispanic or LatinoMoved within same county 1,152 6.7% White / Caucasian27 4.2% Asian349 9.7% Other race313 8.0% Two or more races1,116 7.0% White alone, not Hispanic / Latino528 6.9% Hispanic or LatinoMoved within same state 479 2.8% White / Caucasian1 0.3% Black or African American22 3.5% Asian100 2.6% Two or more races459 2.9% White alone, not Hispanic / Latino45 0.6% Hispanic or LatinoMoved from different state 393 2.3% White / Caucasian79 29.5% Black or African American47 7.3% Asian16 0.4% Other race6 0.2% Two or more races401 2.5% White alone, not Hispanic / Latino49 0.6% Hispanic or LatinoMoved from abroad 50 0.3% White6 0.9% Asian53 0.3% White alone, not Hispanic / Latino
Children Nativity (place of birth) in Forest Grove
Children under 6 years - Living with two parents Both parents native 973 100.0% NativeBoth parents foreign-born 254 100.0% NativeOne native, one foreign-born parent 97 100.0% NativeChildren under 6 years - Living with one parent Native parent 470 100.0% NativeForeign-born parent 166 100.0% NativeChildren 6 to 17 years - Living with two parents Both parents native 1,719 99.1% Native15 0.9% Foreign-bornBoth parents foreign-born 865 98.2% Native16 1.8% Foreign-bornOne native, one foreign-born parent 364 100.0% NativeChildren 6 to 17 years - Living with one parent Native parent 980 100.0% NativeForeign-born parent 205 51.3% Native194 48.7% Foreign-born
Grandparents responsible for own grandchildren in Forest Grove
Grandparents (30 to 59 years) White / Caucasian 111 62.0% Responsible for grandchildren68 38.0% Not responsible for grandchildrenBlack or African American 21 100.0% Not responsible for grandchildrenOther race 50 100.0% Not responsible for grandchildrenTwo or more races 34 100.0% Not responsible for grandchildrenWhite alone, not Hispanic / Latino 27 100.0% Not responsible for grandchildrenHispanic or Latino 122 54.6% Responsible for grandchildren101 45.4% Not responsible for grandchildren
Grandparents (60 years and over) White / Caucasian 129 100.0% Not responsible for grandchildrenOther race 39 100.0% Not responsible for grandchildrenTwo or more races 60 100.0% Not responsible for grandchildrenWhite alone, not Hispanic / Latino 83 100.0% Not responsible for grandchildrenHispanic or Latino 140 100.0% Not responsible for grandchildren