Races in Fortuna Foothills, Arizona (AZ) Detailed Stats
Data:
Races - White alone (%)
Races - White alone (% change since 2000)
Races - Black alone (%)
Races - Black alone (% change since 2000)
Races - American Indian alone (%)
Races - American Indian alone (% change since 2000)
Races - Asian alone (%)
Races - Asian alone (% change since 2000)
Races - Hispanic (%)
Races - Hispanic (% change since 2000)
Races - Native Hawaiian and Other Pacific Islander alone (%)
Races - Native Hawaiian and Other Pacific Islander alone (% change since 2000)
Races - Two or more races(%)
Races - Two or more races(% change since 2000)
Races - Other race alone (%)
Races - Other race alone (% change since 2000)
Racial diversity
Place of birth - Born in state of residence (%)
Place of birth - Born in state of residence (%) - White
Place of birth - Born in state of residence (%) - Black or African American
Place of birth - Born in state of residence (%) - Asian
Place of birth - Born in state of residence (%) - Hispanic or Latino
Place of birth - Born in state of residence (%) - American Indian and Alaska Native
Place of birth - Born in state of residence (%) - Multirace
Place of birth - Born in state of residence (%) - Other Race
Place of birth - Born in other state (%)
Place of birth - Born in other state (%) - White
Place of birth - Born in other state (%) - Black or African American
Place of birth - Born in other state (%) - Asian
Place of birth - Born in other state (%) - Hispanic or Latino
Place of birth - Born in other state (%) - American Indian and Alaska Native
Place of birth - Born in other state (%) - Multirace
Place of birth - Born in other state (%) - Other Race
Place of birth - Native, outside of US (%)
Place of birth - Native, outside of US (%) - White
Place of birth - Native, outside of US (%) - Black or African American
Place of birth - Native, outside of US (%) - Asian
Place of birth - Native, outside of US (%) - Hispanic or Latino
Place of birth - Native, outside of US (%) - American Indian and Alaska Native
Place of birth - Native, outside of US (%) - Multirace
Place of birth - Native, outside of US (%) - Other Race
Place of birth - Foreign born (%)
Place of birth - Foreign born (%) - White
Place of birth - Foreign born (%) - Black or African American
Place of birth - Foreign born (%) - Asian
Place of birth - Foreign born (%) - Hispanic or Latino
Place of birth - Foreign born (%) - American Indian and Alaska Native
Place of birth - Foreign born (%) - Multirace
Place of birth - Foreign born (%) - Other Race
Residents speaking English at home (%)
Residents speaking English at home - Born in the United States (%)
Residents speaking English at home - Native, born elsewhere (%)
Residents speaking English at home - Foreign born (%)
Residents speaking Spanish at home (%)
Residents speaking Spanish at home - Born in the United States (%)
Residents speaking Spanish at home - Native, born elsewhere (%)
Residents speaking Spanish at home - Foreign born (%)
Residents speaking other language at home (%)
Residents speaking other language at home - Born in the United States (%)
Residents speaking other language at home - Native, born elsewhere (%)
Residents speaking other language at home - Foreign born (%)
Marital status - Never married (%)
Marital status - Now married (%)
Marital status - Separated (%)
Marital status - Widowed (%)
Marital status - Divorced (%)
Ancestries Reported - Arab (%)
Ancestries Reported - Czech (%)
Ancestries Reported - Danish (%)
Ancestries Reported - Dutch (%)
Ancestries Reported - English (%)
Ancestries Reported - French (%)
Ancestries Reported - French Canadian (%)
Ancestries Reported - German (%)
Ancestries Reported - Greek (%)
Ancestries Reported - Hungarian (%)
Ancestries Reported - Irish (%)
Ancestries Reported - Italian (%)
Ancestries Reported - Lithuanian (%)
Ancestries Reported - Norwegian (%)
Ancestries Reported - Polish (%)
Ancestries Reported - Portuguese (%)
Ancestries Reported - Russian (%)
Ancestries Reported - Scotch-Irish (%)
Ancestries Reported - Scottish (%)
Ancestries Reported - Slovak (%)
Ancestries Reported - Subsaharan African (%)
Ancestries Reported - Swedish (%)
Ancestries Reported - Swiss (%)
Ancestries Reported - Ukrainian (%)
Ancestries Reported - United States (%)
Ancestries Reported - Welsh (%)
Ancestries Reported - West Indian (%)
Ancestries Reported - Other (%)
Geographical mobility - Same house 1 year ago (%)
Geographical mobility - Same house 1 year ago (%) - White
Geographical mobility - Same house 1 year ago (%) - Black or African American
Geographical mobility - Same house 1 year ago (%) - Asian
Geographical mobility - Same house 1 year ago (%) - Hispanic or Latino
Geographical mobility - Same house 1 year ago (%) - American Indian and Alaska Native
Geographical mobility - Same house 1 year ago (%) - Multirace
Geographical mobility - Same house 1 year ago (%) - Other Race
Geographical mobility - Moved within same county (%)
Geographical mobility - Moved within same county (%) - White
Geographical mobility - Moved within same county (%) - Black or African American
Geographical mobility - Moved within same county (%) - Asian
Geographical mobility - Moved within same county (%) - Hispanic or Latino
Geographical mobility - Moved within same county (%) - American Indian and Alaska Native
Geographical mobility - Moved within same county (%) - Multirace
Geographical mobility - Moved within same county (%) - Other Race
Geographical mobility - Moved from different county within same state (%)
Geographical mobility - Moved from different county within same state (%) - White
Geographical mobility - Moved from different county within same state (%) - Black or African American
Geographical mobility - Moved from different county within same state (%) - Asian
Geographical mobility - Moved from different county within same state (%) - Hispanic or Latino
Geographical mobility - Moved from different county within same state (%) - American Indian and Alaska Native
Geographical mobility - Moved from different county within same state (%) - Multirace
Geographical mobility - Moved from different county within same state (%) - Other Race
Geographical mobility - Moved from different state (%)
Geographical mobility - Moved from different state (%) - White
Geographical mobility - Moved from different state (%) - Black or African American
Geographical mobility - Moved from different state (%) - Asian
Geographical mobility - Moved from different state (%) - Hispanic or Latino
Geographical mobility - Moved from different state (%) - American Indian and Alaska Native
Geographical mobility - Moved from different state (%) - Multirace
Geographical mobility - Moved from different state (%) - Other Race
Geographical mobility - Moved from abroad (%)
Geographical mobility - Moved from abroad (%) - White
Geographical mobility - Moved from abroad (%) - Black or African American
Geographical mobility - Moved from abroad (%) - Asian
Geographical mobility - Moved from abroad (%) - Hispanic or Latino
Geographical mobility - Moved from abroad (%) - American Indian and Alaska Native
Geographical mobility - Moved from abroad (%) - Multirace
Geographical mobility - Moved from abroad (%) - Other Race
Place of birth for the foreign-born population - Ireland (%)
Place of birth for the foreign-born population - Denmark (%)
Place of birth for the foreign-born population - Norway (%)
Place of birth for the foreign-born population - Sweden (%)
Place of birth for the foreign-born population - United Kingdom (%)
Place of birth for the foreign-born population - England (%)
Place of birth for the foreign-born population - Scotland (%)
Place of birth for the foreign-born population - Other Northern Europe (%)
Place of birth for the foreign-born population - Austria (%)
Place of birth for the foreign-born population - Belgium (%)
Place of birth for the foreign-born population - France (%)
Place of birth for the foreign-born population - Germany (%)
Place of birth for the foreign-born population - Netherlands (%)
Place of birth for the foreign-born population - Switzerland (%)
Place of birth for the foreign-born population - Other Western Europe (%)
Place of birth for the foreign-born population - Greece (%)
Place of birth for the foreign-born population - Italy (%)
Place of birth for the foreign-born population - Portugal (%)
Place of birth for the foreign-born population - Spain (%)
Place of birth for the foreign-born population - Other Southern Europe (%)
Place of birth for the foreign-born population - Albania (%)
Place of birth for the foreign-born population - Belarus (%)
Place of birth for the foreign-born population - Bosnia and Herzegovina (%)
Place of birth for the foreign-born population - Bulgaria (%)
Place of birth for the foreign-born population - Croatia (%)
Place of birth for the foreign-born population - Czechoslovakia (%)
Place of birth for the foreign-born population - Hungary (%)
Place of birth for the foreign-born population - Latvia (%)
Place of birth for the foreign-born population - Lithuania (%)
Place of birth for the foreign-born population - North Macedonia (Macedonia) (%)
Place of birth for the foreign-born population - Moldova (%)
Place of birth for the foreign-born population - Poland (%)
Place of birth for the foreign-born population - Romania (%)
Place of birth for the foreign-born population - Russia (%)
Place of birth for the foreign-born population - Serbia (%)
Place of birth for the foreign-born population - Ukraine (%)
Place of birth for the foreign-born population - Other Eastern Europe (%)
Place of birth for the foreign-born population - China (%)
Place of birth for the foreign-born population - Hong Kong (%)
Place of birth for the foreign-born population - Taiwan (%)
Place of birth for the foreign-born population - Japan (%)
Place of birth for the foreign-born population - Korea (%)
Place of birth for the foreign-born population - Other Eastern Asia (%)
Place of birth for the foreign-born population - Afghanistan (%)
Place of birth for the foreign-born population - Bangladesh (%)
Place of birth for the foreign-born population - India (%)
Place of birth for the foreign-born population - Iran (%)
Place of birth for the foreign-born population - Kazakhstan (%)
Place of birth for the foreign-born population - Nepal (%)
Place of birth for the foreign-born population - Pakistan (%)
Place of birth for the foreign-born population - Sri Lanka (%)
Place of birth for the foreign-born population - Uzbekistan (%)
Place of birth for the foreign-born population - Other South Central Asia (%)
Place of birth for the foreign-born population - Burma (%)
Place of birth for the foreign-born population - Cambodia (%)
Place of birth for the foreign-born population - Indonesia (%)
Place of birth for the foreign-born population - Laos (%)
Place of birth for the foreign-born population - Malaysia (%)
Place of birth for the foreign-born population - Philippines (%)
Place of birth for the foreign-born population - Singapore (%)
Place of birth for the foreign-born population - Thailand (%)
Place of birth for the foreign-born population - Vietnam (%)
Place of birth for the foreign-born population - Other South Eastern Asia (%)
Place of birth for the foreign-born population - Armenia (%)
Place of birth for the foreign-born population - Iraq (%)
Place of birth for the foreign-born population - Israel (%)
Place of birth for the foreign-born population - Jordan (%)
Place of birth for the foreign-born population - Kuwait (%)
Place of birth for the foreign-born population - Lebanon (%)
Place of birth for the foreign-born population - Saudi Arabia (%)
Place of birth for the foreign-born population - Syria (%)
Place of birth for the foreign-born population - Turkey (%)
Place of birth for the foreign-born population - Yemen (%)
Place of birth for the foreign-born population - Other Western Asia (%)
Place of birth for the foreign-born population - Eritrea (%)
Place of birth for the foreign-born population - Ethiopia (%)
Place of birth for the foreign-born population - Kenya (%)
Place of birth for the foreign-born population - Somalia (%)
Place of birth for the foreign-born population - Uganda (%)
Place of birth for the foreign-born population - Zimbabwe (%)
Place of birth for the foreign-born population - Other Eastern Africa (%)
Place of birth for the foreign-born population - Cameroon (%)
Place of birth for the foreign-born population - Congo (%)
Place of birth for the foreign-born population - Democratic Republic of Congo (Zaire) (%)
Place of birth for the foreign-born population - Other Middle Africa (%)
Place of birth for the foreign-born population - Egypt (%)
Place of birth for the foreign-born population - Morocco (%)
Place of birth for the foreign-born population - Sudan (%)
Place of birth for the foreign-born population - Other Northern Africa (%)
Place of birth for the foreign-born population - South Africa (%)
Place of birth for the foreign-born population - Other Southern Africa (%)
Place of birth for the foreign-born population - Cabo Verde (%)
Place of birth for the foreign-born population - Ghana (%)
Place of birth for the foreign-born population - Liberia (%)
Place of birth for the foreign-born population - Nigeria (%)
Place of birth for the foreign-born population - Senegal (%)
Place of birth for the foreign-born population - Sierra Leone (%)
Place of birth for the foreign-born population - Other Western Africa (%)
Place of birth for the foreign-born population - Australia (%)
Place of birth for the foreign-born population - New Zealand (%)
Place of birth for the foreign-born population - Fiji (%)
Place of birth for the foreign-born population - Micronesia (%)
Place of birth for the foreign-born population - Bahamas (%)
Place of birth for the foreign-born population - Barbados (%)
Place of birth for the foreign-born population - Cuba (%)
Place of birth for the foreign-born population - Dominica (%)
Place of birth for the foreign-born population - Dominican Republic (%)
Place of birth for the foreign-born population - Grenada (%)
Place of birth for the foreign-born population - Haiti (%)
Place of birth for the foreign-born population - Jamaica (%)
Place of birth for the foreign-born population - St. Vincent and the Grenadines (%)
Place of birth for the foreign-born population - Trinidad and Tobago (%)
Place of birth for the foreign-born population - West Indies (%)
Place of birth for the foreign-born population - Other Caribbean (%)
Place of birth for the foreign-born population - Belize (%)
Place of birth for the foreign-born population - Costa Rica (%)
Place of birth for the foreign-born population - El Salvador (%)
Place of birth for the foreign-born population - Guatemala (%)
Place of birth for the foreign-born population - Honduras (%)
Place of birth for the foreign-born population - Mexico (%)
Place of birth for the foreign-born population - Nicaragua (%)
Place of birth for the foreign-born population - Panama (%)
Place of birth for the foreign-born population - Other Central America (%)
Place of birth for the foreign-born population - Argentina (%)
Place of birth for the foreign-born population - Bolivia (%)
Place of birth for the foreign-born population - Brazil (%)
Place of birth for the foreign-born population - Chile (%)
Place of birth for the foreign-born population - Colombia (%)
Place of birth for the foreign-born population - Ecuador (%)
Place of birth for the foreign-born population - Guyana (%)
Place of birth for the foreign-born population - Peru (%)
Place of birth for the foreign-born population - Uruguay (%)
Place of birth for the foreign-born population - Venezuela (%)
Place of birth for the foreign-born population - Other South America (%)
Place of birth for the foreign-born population - Canada (%)
Place of birth for the foreign-born population - Other Northern America (%)
Place of birth for the foreign-born population - Other (%)
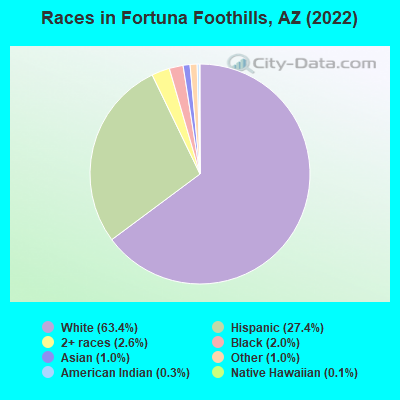
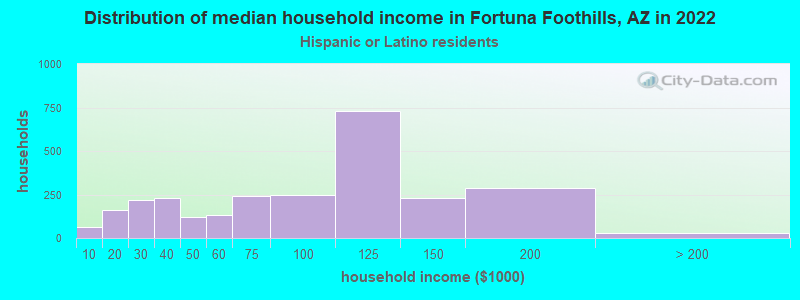
According to 2022 data, the most numerous races in Fortuna Foothills, AZ are White alone (19,780 residents), Hispanic (8,800 residents), and Black alone (321 residents). 82.6% of Fortuna Foothills residents speak English at home. 12.4% of Fortuna Foothills, AZ residents are foreign-born (6.4% born in Latin America, 4.5% born in North America), which is 4.5% less than the foreign-born rate of 13.0% across the entire state of Arizona.
Race distribution in Fortuna Foothills
2000 2022
3,274,258 63.8% White alone 1,295,617 25.3% Hispanic 233,370 4.5% American Indian alone 149,941 2.9% Black alone 89,315 1.7% Asian alone 76,372 1.5% Two or more races 6,120 0.1% Other race alone 5,639 0.1% Native Hawaiian and Other
3,814,587 51.8% White alone 2,388,520 32.5% Hispanic 322,459 4.4% Black alone 284,994 3.9% Two or more races 257,020 3.5% Asian alone 241,688 3.3% American Indian alone 36,042 0.5% Other race alone 13,887 0.2% Native Hawaiian and Other
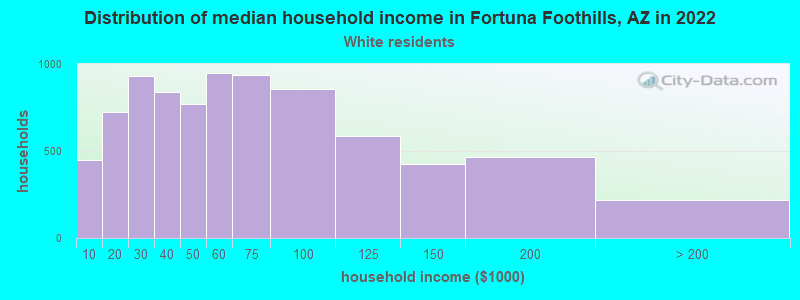
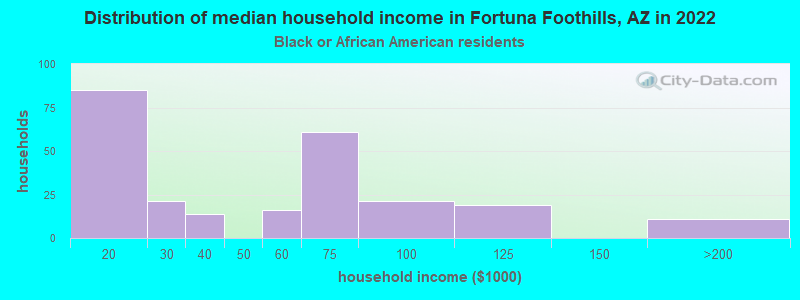
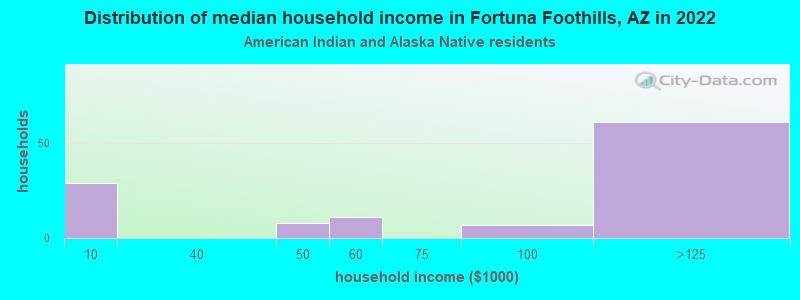
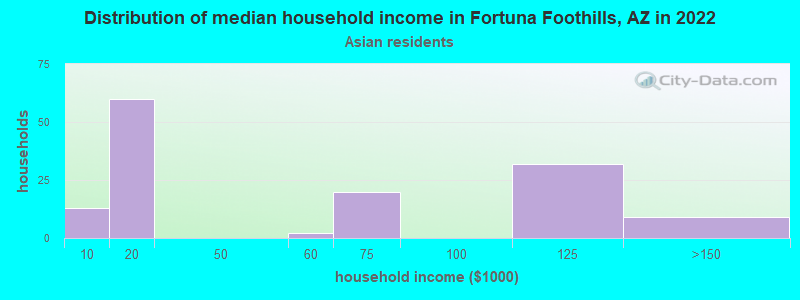
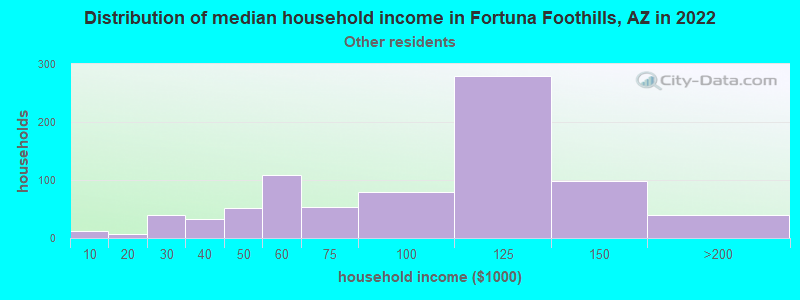
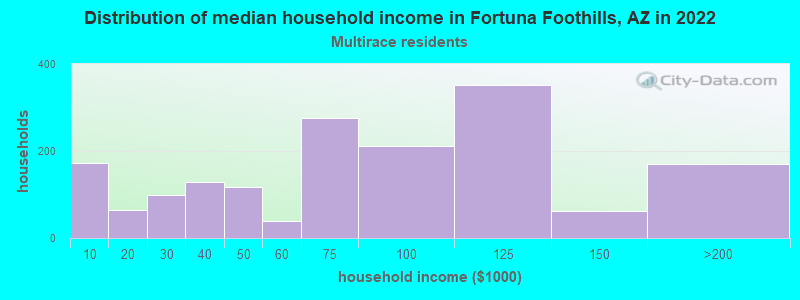
Income and house value in Fortuna Foothills Median household income in 2022 $53,509 White non-Hispanic householders$60,401 Black householders$96,191 American Indian and Alaska Native householders$106,402 Asian householders$130,945 Native Hawaiian and other Pacific Islander householders$83,697 Some other race householders$128,801 Two or more races householders$90,930 Hispanic or Latino race householdersMedian 2022 house value $418,632 White Non-Hispanic householdersover $1,000,000 Black or African American householders$657,587 American Indian or Alaska Native householders $338,734 Asian householders$598,308 Native Hawaiian and other Pacific Islander householders$319,220 Some other race householders$231,223 Two or more races householders$364,508 Hispanic or Latino householders
Median age by race in Fortuna Foothills
66.6 Median age for White residents65.7 65.7 57.5 Median age for Black or African American residents64.5 39.6 42.9 Median age for American Indian / Alaska Native residents27.6 49.9 45.5 Median age for Asian residents38.2 46.6 36.7 Median age for Other race residents28.5 37.4 42.5 Median age for Two or more races residents45.3 22.3 73.0 Median age for White alone residents72.7 71.7 30.9 Median age for Hispanic or Latino residents29.1 32.0
Owner/renter occupied households by race in Fortuna Foothills
House owners and renters - White residents 11,324 83.9% Owner occupied2,169 16.1% Renter occupiedHouse owners and renters - Black or African American residents 64 31.5% Owner occupied139 68.5% Renter occupiedHouse owners and renters - American Indian / Alaska Native residents 80 56.1% Owner occupied63 43.9% Renter occupiedHouse owners and renters - Asian residents 141 75.0% Owner occupied47 25.0% Renter occupiedHouse owners and renters - Other race residents 546 70.2% Owner occupied232 29.8% Renter occupiedHouse owners and renters - Two or more races residents 433 58.0% Owner occupied313 42.0% Renter occupiedHouse owners and renters - White alone residents 9,599 86.3% Owner occupied1,529 13.7% Renter occupiedHouse owners and renters - Hispanic or Latino residents 1,818 67.0% Owner occupied895 33.0% Renter occupied
Language usage in Fortuna Foothills
English speakers - Total 82.6% of residents of Fortuna Foothills speak English at home.
16.3% of residents speak Spanish at home 3,885 81.1% Speak English very well903 18.9% Speak English less than very well1.6% of residents speak other language at home 404 87.6% Speak English very well57 12.4% Speak English less than very well
English speakers - Born in the United States 91.8% of residents of Fortuna Foothills speak English at home.
7.9% of residents speak Spanish at home 1,427 91.6% Speak English very well131 8.4% Speak English less than very well0.3% of residents speak other language at home 42 60.9% Speak English very well27 39.1% Speak English less than very well
English speakers - Native, born elsewhere 21.4% of residents of Fortuna Foothills speak English at home.
71.5% of residents speak Spanish at home 201 100.0% Speak English very well5.3% of residents speak other language at home 15 100.0% Speak English very well
English speakers - Foreign-born 52.7% of residents of Fortuna Foothills speak English at home.
43.2% of residents speak Spanish at home 999 61.9% Speak English very well614 38.1% Speak English less than very well7.4% of residents speak other language at home 261 94.2% Speak English very well16 5.8% Speak English less than very well
White (Caucasian) - Speak only English Native:
85.8% (19,210)Foreign-born:
81.2% (1,961)
White (Caucasian) - Speak another language Native:
8.2% (1,831)Foreign-born:
38.0% (917)
Black or African American - Speak only English Native:
98.8% (378)Foreign-born:
95.6% (58)
Black or African American - Speak another language Native:
1.7% (7)Foreign-born:
20.9% (13)
American Indian / Alaska Native - Speak only English Native:
98.2% (538)Foreign-born:
11.3% (7)
American Indian / Alaska Native - Speak another language Native:
4.6% (25)Foreign-born:
86.9% (50)
Asian - Speak only English Native:
22.6% (44)Foreign-born:
39.0% (74)
Asian - Speak another language Native:
41.9% (82)Foreign-born:
52.1% (98)
Other race - Speak only English Native:
47.0% (788)Foreign-born:
25.0% (112)
Other race - Speak another language Native:
53.7% (901)Foreign-born:
84.0% (375)
Two or more races - Speak another language Native:
33.1% (785)Foreign-born:
100.0% (240)
White alone - Speak only English Native:
98.9% (17,807)Foreign-born:
83.0% (1,233)
White alone - Speak another language Native:
1.3% (232)Foreign-born:
13.5% (200)
Hispanic or Latino - Speak only English Native:
46.8% (2,897)Foreign-born:
22.8% (421)
Hispanic or Latino - Speak another language Native:
51.6% (3,190)Foreign-born:
83.5% (1,543)
Foreign-born residents in Fortuna Foothills 3,869 residents are foreign born (6.4% Latin America , 4.5% North America ).
This city:
12.4%Arizona:
100.0%
Marital status for residents in Fortuna Foothills Marital status - White (Caucasian) population 15 years and over
Males 15.1% Never married67.4% Now married1.5% Separated6.0% Widowed10.1% DivorcedFemales 10.6% Never married61.4% Now married0.6% Separated17.0% Widowed10.4% DivorcedWomen who gave birth in the past 12 months Now married:
92.3% (223)Unmarried:
7.7% (19)
Women who did not give birth in the past 12 months Now married:
51.7% (1,433)Unmarried:
48.3% (1,341)
Marital status - Black or African American population 15 years and over
Males 61.0% Never married32.6% Now married0.0% Separated0.0% Widowed6.4% DivorcedFemales 12.8% Never married47.9% Now married0.0% Separated0.0% Widowed39.4% DivorcedWomen who gave birth in the past 12 months Now married:
100.0% (53)Unmarried:
0.0% (0)
Women who did not give birth in the past 12 months Now married:
22.2% (16)Unmarried:
77.8% (55)
Marital status - American Indian / Alaska Native population 15 years and over
Males 54.1% Never married27.9% Now married0.0% Separated0.0% Widowed18.0% DivorcedFemales 5.1% Never married58.0% Now married36.9% Separated0.0% Widowed0.0% DivorcedWomen who did not give birth in the past 12 months Now married:
82.6% (37)Unmarried:
17.4% (8)
Marital status - Asian population 15 years and over
Males 62.1% Never married34.5% Now married0.0% Separated3.4% Widowed0.0% DivorcedFemales 10.1% Never married68.1% Now married0.0% Separated15.2% Widowed6.5% DivorcedWomen who did not give birth in the past 12 months Now married:
75.0% (70)Unmarried:
25.0% (23)
Marital status - Native Hawaiian / Pacific Islander population 15 years and over
Males 100.0% Never married0.0% Now married0.0% Separated0.0% Widowed0.0% DivorcedFemales 0.0% Never married100.0% Now married0.0% Separated0.0% Widowed0.0% DivorcedMarital status - Other race population 15 years and over
Males 27.8% Never married59.3% Now married0.0% Separated3.7% Widowed9.2% DivorcedFemales 18.8% Never married63.3% Now married0.0% Separated8.1% Widowed9.7% DivorcedWomen who gave birth in the past 12 months Now married:
79.3% (82)Unmarried:
20.7% (21)
Women who did not give birth in the past 12 months Now married:
55.1% (207)Unmarried:
44.9% (169)
Marital status - Two or more races population 15 years and over
Males 4.4% Never married68.5% Now married10.4% Separated0.0% Widowed16.7% DivorcedFemales 26.0% Never married42.0% Now married0.0% Separated16.8% Widowed15.3% DivorcedWomen who did not give birth in the past 12 months Now married:
34.6% (79)Unmarried:
65.4% (148)
Marital status - White alone, not Hispanic / Latino population 15 years and over
Males 10.8% Never married69.9% Now married1.6% Separated6.8% Widowed11.0% DivorcedFemales 6.9% Never married62.7% Now married0.4% Separated19.3% Widowed10.6% DivorcedWomen who gave birth in the past 12 months Now married:
94.1% (150)Unmarried:
5.9% (9)
Women who did not give birth in the past 12 months Now married:
54.6% (762)Unmarried:
45.4% (633)
Marital status - Hispanic or Latino population 15 years and over
Males 37.3% Never married52.4% Now married0.6% Separated2.1% Widowed7.5% DivorcedFemales 26.3% Never married55.8% Now married3.3% Separated5.2% Widowed9.3% DivorcedWomen who gave birth in the past 12 months Now married:
82.2% (150)Unmarried:
17.8% (32)
Women who did not give birth in the past 12 months Now married:
50.5% (871)Unmarried:
49.5% (853)
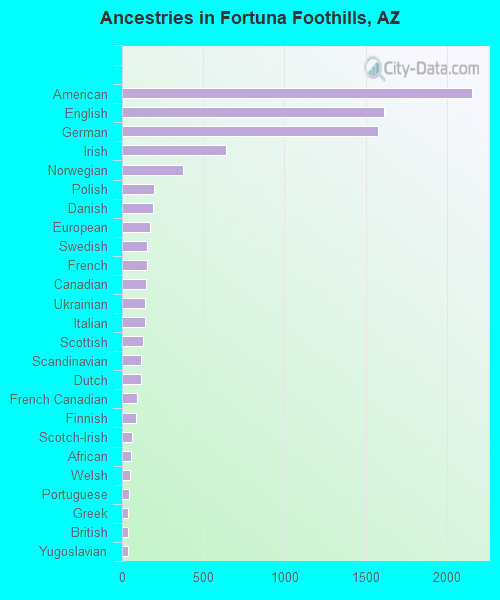
Ancestries in Fortuna Foothills
2,833 16.7% American1,942 11.5% English1,754 10.4% German521 3.1% Irish432 2.6% European375 2.2% Norwegian279 1.6% Canadian211 1.2% Scottish187 1.1% Swedish181 1.1% Scandinavian180 1.1% Italian128 0.8% French127 0.7% Polish125 0.7% Danish122 0.7% Dutch112 0.7% Scotch-Irish86 0.5% French Canadian62 0.4% Ukrainian56 0.3% Finnish54 0.3% Portuguese43 0.3% Trinidadian and Tobagonian40 0.2% Swiss36 0.2% Greek35 0.2% Welsh32 0.2% British32 0.2% Romanian28 0.2% Lithuanian26 0.2% Croatian23 0.1% Yugoslavian22 0.1% Russian17 0.1% Hungarian16 0.09% Slovak16 0.09% Barbadian15 0.09% Belgian15 0.09% Eastern European12 0.07% Brazilian11 0.06% South African8 0.05% Basque7 0.04% Slavic6 0.04% Czech
Geographical mobility in Fortuna Foothills Same house 1 year ago 22,418 86.0% White (Caucasian)450 100.0% Black or African American525 88.5% American Indian / Alaska Native429 96.6% Asian24 97.4% Native Hawaiian / Pacific Islander1,864 86.5% Other race2,325 82.2% Two or more races16,593 83.7% White alone, not Hispanic / Latino7,108 86.1% Hispanic or LatinoMoved within same county 886 3.4% White / Caucasian20 3.3% American Indian / Alaska Native210 9.7% Other race57 2.0% Two or more races792 4.0% White alone, not Hispanic / Latino673 8.2% Hispanic or LatinoMoved within same state 445 1.7% White / Caucasian29 4.8% American Indian / Alaska Native316 11.2% Two or more races312 1.6% White alone, not Hispanic / Latino145 1.8% Hispanic or LatinoMoved from different state 1,845 7.1% White / Caucasian10 2.3% Black or African American23 3.9% American Indian / Alaska Native19 4.2% Asian76 3.5% Other race107 3.8% Two or more races1,800 9.1% White alone, not Hispanic / Latino224 2.7% Hispanic or LatinoMoved from abroad 847 3.2% White6 1.0% American Indian / Alaska Native377 1.9% White alone, not Hispanic / Latino139 1.7% Hispanic or Latino
Children Nativity (place of birth) in Fortuna Foothills
Children under 6 years - Living with two parents Both parents native 537 100.0% NativeBoth parents foreign-born 11 100.0% NativeOne native, one foreign-born parent 485 100.0% NativeChildren under 6 years - Living with one parent Native parent 296 100.0% NativeForeign-born parent 24 100.0% NativeChildren 6 to 17 years - Living with two parents Both parents native 1,267 100.0% NativeBoth parents foreign-born 267 83.1% Native54 16.9% Foreign-bornOne native, one foreign-born parent 374 100.0% NativeChildren 6 to 17 years - Living with one parent Native parent 780 100.0% NativeForeign-born parent 209 50.3% Native206 49.7% Foreign-born
Grandparents responsible for own grandchildren in Fortuna Foothills
Grandparents (30 to 59 years) White / Caucasian 71 61.5% Responsible for grandchildren45 38.5% Not responsible for grandchildrenAmerican Indian / Alaska Native 26 100.0% Not responsible for grandchildrenWhite alone, not Hispanic / Latino 64 84.4% Responsible for grandchildren12 15.6% Not responsible for grandchildrenHispanic or Latino 22 32.5% Responsible for grandchildren45 67.5% Not responsible for grandchildrenGrandparents (60 years and over) White / Caucasian 22 15.9% Responsible for grandchildren117 84.1% Not responsible for grandchildrenWhite alone, not Hispanic / Latino 52 28.3% Responsible for grandchildren130 71.7% Not responsible for grandchildrenHispanic or Latino 5 100.0% Responsible for grandchildren