Races in Four Corners, Florida (FL) Detailed Stats
Data:
Races - White alone (%)
Races - White alone (% change since 2000)
Races - Black alone (%)
Races - Black alone (% change since 2000)
Races - American Indian alone (%)
Races - American Indian alone (% change since 2000)
Races - Asian alone (%)
Races - Asian alone (% change since 2000)
Races - Hispanic (%)
Races - Hispanic (% change since 2000)
Races - Native Hawaiian and Other Pacific Islander alone (%)
Races - Native Hawaiian and Other Pacific Islander alone (% change since 2000)
Races - Two or more races(%)
Races - Two or more races(% change since 2000)
Races - Other race alone (%)
Races - Other race alone (% change since 2000)
Racial diversity
Place of birth - Born in state of residence (%)
Place of birth - Born in state of residence (%) - White
Place of birth - Born in state of residence (%) - Black or African American
Place of birth - Born in state of residence (%) - Asian
Place of birth - Born in state of residence (%) - Hispanic or Latino
Place of birth - Born in state of residence (%) - American Indian and Alaska Native
Place of birth - Born in state of residence (%) - Multirace
Place of birth - Born in state of residence (%) - Other Race
Place of birth - Born in other state (%)
Place of birth - Born in other state (%) - White
Place of birth - Born in other state (%) - Black or African American
Place of birth - Born in other state (%) - Asian
Place of birth - Born in other state (%) - Hispanic or Latino
Place of birth - Born in other state (%) - American Indian and Alaska Native
Place of birth - Born in other state (%) - Multirace
Place of birth - Born in other state (%) - Other Race
Place of birth - Native, outside of US (%)
Place of birth - Native, outside of US (%) - White
Place of birth - Native, outside of US (%) - Black or African American
Place of birth - Native, outside of US (%) - Asian
Place of birth - Native, outside of US (%) - Hispanic or Latino
Place of birth - Native, outside of US (%) - American Indian and Alaska Native
Place of birth - Native, outside of US (%) - Multirace
Place of birth - Native, outside of US (%) - Other Race
Place of birth - Foreign born (%)
Place of birth - Foreign born (%) - White
Place of birth - Foreign born (%) - Black or African American
Place of birth - Foreign born (%) - Asian
Place of birth - Foreign born (%) - Hispanic or Latino
Place of birth - Foreign born (%) - American Indian and Alaska Native
Place of birth - Foreign born (%) - Multirace
Place of birth - Foreign born (%) - Other Race
Residents speaking English at home (%)
Residents speaking English at home - Born in the United States (%)
Residents speaking English at home - Native, born elsewhere (%)
Residents speaking English at home - Foreign born (%)
Residents speaking Spanish at home (%)
Residents speaking Spanish at home - Born in the United States (%)
Residents speaking Spanish at home - Native, born elsewhere (%)
Residents speaking Spanish at home - Foreign born (%)
Residents speaking other language at home (%)
Residents speaking other language at home - Born in the United States (%)
Residents speaking other language at home - Native, born elsewhere (%)
Residents speaking other language at home - Foreign born (%)
Marital status - Never married (%)
Marital status - Now married (%)
Marital status - Separated (%)
Marital status - Widowed (%)
Marital status - Divorced (%)
Ancestries Reported - Arab (%)
Ancestries Reported - Czech (%)
Ancestries Reported - Danish (%)
Ancestries Reported - Dutch (%)
Ancestries Reported - English (%)
Ancestries Reported - French (%)
Ancestries Reported - French Canadian (%)
Ancestries Reported - German (%)
Ancestries Reported - Greek (%)
Ancestries Reported - Hungarian (%)
Ancestries Reported - Irish (%)
Ancestries Reported - Italian (%)
Ancestries Reported - Lithuanian (%)
Ancestries Reported - Norwegian (%)
Ancestries Reported - Polish (%)
Ancestries Reported - Portuguese (%)
Ancestries Reported - Russian (%)
Ancestries Reported - Scotch-Irish (%)
Ancestries Reported - Scottish (%)
Ancestries Reported - Slovak (%)
Ancestries Reported - Subsaharan African (%)
Ancestries Reported - Swedish (%)
Ancestries Reported - Swiss (%)
Ancestries Reported - Ukrainian (%)
Ancestries Reported - United States (%)
Ancestries Reported - Welsh (%)
Ancestries Reported - West Indian (%)
Ancestries Reported - Other (%)
Geographical mobility - Same house 1 year ago (%)
Geographical mobility - Same house 1 year ago (%) - White
Geographical mobility - Same house 1 year ago (%) - Black or African American
Geographical mobility - Same house 1 year ago (%) - Asian
Geographical mobility - Same house 1 year ago (%) - Hispanic or Latino
Geographical mobility - Same house 1 year ago (%) - American Indian and Alaska Native
Geographical mobility - Same house 1 year ago (%) - Multirace
Geographical mobility - Same house 1 year ago (%) - Other Race
Geographical mobility - Moved within same county (%)
Geographical mobility - Moved within same county (%) - White
Geographical mobility - Moved within same county (%) - Black or African American
Geographical mobility - Moved within same county (%) - Asian
Geographical mobility - Moved within same county (%) - Hispanic or Latino
Geographical mobility - Moved within same county (%) - American Indian and Alaska Native
Geographical mobility - Moved within same county (%) - Multirace
Geographical mobility - Moved within same county (%) - Other Race
Geographical mobility - Moved from different county within same state (%)
Geographical mobility - Moved from different county within same state (%) - White
Geographical mobility - Moved from different county within same state (%) - Black or African American
Geographical mobility - Moved from different county within same state (%) - Asian
Geographical mobility - Moved from different county within same state (%) - Hispanic or Latino
Geographical mobility - Moved from different county within same state (%) - American Indian and Alaska Native
Geographical mobility - Moved from different county within same state (%) - Multirace
Geographical mobility - Moved from different county within same state (%) - Other Race
Geographical mobility - Moved from different state (%)
Geographical mobility - Moved from different state (%) - White
Geographical mobility - Moved from different state (%) - Black or African American
Geographical mobility - Moved from different state (%) - Asian
Geographical mobility - Moved from different state (%) - Hispanic or Latino
Geographical mobility - Moved from different state (%) - American Indian and Alaska Native
Geographical mobility - Moved from different state (%) - Multirace
Geographical mobility - Moved from different state (%) - Other Race
Geographical mobility - Moved from abroad (%)
Geographical mobility - Moved from abroad (%) - White
Geographical mobility - Moved from abroad (%) - Black or African American
Geographical mobility - Moved from abroad (%) - Asian
Geographical mobility - Moved from abroad (%) - Hispanic or Latino
Geographical mobility - Moved from abroad (%) - American Indian and Alaska Native
Geographical mobility - Moved from abroad (%) - Multirace
Geographical mobility - Moved from abroad (%) - Other Race
Place of birth for the foreign-born population - Ireland (%)
Place of birth for the foreign-born population - Denmark (%)
Place of birth for the foreign-born population - Norway (%)
Place of birth for the foreign-born population - Sweden (%)
Place of birth for the foreign-born population - United Kingdom (%)
Place of birth for the foreign-born population - England (%)
Place of birth for the foreign-born population - Scotland (%)
Place of birth for the foreign-born population - Other Northern Europe (%)
Place of birth for the foreign-born population - Austria (%)
Place of birth for the foreign-born population - Belgium (%)
Place of birth for the foreign-born population - France (%)
Place of birth for the foreign-born population - Germany (%)
Place of birth for the foreign-born population - Netherlands (%)
Place of birth for the foreign-born population - Switzerland (%)
Place of birth for the foreign-born population - Other Western Europe (%)
Place of birth for the foreign-born population - Greece (%)
Place of birth for the foreign-born population - Italy (%)
Place of birth for the foreign-born population - Portugal (%)
Place of birth for the foreign-born population - Spain (%)
Place of birth for the foreign-born population - Other Southern Europe (%)
Place of birth for the foreign-born population - Albania (%)
Place of birth for the foreign-born population - Belarus (%)
Place of birth for the foreign-born population - Bosnia and Herzegovina (%)
Place of birth for the foreign-born population - Bulgaria (%)
Place of birth for the foreign-born population - Croatia (%)
Place of birth for the foreign-born population - Czechoslovakia (%)
Place of birth for the foreign-born population - Hungary (%)
Place of birth for the foreign-born population - Latvia (%)
Place of birth for the foreign-born population - Lithuania (%)
Place of birth for the foreign-born population - North Macedonia (Macedonia) (%)
Place of birth for the foreign-born population - Moldova (%)
Place of birth for the foreign-born population - Poland (%)
Place of birth for the foreign-born population - Romania (%)
Place of birth for the foreign-born population - Russia (%)
Place of birth for the foreign-born population - Serbia (%)
Place of birth for the foreign-born population - Ukraine (%)
Place of birth for the foreign-born population - Other Eastern Europe (%)
Place of birth for the foreign-born population - China (%)
Place of birth for the foreign-born population - Hong Kong (%)
Place of birth for the foreign-born population - Taiwan (%)
Place of birth for the foreign-born population - Japan (%)
Place of birth for the foreign-born population - Korea (%)
Place of birth for the foreign-born population - Other Eastern Asia (%)
Place of birth for the foreign-born population - Afghanistan (%)
Place of birth for the foreign-born population - Bangladesh (%)
Place of birth for the foreign-born population - India (%)
Place of birth for the foreign-born population - Iran (%)
Place of birth for the foreign-born population - Kazakhstan (%)
Place of birth for the foreign-born population - Nepal (%)
Place of birth for the foreign-born population - Pakistan (%)
Place of birth for the foreign-born population - Sri Lanka (%)
Place of birth for the foreign-born population - Uzbekistan (%)
Place of birth for the foreign-born population - Other South Central Asia (%)
Place of birth for the foreign-born population - Burma (%)
Place of birth for the foreign-born population - Cambodia (%)
Place of birth for the foreign-born population - Indonesia (%)
Place of birth for the foreign-born population - Laos (%)
Place of birth for the foreign-born population - Malaysia (%)
Place of birth for the foreign-born population - Philippines (%)
Place of birth for the foreign-born population - Singapore (%)
Place of birth for the foreign-born population - Thailand (%)
Place of birth for the foreign-born population - Vietnam (%)
Place of birth for the foreign-born population - Other South Eastern Asia (%)
Place of birth for the foreign-born population - Armenia (%)
Place of birth for the foreign-born population - Iraq (%)
Place of birth for the foreign-born population - Israel (%)
Place of birth for the foreign-born population - Jordan (%)
Place of birth for the foreign-born population - Kuwait (%)
Place of birth for the foreign-born population - Lebanon (%)
Place of birth for the foreign-born population - Saudi Arabia (%)
Place of birth for the foreign-born population - Syria (%)
Place of birth for the foreign-born population - Turkey (%)
Place of birth for the foreign-born population - Yemen (%)
Place of birth for the foreign-born population - Other Western Asia (%)
Place of birth for the foreign-born population - Eritrea (%)
Place of birth for the foreign-born population - Ethiopia (%)
Place of birth for the foreign-born population - Kenya (%)
Place of birth for the foreign-born population - Somalia (%)
Place of birth for the foreign-born population - Uganda (%)
Place of birth for the foreign-born population - Zimbabwe (%)
Place of birth for the foreign-born population - Other Eastern Africa (%)
Place of birth for the foreign-born population - Cameroon (%)
Place of birth for the foreign-born population - Congo (%)
Place of birth for the foreign-born population - Democratic Republic of Congo (Zaire) (%)
Place of birth for the foreign-born population - Other Middle Africa (%)
Place of birth for the foreign-born population - Egypt (%)
Place of birth for the foreign-born population - Morocco (%)
Place of birth for the foreign-born population - Sudan (%)
Place of birth for the foreign-born population - Other Northern Africa (%)
Place of birth for the foreign-born population - South Africa (%)
Place of birth for the foreign-born population - Other Southern Africa (%)
Place of birth for the foreign-born population - Cabo Verde (%)
Place of birth for the foreign-born population - Ghana (%)
Place of birth for the foreign-born population - Liberia (%)
Place of birth for the foreign-born population - Nigeria (%)
Place of birth for the foreign-born population - Senegal (%)
Place of birth for the foreign-born population - Sierra Leone (%)
Place of birth for the foreign-born population - Other Western Africa (%)
Place of birth for the foreign-born population - Australia (%)
Place of birth for the foreign-born population - New Zealand (%)
Place of birth for the foreign-born population - Fiji (%)
Place of birth for the foreign-born population - Micronesia (%)
Place of birth for the foreign-born population - Bahamas (%)
Place of birth for the foreign-born population - Barbados (%)
Place of birth for the foreign-born population - Cuba (%)
Place of birth for the foreign-born population - Dominica (%)
Place of birth for the foreign-born population - Dominican Republic (%)
Place of birth for the foreign-born population - Grenada (%)
Place of birth for the foreign-born population - Haiti (%)
Place of birth for the foreign-born population - Jamaica (%)
Place of birth for the foreign-born population - St. Vincent and the Grenadines (%)
Place of birth for the foreign-born population - Trinidad and Tobago (%)
Place of birth for the foreign-born population - West Indies (%)
Place of birth for the foreign-born population - Other Caribbean (%)
Place of birth for the foreign-born population - Belize (%)
Place of birth for the foreign-born population - Costa Rica (%)
Place of birth for the foreign-born population - El Salvador (%)
Place of birth for the foreign-born population - Guatemala (%)
Place of birth for the foreign-born population - Honduras (%)
Place of birth for the foreign-born population - Mexico (%)
Place of birth for the foreign-born population - Nicaragua (%)
Place of birth for the foreign-born population - Panama (%)
Place of birth for the foreign-born population - Other Central America (%)
Place of birth for the foreign-born population - Argentina (%)
Place of birth for the foreign-born population - Bolivia (%)
Place of birth for the foreign-born population - Brazil (%)
Place of birth for the foreign-born population - Chile (%)
Place of birth for the foreign-born population - Colombia (%)
Place of birth for the foreign-born population - Ecuador (%)
Place of birth for the foreign-born population - Guyana (%)
Place of birth for the foreign-born population - Peru (%)
Place of birth for the foreign-born population - Uruguay (%)
Place of birth for the foreign-born population - Venezuela (%)
Place of birth for the foreign-born population - Other South America (%)
Place of birth for the foreign-born population - Canada (%)
Place of birth for the foreign-born population - Other Northern America (%)
Place of birth for the foreign-born population - Other (%)
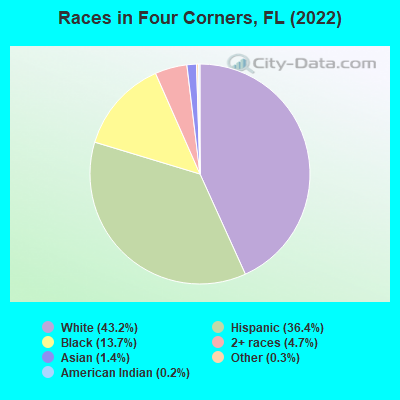
According to 2022 data, the most numerous races in Four Corners, FL are White alone (33,479 residents), Hispanic (28,208 residents), and Black alone (10,598 residents). 63.8% of Four Corners residents speak English at home.
Race distribution in Four Corners 33,479 43.2% White alone 28,208 36.4% Hispanic 10,598 13.7% Black alone 3,670 4.7% Two or more races 1,070 1.4% Asian alone 246 0.3% Other race alone 159 0.2% American Indian alone
2000 2022
10,458,509 65.4% White alone 2,682,715 16.8% Hispanic 2,264,268 14.2% Black alone 261,693 1.6% Asian alone 236,954 1.5% Two or more races 42,358 0.3% American Indian alone 28,994 0.2% Other race alone 6,887 0.04% Native Hawaiian and Other
11,309,403 50.8% White alone 6,025,039 27.1% Hispanic 3,241,015 14.6% Black alone 861,630 3.9% Two or more races 623,692 2.8% Asian alone 152,054 0.7% Other race alone 22,504 0.1% American Indian alone 9,486 0.04% Native Hawaiian and Other
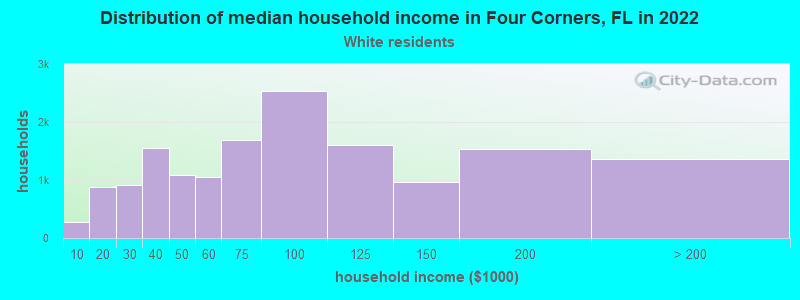
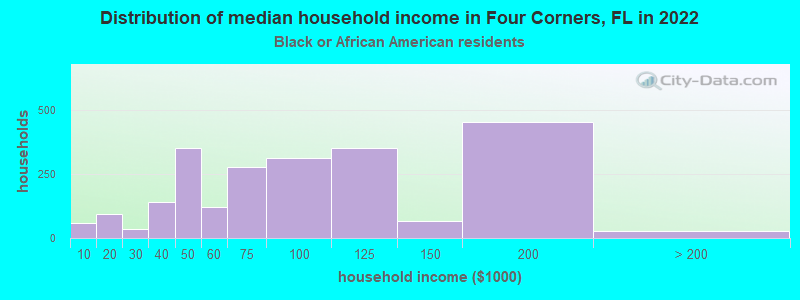
Income and house value in Four Corners Median household income in 2022 $81,611 White non-Hispanic householders$89,766 Black householders$81,822 Asian householders$65,739 Some other race householders$73,634 Two or more races householders$73,257 Hispanic or Latino race householders
Median age by race in Four Corners
35.3 Median age for White residents34.2 36.2 29.0 Median age for Black or African American residents35.4 28.7 25.9 Median age for American Indian / Alaska Native residents-666,666,666.0 -666,666,666.0 47.4 Median age for Asian residents34.7 47.5 -666,666,666.0 Median age for Native Hawaiian / Pacific Islander residents-666,666,666.0 -666,666,666.0 40.3 Median age for Other race residents39.9 41.2 27.4 Median age for Two or more races residents28.1 26.3 36.0 Median age for White alone residents35.0 36.5 33.4 Median age for Hispanic or Latino residents36.6 30.7
Owner/renter occupied households by race in Four Corners
House owners and renters - White residents 8,826 57.1% Owner occupied6,634 42.9% Renter occupiedHouse owners and renters - Black or African American residents 1,646 42.6% Owner occupied2,214 57.4% Renter occupiedHouse owners and renters - American Indian / Alaska Native residents 30 60.9% Owner occupied19 39.1% Renter occupiedHouse owners and renters - Asian residents 126 45.0% Owner occupied154 55.0% Renter occupiedHouse owners and renters - Other race residents 1,513 56.4% Owner occupied1,171 43.6% Renter occupiedHouse owners and renters - Two or more races residents 2,920 48.8% Owner occupied3,060 51.2% Renter occupiedHouse owners and renters - White alone residents 8,541 59.0% Owner occupied5,937 41.0% Renter occupiedHouse owners and renters - Hispanic or Latino residents 4,343 47.1% Owner occupied4,871 52.9% Renter occupied
Language usage in Four Corners
English speakers - Total 63.8% of residents of Four Corners speak English at home.
31.5% of residents speak Spanish at home 14,756 64.4% Speak English very well8,173 35.6% Speak English less than very well4.7% of residents speak other language at home 2,285 67.0% Speak English very well1,126 33.0% Speak English less than very well
English speakers - Born in the United States 90.3% of residents of Four Corners speak English at home.
8.5% of residents speak Spanish at home 2,521 90.3% Speak English very well270 9.7% Speak English less than very well1.2% of residents speak other language at home 357 88.6% Speak English very well46 11.4% Speak English less than very well
English speakers - Native, born elsewhere 10.1% of residents of Four Corners speak English at home.
87.8% of residents speak Spanish at home 4,706 88.9% Speak English very well588 11.1% Speak English less than very well2.1% of residents speak other language at home 65 50.4% Speak English very well64 49.6% Speak English less than very well
English speakers - Foreign-born 13.8% of residents of Four Corners speak English at home.
70.4% of residents speak Spanish at home 3,700 34.0% Speak English very well7,189 66.0% Speak English less than very well15.8% of residents speak other language at home 1,432 58.5% Speak English very well1,016 41.5% Speak English less than very well
White (Caucasian) - Speak only English Native:
93.0% (29,466)Foreign-born:
31.6% (1,115)
White (Caucasian) - Speak another language Native:
7.0% (2,225)Foreign-born:
68.4% (2,417)
Black or African American - Speak only English Native:
93.9% (4,246)Foreign-born:
70.1% (597)
Black or African American - Speak another language Native:
4.7% (210)Foreign-born:
30.3% (258)
Asian - Speak only English Native:
81.6% (491)Foreign-born:
20.8% (99)
Asian - Speak another language Native:
17.1% (103)Foreign-born:
79.3% (377)
Other race - Speak another language Native:
73.7% (2,678)Foreign-born:
100.0% (5,152)
Two or more races - Speak only English Native:
37.6% (4,671)Foreign-born:
1.5% (73)
Two or more races - Speak another language Native:
62.4% (7,757)Foreign-born:
98.5% (4,763)
White alone - Speak only English Native:
97.3% (28,622)Foreign-born:
34.9% (982)
White alone - Speak another language Native:
2.7% (788)Foreign-born:
65.1% (1,832)
Hispanic or Latino - Speak only English Native:
20.5% (3,096)Foreign-born:
1.8% (206)
Hispanic or Latino - Speak another language Native:
79.5% (12,035)Foreign-born:
98.2% (11,016)
Foreign-born residents in Four Corners
Marital status for residents in Four Corners Marital status - White (Caucasian) population 15 years and over
Males 44.0% Never married47.4% Now married0.5% Separated2.5% Widowed5.6% DivorcedFemales 35.4% Never married42.2% Now married4.2% Separated5.7% Widowed12.6% DivorcedWomen who gave birth in the past 12 months Now married:
100.0% (158)Unmarried:
0.0% (0)
Women who did not give birth in the past 12 months Now married:
38.5% (3,887)Unmarried:
61.5% (6,212)
Marital status - Black or African American population 15 years and over
Males 43.6% Never married51.6% Now married0.0% Separated0.0% Widowed4.8% DivorcedFemales 50.0% Never married29.5% Now married2.0% Separated2.5% Widowed16.0% DivorcedWomen who gave birth in the past 12 months Now married:
0.0% (0)Unmarried:
100.0% (132)
Women who did not give birth in the past 12 months Now married:
25.0% (379)Unmarried:
75.0% (1,139)
Marital status - American Indian / Alaska Native population 15 years and over
Males 72.1% Never married10.3% Now married0.0% Separated0.0% Widowed17.6% DivorcedFemales 13.0% Never married61.1% Now married0.0% Separated0.0% Widowed25.9% DivorcedWomen who did not give birth in the past 12 months Now married:
82.5% (54)Unmarried:
17.5% (11)
Marital status - Asian population 15 years and over
Males 50.7% Never married36.9% Now married12.4% Separated0.0% Widowed0.0% DivorcedFemales 37.6% Never married55.7% Now married0.0% Separated1.1% Widowed5.6% DivorcedWomen who gave birth in the past 12 months Now married:
100.0% (10)Unmarried:
0.0% (0)
Women who did not give birth in the past 12 months Now married:
19.6% (54)Unmarried:
80.4% (224)
Marital status - Other race population 15 years and over
Males 38.9% Never married52.1% Now married0.0% Separated0.6% Widowed8.4% DivorcedFemales 37.1% Never married36.5% Now married14.7% Separated7.0% Widowed4.6% DivorcedWomen who gave birth in the past 12 months Now married:
61.9% (38)Unmarried:
38.1% (23)
Women who did not give birth in the past 12 months Now married:
53.3% (1,129)Unmarried:
46.7% (989)
Marital status - Two or more races population 15 years and over
Males 35.2% Never married55.5% Now married0.0% Separated0.7% Widowed8.6% DivorcedFemales 44.8% Never married46.3% Now married0.0% Separated2.1% Widowed6.8% DivorcedWomen who gave birth in the past 12 months Now married:
100.0% (19)Unmarried:
0.0% (0)
Women who did not give birth in the past 12 months Now married:
37.2% (1,394)Unmarried:
62.8% (2,351)
Marital status - White alone, not Hispanic / Latino population 15 years and over
Males 43.1% Never married47.7% Now married0.6% Separated2.5% Widowed6.1% DivorcedFemales 36.2% Never married40.8% Now married4.4% Separated5.6% Widowed13.0% DivorcedWomen who gave birth in the past 12 months Now married:
100.0% (64)Unmarried:
0.0% (0)
Women who did not give birth in the past 12 months Now married:
37.0% (3,560)Unmarried:
63.0% (6,066)
Marital status - Hispanic or Latino population 15 years and over
Males 28.5% Never married63.8% Now married0.0% Separated0.8% Widowed6.9% DivorcedFemales 33.4% Never married52.2% Now married3.7% Separated3.9% Widowed6.9% DivorcedWomen who gave birth in the past 12 months Now married:
66.7% (115)Unmarried:
33.3% (58)
Women who did not give birth in the past 12 months Now married:
38.8% (2,245)Unmarried:
61.2% (3,536)
Ancestries in Four Corners
5,178 16.0% American1,530 4.7% Italian1,440 4.4% Irish1,259 3.9% German1,100 3.4% English470 1.5% Brazilian454 1.4% European451 1.4% British315 1.0% Jamaican309 1.0% French299 0.9% Moroccan250 0.8% French Canadian247 0.8% Canadian195 0.6% Polish140 0.4% Lebanese121 0.4% Ukrainian119 0.4% Guyanese110 0.3% Czech101 0.3% Portuguese99 0.3% Jordanian95 0.3% Greek90 0.3% Scottish62 0.2% Scotch-Irish61 0.2% Ethiopian50 0.2% Croatian44 0.1% Armenian44 0.1% Northern European42 0.1% Romanian41 0.1% Russian37 0.1% Nigerian36 0.1% Dutch35 0.1% Hungarian34 0.1% Swedish30 0.09% Belgian28 0.09% Turkish27 0.08% Norwegian25 0.08% Slovak22 0.07% Eastern European22 0.07% African22 0.07% Trinidadian and Tobagonian20 0.06% Lithuanian20 0.06% Iranian19 0.06% Cape Verdean17 0.05% Pennsylvania German14 0.04% Czechoslovakian10 0.03% West Indian8 0.02% Austrian8 0.02% Syrian7 0.02% Scandinavian6 0.02% Yugoslavian5 0.02% Finnish5 0.02% Danish
Geographical mobility in Four Corners Same house 1 year ago 29,500 80.1% White (Caucasian)4,833 82.3% Black or African American95 41.3% American Indian / Alaska Native778 72.7% Asian6,763 86.0% Other race12,458 93.1% Two or more races26,829 80.3% White alone, not Hispanic / Latino18,412 87.3% Hispanic or LatinoMoved within same county 1,247 3.4% White / Caucasian173 3.0% Black or African American106 46.3% American Indian / Alaska Native52 4.9% Asian172 2.2% Other race111 0.8% Two or more races1,247 3.7% White alone, not Hispanic / Latino278 1.3% Hispanic or LatinoMoved within same state 2,085 5.7% White / Caucasian474 8.1% Black or African American140 13.1% Asian493 6.3% Other race853 6.4% Two or more races1,350 4.0% White alone, not Hispanic / Latino2,040 9.7% Hispanic or LatinoMoved from different state 3,155 8.6% White / Caucasian565 9.6% Black or African American70 6.5% Asian330 4.2% Other race182 1.4% Two or more races3,155 9.4% White alone, not Hispanic / Latino465 2.2% Hispanic or LatinoMoved from abroad 822 2.2% White68 1.2% Black or African American17 1.6% Asian384 4.9% Other race215 1.6% Two or more races822 2.5% White alone, not Hispanic / Latino961 4.6% Hispanic or Latino
Children Nativity (place of birth) in Four Corners
Children under 6 years - Living with two parents Both parents native 1,351 100.0% NativeBoth parents foreign-born 301 76.4% Native93 23.6% Foreign-bornOne native, one foreign-born parent 204 100.0% NativeChildren under 6 years - Living with one parent Native parent 1,278 100.0% Native0 0.0% Foreign-bornForeign-born parent 447 96.5% Native16 3.5% Foreign-bornChildren 6 to 17 years - Living with two parents Both parents native 2,852 100.0% NativeBoth parents foreign-born 836 42.7% Native1,123 57.3% Foreign-bornOne native, one foreign-born parent 699 100.0% NativeChildren 6 to 17 years - Living with one parent Native parent 926 100.0% NativeForeign-born parent 1,080 61.7% Native669 38.3% Foreign-born
Grandparents responsible for own grandchildren in Four Corners
Grandparents (30 to 59 years) White / Caucasian 6 5.2% Responsible for grandchildren111 94.8% Not responsible for grandchildrenBlack or African American 11 13.8% Responsible for grandchildren71 86.2% Not responsible for grandchildrenOther race 86 100.0% Not responsible for grandchildrenTwo or more races 11 100.0% Responsible for grandchildrenWhite alone, not Hispanic / Latino 87 100.0% Not responsible for grandchildrenHispanic or Latino 10 6.8% Responsible for grandchildren138 93.2% Not responsible for grandchildrenGrandparents (60 years and over) White / Caucasian 58 24.5% Responsible for grandchildren177 75.5% Not responsible for grandchildrenBlack or African American 268 100.0% Not responsible for grandchildrenOther race 37 21.4% Responsible for grandchildren136 78.6% Not responsible for grandchildrenTwo or more races 77 26.1% Responsible for grandchildren219 73.9% Not responsible for grandchildrenWhite alone, not Hispanic / Latino 56 44.4% Responsible for grandchildren70 55.6% Not responsible for grandchildrenHispanic or Latino 5 0.9% Responsible for grandchildren591 99.1% Not responsible for grandchildren