Races in Fredericksburg, Virginia (VA) Detailed Stats
Data:
Races - White alone (%)
Races - White alone (% change since 2000)
Races - Black alone (%)
Races - Black alone (% change since 2000)
Races - American Indian alone (%)
Races - American Indian alone (% change since 2000)
Races - Asian alone (%)
Races - Asian alone (% change since 2000)
Races - Hispanic (%)
Races - Hispanic (% change since 2000)
Races - Native Hawaiian and Other Pacific Islander alone (%)
Races - Native Hawaiian and Other Pacific Islander alone (% change since 2000)
Races - Two or more races(%)
Races - Two or more races(% change since 2000)
Races - Other race alone (%)
Races - Other race alone (% change since 2000)
Racial diversity
Place of birth - Born in state of residence (%)
Place of birth - Born in state of residence (%) - White
Place of birth - Born in state of residence (%) - Black or African American
Place of birth - Born in state of residence (%) - Asian
Place of birth - Born in state of residence (%) - Hispanic or Latino
Place of birth - Born in state of residence (%) - American Indian and Alaska Native
Place of birth - Born in state of residence (%) - Multirace
Place of birth - Born in state of residence (%) - Other Race
Place of birth - Born in other state (%)
Place of birth - Born in other state (%) - White
Place of birth - Born in other state (%) - Black or African American
Place of birth - Born in other state (%) - Asian
Place of birth - Born in other state (%) - Hispanic or Latino
Place of birth - Born in other state (%) - American Indian and Alaska Native
Place of birth - Born in other state (%) - Multirace
Place of birth - Born in other state (%) - Other Race
Place of birth - Native, outside of US (%)
Place of birth - Native, outside of US (%) - White
Place of birth - Native, outside of US (%) - Black or African American
Place of birth - Native, outside of US (%) - Asian
Place of birth - Native, outside of US (%) - Hispanic or Latino
Place of birth - Native, outside of US (%) - American Indian and Alaska Native
Place of birth - Native, outside of US (%) - Multirace
Place of birth - Native, outside of US (%) - Other Race
Place of birth - Foreign born (%)
Place of birth - Foreign born (%) - White
Place of birth - Foreign born (%) - Black or African American
Place of birth - Foreign born (%) - Asian
Place of birth - Foreign born (%) - Hispanic or Latino
Place of birth - Foreign born (%) - American Indian and Alaska Native
Place of birth - Foreign born (%) - Multirace
Place of birth - Foreign born (%) - Other Race
Residents speaking English at home (%)
Residents speaking English at home - Born in the United States (%)
Residents speaking English at home - Native, born elsewhere (%)
Residents speaking English at home - Foreign born (%)
Residents speaking Spanish at home (%)
Residents speaking Spanish at home - Born in the United States (%)
Residents speaking Spanish at home - Native, born elsewhere (%)
Residents speaking Spanish at home - Foreign born (%)
Residents speaking other language at home (%)
Residents speaking other language at home - Born in the United States (%)
Residents speaking other language at home - Native, born elsewhere (%)
Residents speaking other language at home - Foreign born (%)
Marital status - Never married (%)
Marital status - Now married (%)
Marital status - Separated (%)
Marital status - Widowed (%)
Marital status - Divorced (%)
Ancestries Reported - Arab (%)
Ancestries Reported - Czech (%)
Ancestries Reported - Danish (%)
Ancestries Reported - Dutch (%)
Ancestries Reported - English (%)
Ancestries Reported - French (%)
Ancestries Reported - French Canadian (%)
Ancestries Reported - German (%)
Ancestries Reported - Greek (%)
Ancestries Reported - Hungarian (%)
Ancestries Reported - Irish (%)
Ancestries Reported - Italian (%)
Ancestries Reported - Lithuanian (%)
Ancestries Reported - Norwegian (%)
Ancestries Reported - Polish (%)
Ancestries Reported - Portuguese (%)
Ancestries Reported - Russian (%)
Ancestries Reported - Scotch-Irish (%)
Ancestries Reported - Scottish (%)
Ancestries Reported - Slovak (%)
Ancestries Reported - Subsaharan African (%)
Ancestries Reported - Swedish (%)
Ancestries Reported - Swiss (%)
Ancestries Reported - Ukrainian (%)
Ancestries Reported - United States (%)
Ancestries Reported - Welsh (%)
Ancestries Reported - West Indian (%)
Ancestries Reported - Other (%)
Geographical mobility - Same house 1 year ago (%)
Geographical mobility - Same house 1 year ago (%) - White
Geographical mobility - Same house 1 year ago (%) - Black or African American
Geographical mobility - Same house 1 year ago (%) - Asian
Geographical mobility - Same house 1 year ago (%) - Hispanic or Latino
Geographical mobility - Same house 1 year ago (%) - American Indian and Alaska Native
Geographical mobility - Same house 1 year ago (%) - Multirace
Geographical mobility - Same house 1 year ago (%) - Other Race
Geographical mobility - Moved within same county (%)
Geographical mobility - Moved within same county (%) - White
Geographical mobility - Moved within same county (%) - Black or African American
Geographical mobility - Moved within same county (%) - Asian
Geographical mobility - Moved within same county (%) - Hispanic or Latino
Geographical mobility - Moved within same county (%) - American Indian and Alaska Native
Geographical mobility - Moved within same county (%) - Multirace
Geographical mobility - Moved within same county (%) - Other Race
Geographical mobility - Moved from different county within same state (%)
Geographical mobility - Moved from different county within same state (%) - White
Geographical mobility - Moved from different county within same state (%) - Black or African American
Geographical mobility - Moved from different county within same state (%) - Asian
Geographical mobility - Moved from different county within same state (%) - Hispanic or Latino
Geographical mobility - Moved from different county within same state (%) - American Indian and Alaska Native
Geographical mobility - Moved from different county within same state (%) - Multirace
Geographical mobility - Moved from different county within same state (%) - Other Race
Geographical mobility - Moved from different state (%)
Geographical mobility - Moved from different state (%) - White
Geographical mobility - Moved from different state (%) - Black or African American
Geographical mobility - Moved from different state (%) - Asian
Geographical mobility - Moved from different state (%) - Hispanic or Latino
Geographical mobility - Moved from different state (%) - American Indian and Alaska Native
Geographical mobility - Moved from different state (%) - Multirace
Geographical mobility - Moved from different state (%) - Other Race
Geographical mobility - Moved from abroad (%)
Geographical mobility - Moved from abroad (%) - White
Geographical mobility - Moved from abroad (%) - Black or African American
Geographical mobility - Moved from abroad (%) - Asian
Geographical mobility - Moved from abroad (%) - Hispanic or Latino
Geographical mobility - Moved from abroad (%) - American Indian and Alaska Native
Geographical mobility - Moved from abroad (%) - Multirace
Geographical mobility - Moved from abroad (%) - Other Race
Place of birth for the foreign-born population - Ireland (%)
Place of birth for the foreign-born population - Denmark (%)
Place of birth for the foreign-born population - Norway (%)
Place of birth for the foreign-born population - Sweden (%)
Place of birth for the foreign-born population - United Kingdom (%)
Place of birth for the foreign-born population - England (%)
Place of birth for the foreign-born population - Scotland (%)
Place of birth for the foreign-born population - Other Northern Europe (%)
Place of birth for the foreign-born population - Austria (%)
Place of birth for the foreign-born population - Belgium (%)
Place of birth for the foreign-born population - France (%)
Place of birth for the foreign-born population - Germany (%)
Place of birth for the foreign-born population - Netherlands (%)
Place of birth for the foreign-born population - Switzerland (%)
Place of birth for the foreign-born population - Other Western Europe (%)
Place of birth for the foreign-born population - Greece (%)
Place of birth for the foreign-born population - Italy (%)
Place of birth for the foreign-born population - Portugal (%)
Place of birth for the foreign-born population - Spain (%)
Place of birth for the foreign-born population - Other Southern Europe (%)
Place of birth for the foreign-born population - Albania (%)
Place of birth for the foreign-born population - Belarus (%)
Place of birth for the foreign-born population - Bosnia and Herzegovina (%)
Place of birth for the foreign-born population - Bulgaria (%)
Place of birth for the foreign-born population - Croatia (%)
Place of birth for the foreign-born population - Czechoslovakia (%)
Place of birth for the foreign-born population - Hungary (%)
Place of birth for the foreign-born population - Latvia (%)
Place of birth for the foreign-born population - Lithuania (%)
Place of birth for the foreign-born population - North Macedonia (Macedonia) (%)
Place of birth for the foreign-born population - Moldova (%)
Place of birth for the foreign-born population - Poland (%)
Place of birth for the foreign-born population - Romania (%)
Place of birth for the foreign-born population - Russia (%)
Place of birth for the foreign-born population - Serbia (%)
Place of birth for the foreign-born population - Ukraine (%)
Place of birth for the foreign-born population - Other Eastern Europe (%)
Place of birth for the foreign-born population - China (%)
Place of birth for the foreign-born population - Hong Kong (%)
Place of birth for the foreign-born population - Taiwan (%)
Place of birth for the foreign-born population - Japan (%)
Place of birth for the foreign-born population - Korea (%)
Place of birth for the foreign-born population - Other Eastern Asia (%)
Place of birth for the foreign-born population - Afghanistan (%)
Place of birth for the foreign-born population - Bangladesh (%)
Place of birth for the foreign-born population - India (%)
Place of birth for the foreign-born population - Iran (%)
Place of birth for the foreign-born population - Kazakhstan (%)
Place of birth for the foreign-born population - Nepal (%)
Place of birth for the foreign-born population - Pakistan (%)
Place of birth for the foreign-born population - Sri Lanka (%)
Place of birth for the foreign-born population - Uzbekistan (%)
Place of birth for the foreign-born population - Other South Central Asia (%)
Place of birth for the foreign-born population - Burma (%)
Place of birth for the foreign-born population - Cambodia (%)
Place of birth for the foreign-born population - Indonesia (%)
Place of birth for the foreign-born population - Laos (%)
Place of birth for the foreign-born population - Malaysia (%)
Place of birth for the foreign-born population - Philippines (%)
Place of birth for the foreign-born population - Singapore (%)
Place of birth for the foreign-born population - Thailand (%)
Place of birth for the foreign-born population - Vietnam (%)
Place of birth for the foreign-born population - Other South Eastern Asia (%)
Place of birth for the foreign-born population - Armenia (%)
Place of birth for the foreign-born population - Iraq (%)
Place of birth for the foreign-born population - Israel (%)
Place of birth for the foreign-born population - Jordan (%)
Place of birth for the foreign-born population - Kuwait (%)
Place of birth for the foreign-born population - Lebanon (%)
Place of birth for the foreign-born population - Saudi Arabia (%)
Place of birth for the foreign-born population - Syria (%)
Place of birth for the foreign-born population - Turkey (%)
Place of birth for the foreign-born population - Yemen (%)
Place of birth for the foreign-born population - Other Western Asia (%)
Place of birth for the foreign-born population - Eritrea (%)
Place of birth for the foreign-born population - Ethiopia (%)
Place of birth for the foreign-born population - Kenya (%)
Place of birth for the foreign-born population - Somalia (%)
Place of birth for the foreign-born population - Uganda (%)
Place of birth for the foreign-born population - Zimbabwe (%)
Place of birth for the foreign-born population - Other Eastern Africa (%)
Place of birth for the foreign-born population - Cameroon (%)
Place of birth for the foreign-born population - Congo (%)
Place of birth for the foreign-born population - Democratic Republic of Congo (Zaire) (%)
Place of birth for the foreign-born population - Other Middle Africa (%)
Place of birth for the foreign-born population - Egypt (%)
Place of birth for the foreign-born population - Morocco (%)
Place of birth for the foreign-born population - Sudan (%)
Place of birth for the foreign-born population - Other Northern Africa (%)
Place of birth for the foreign-born population - South Africa (%)
Place of birth for the foreign-born population - Other Southern Africa (%)
Place of birth for the foreign-born population - Cabo Verde (%)
Place of birth for the foreign-born population - Ghana (%)
Place of birth for the foreign-born population - Liberia (%)
Place of birth for the foreign-born population - Nigeria (%)
Place of birth for the foreign-born population - Senegal (%)
Place of birth for the foreign-born population - Sierra Leone (%)
Place of birth for the foreign-born population - Other Western Africa (%)
Place of birth for the foreign-born population - Australia (%)
Place of birth for the foreign-born population - New Zealand (%)
Place of birth for the foreign-born population - Fiji (%)
Place of birth for the foreign-born population - Micronesia (%)
Place of birth for the foreign-born population - Bahamas (%)
Place of birth for the foreign-born population - Barbados (%)
Place of birth for the foreign-born population - Cuba (%)
Place of birth for the foreign-born population - Dominica (%)
Place of birth for the foreign-born population - Dominican Republic (%)
Place of birth for the foreign-born population - Grenada (%)
Place of birth for the foreign-born population - Haiti (%)
Place of birth for the foreign-born population - Jamaica (%)
Place of birth for the foreign-born population - St. Vincent and the Grenadines (%)
Place of birth for the foreign-born population - Trinidad and Tobago (%)
Place of birth for the foreign-born population - West Indies (%)
Place of birth for the foreign-born population - Other Caribbean (%)
Place of birth for the foreign-born population - Belize (%)
Place of birth for the foreign-born population - Costa Rica (%)
Place of birth for the foreign-born population - El Salvador (%)
Place of birth for the foreign-born population - Guatemala (%)
Place of birth for the foreign-born population - Honduras (%)
Place of birth for the foreign-born population - Mexico (%)
Place of birth for the foreign-born population - Nicaragua (%)
Place of birth for the foreign-born population - Panama (%)
Place of birth for the foreign-born population - Other Central America (%)
Place of birth for the foreign-born population - Argentina (%)
Place of birth for the foreign-born population - Bolivia (%)
Place of birth for the foreign-born population - Brazil (%)
Place of birth for the foreign-born population - Chile (%)
Place of birth for the foreign-born population - Colombia (%)
Place of birth for the foreign-born population - Ecuador (%)
Place of birth for the foreign-born population - Guyana (%)
Place of birth for the foreign-born population - Peru (%)
Place of birth for the foreign-born population - Uruguay (%)
Place of birth for the foreign-born population - Venezuela (%)
Place of birth for the foreign-born population - Other South America (%)
Place of birth for the foreign-born population - Canada (%)
Place of birth for the foreign-born population - Other Northern America (%)
Place of birth for the foreign-born population - Other (%)
Latest news about races in Fredericksburg, VA collected exclusively by city-data.com from local newspapers, TV, and radio stations
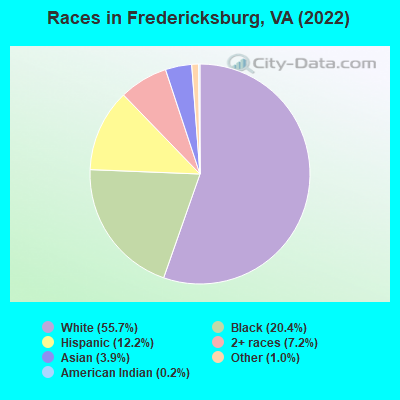
According to 2022 data, the most numerous races in Fredericksburg, VA are White alone (15,843 residents), Black alone (5,812 residents), and Hispanic (3,463 residents). 83.6% of Fredericksburg residents speak English at home. 11.4% of Fredericksburg, VA residents are foreign-born (4.6% born in Asia, 4.0% born in Latin America, 1.4% born in Europe), which is 5.3% less than the foreign-born rate of 12.0% across the entire state of Virginia.
Race distribution in Fredericksburg
2000 2022
4,965,637 70.2% White alone 1,376,378 19.4% Black alone 329,540 4.7% Hispanic 259,277 3.7% Asian alone 114,022 1.6% Two or more races 18,596 0.3% American Indian alone 11,685 0.2% Other race alone 3,380 0.05% Native Hawaiian and Other
5,095,130 58.7% White alone 1,594,785 18.4% Black alone 905,750 10.4% Hispanic 602,881 6.9% Asian alone 406,047 4.7% Two or more races 60,419 0.7% Other race alone 11,738 0.1% American Indian alone 6,869 0.08% Native Hawaiian and Other
Income and house value in Fredericksburg Median household income in 2022 $83,801 White non-Hispanic householders$70,377 Black householders$94,357 Asian householders$83,712 Some other race householders$88,702 Two or more races householders$84,883 Hispanic or Latino race householdersMedian 2022 house value $534,256 White Non-Hispanic householders$305,890 Black or African American householders $394,641 Asian householders$382,012 Some other race householders$519,873 Two or more races householders$406,217 Hispanic or Latino householders
Median age by race in Fredericksburg
33.8 Median age for White residents33.9 33.6 34.5 Median age for Black or African American residents30.0 38.8 66.3 Median age for American Indian / Alaska Native residents-682,352,940.5 77.6 33.8 Median age for Asian residents37.3 33.8 -611,955,419.9 Median age for Native Hawaiian / Pacific Islander residents-541,531,822.5 -714,150,046.8 22.2 Median age for Other race residents23.1 20.1 23.3 Median age for Two or more races residents25.1 23.3 33.5 Median age for White alone residents33.7 33.4 23.7 Median age for Hispanic or Latino residents25.4 21.8
Owner/renter occupied households by race in Fredericksburg
House owners and renters - White residents 3,258 45.0% Owner occupied3,975 55.0% Renter occupiedHouse owners and renters - Black or African American residents 650 26.0% Owner occupied1,854 74.0% Renter occupiedHouse owners and renters - American Indian / Alaska Native residents 4 10.4% Owner occupied39 89.6% Renter occupiedHouse owners and renters - Asian residents 190 46.0% Owner occupied222 54.0% Renter occupiedHouse owners and renters - Other race residents 101 24.7% Owner occupied309 75.3% Renter occupiedHouse owners and renters - Two or more races residents 298 33.5% Owner occupied590 66.5% Renter occupiedHouse owners and renters - White alone residents 3,225 44.9% Owner occupied3,960 55.1% Renter occupiedHouse owners and renters - Hispanic or Latino residents 222 26.4% Owner occupied622 73.6% Renter occupied
Language usage in Fredericksburg
English speakers - Total 83.6% of residents of Fredericksburg speak English at home.
8.1% of residents speak Spanish at home 1,138 52.3% Speak English very well1,039 47.7% Speak English less than very well8.2% of residents speak other language at home 1,279 58.0% Speak English very well925 42.0% Speak English less than very well
English speakers - Born in the United States 95.6% of residents of Fredericksburg speak English at home.
2.6% of residents speak Spanish at home 254 94.8% Speak English very well14 5.2% Speak English less than very well1.6% of residents speak other language at home 146 90.7% Speak English very well15 9.3% Speak English less than very well
English speakers - Native, born elsewhere 54.5% of residents of Fredericksburg speak English at home.
35.2% of residents speak Spanish at home 158 66.7% Speak English very well79 33.3% Speak English less than very well9.8% of residents speak other language at home 47 71.2% Speak English very well19 28.8% Speak English less than very well
English speakers - Foreign-born 18.4% of residents of Fredericksburg speak English at home.
33.1% of residents speak Spanish at home 291 27.9% Speak English very well753 72.1% Speak English less than very well48.5% of residents speak other language at home 675 44.1% Speak English very well856 55.9% Speak English less than very well
White (Caucasian) - Speak only English Native:
96.3% (14,022)Foreign-born:
31.8% (252)
White (Caucasian) - Speak another language Native:
3.5% (509)Foreign-born:
68.9% (547)
Black or African American - Speak only English Native:
97.6% (5,132)Foreign-born:
36.5% (136)
Black or African American - Speak another language Native:
2.3% (123)Foreign-born:
61.7% (230)
Asian - Speak only English Native:
46.3% (152)Foreign-born:
18.7% (129)
Asian - Speak another language Native:
54.6% (179)Foreign-born:
81.6% (562)
Other race - Speak only English Native:
39.7% (396)Foreign-born:
0.9% (7)
Other race - Speak another language Native:
59.3% (592)Foreign-born:
97.7% (827)
Two or more races - Speak only English Native:
82.9% (2,295)Foreign-born:
3.9% (15)
Two or more races - Speak another language Native:
16.6% (458)Foreign-born:
96.6% (376)
White alone - Speak only English Native:
97.5% (13,874)Foreign-born:
25.9% (236)
White alone - Speak another language Native:
2.5% (350)Foreign-born:
74.8% (682)
Hispanic or Latino - Speak only English Native:
44.7% (900)Foreign-born:
3.9% (43)
Hispanic or Latino - Speak another language Native:
55.0% (1,109)Foreign-born:
95.9% (1,061)
Foreign-born residents in Fredericksburg 3,241 residents are foreign born (4.6% Asia , 4.0% Latin America , 1.4% Europe ).
This city:
11.4%Virginia:
12.6%
Marital status for residents in Fredericksburg Marital status - White (Caucasian) population 15 years and over
Males 45.7% Never married41.7% Now married0.6% Separated1.7% Widowed10.3% DivorcedFemales 42.8% Never married37.6% Now married1.1% Separated4.4% Widowed14.1% DivorcedWomen who gave birth in the past 12 months Now married:
69.7% (101)Unmarried:
30.3% (44)
Women who did not give birth in the past 12 months Now married:
28.0% (1,324)Unmarried:
72.0% (3,398)
Marital status - Black or African American population 15 years and over
Males 46.9% Never married34.7% Now married4.5% Separated0.8% Widowed13.1% DivorcedFemales 38.6% Never married28.9% Now married9.9% Separated7.5% Widowed15.1% DivorcedWomen who gave birth in the past 12 months Now married:
0.0% (0)Unmarried:
100.0% (18)
Women who did not give birth in the past 12 months Now married:
27.1% (415)Unmarried:
72.9% (1,116)
Marital status - American Indian / Alaska Native population 15 years and over
Males 63.2% Never married36.8% Now married0.0% Separated0.0% Widowed0.0% DivorcedFemales 25.8% Never married0.0% Now married0.0% Separated0.0% Widowed74.2% DivorcedMarital status - Asian population 15 years and over
Males 29.9% Never married70.1% Now married0.0% Separated0.0% Widowed0.0% DivorcedFemales 26.2% Never married63.6% Now married0.0% Separated1.0% Widowed9.3% DivorcedWomen who gave birth in the past 12 months Now married:
100.0% (68)Unmarried:
0.0% (0)
Women who did not give birth in the past 12 months Now married:
53.4% (209)Unmarried:
46.6% (182)
Marital status - Other race population 15 years and over
Males 77.0% Never married23.0% Now married0.0% Separated0.0% Widowed0.0% DivorcedFemales 56.4% Never married35.6% Now married0.0% Separated4.0% Widowed4.0% DivorcedWomen who did not give birth in the past 12 months Now married:
19.5% (87)Unmarried:
80.5% (358)
Marital status - Two or more races population 15 years and over
Males 54.2% Never married42.2% Now married0.0% Separated0.0% Widowed3.7% DivorcedFemales 71.0% Never married22.9% Now married2.0% Separated0.4% Widowed3.7% DivorcedWomen who did not give birth in the past 12 months Now married:
16.5% (223)Unmarried:
83.5% (1,127)
Marital status - White alone, not Hispanic / Latino population 15 years and over
Males 46.0% Never married40.8% Now married0.6% Separated1.8% Widowed10.8% DivorcedFemales 42.9% Never married37.3% Now married1.1% Separated4.5% Widowed14.1% DivorcedWomen who gave birth in the past 12 months Now married:
69.7% (105)Unmarried:
30.3% (46)
Women who did not give birth in the past 12 months Now married:
28.1% (1,339)Unmarried:
71.9% (3,434)
Marital status - Hispanic or Latino population 15 years and over
Males 54.8% Never married43.3% Now married0.0% Separated0.0% Widowed2.0% DivorcedFemales 47.6% Never married38.7% Now married2.1% Separated3.8% Widowed7.7% DivorcedWomen who did not give birth in the past 12 months Now married:
23.8% (188)Unmarried:
76.2% (602)
Ancestries in Fredericksburg
1,425 9.8% English907 6.2% American800 5.5% Afghan731 5.0% Irish692 4.8% European575 3.9% German210 1.4% Sierra Leonean206 1.4% Lebanese170 1.2% Scotch-Irish161 1.1% Italian155 1.1% Iranian139 1.0% Ugandan129 0.9% British119 0.8% African112 0.8% Norwegian86 0.6% Scottish81 0.6% Palestinian59 0.4% Welsh53 0.4% Polish42 0.3% French Canadian41 0.3% Greek30 0.2% Ghanaian30 0.2% Nigerian21 0.1% Swedish19 0.1% Egyptian16 0.1% Canadian16 0.1% Northern European15 0.1% Haitian14 0.10% Eastern European13 0.09% Hungarian13 0.09% French11 0.08% Lithuanian10 0.07% Ukrainian10 0.07% Danish7 0.05% Slovak7 0.05% Portuguese7 0.05% Swiss6 0.04% Slovene5 0.03% Finnish5 0.03% Russian
Geographical mobility in Fredericksburg Same house 1 year ago 11,861 74.2% White (Caucasian)4,420 73.4% Black or African American53 96.1% American Indian / Alaska Native879 79.3% Asian722 37.9% Other race2,775 80.8% Two or more races11,587 74.0% White alone, not Hispanic / Latino1,976 58.4% Hispanic or LatinoMoved within same county 772 4.8% White / Caucasian146 2.4% Black or African American71 6.4% Asian467 24.6% Other race146 4.3% Two or more races743 4.7% White alone, not Hispanic / Latino623 18.4% Hispanic or LatinoMoved within same state 2,171 13.6% White / Caucasian1,388 23.1% Black or African American66 5.9% Asian494 26.0% Other race385 11.2% Two or more races2,159 13.8% White alone, not Hispanic / Latino607 17.9% Hispanic or LatinoMoved from different state 1,103 6.9% White / Caucasian80 1.3% Black or African American80 7.2% Asian35 1.8% Other race17 0.5% Two or more races1,095 7.0% White alone, not Hispanic / Latino93 2.8% Hispanic or LatinoMoved from abroad 20 0.1% White94 1.6% Black or African American9 0.8% Asian117 3.4% Two or more races23 0.1% White alone, not Hispanic / Latino82 2.4% Hispanic or Latino
Children Nativity (place of birth) in Fredericksburg
Children under 6 years - Living with two parents Both parents native 380 99.9% Native0 0.1% Foreign-bornBoth parents foreign-born 164 72.9% Native61 27.1% Foreign-bornOne native, one foreign-born parent 221 100.0% NativeChildren under 6 years - Living with one parent Native parent 662 97.4% Native18 2.6% Foreign-bornForeign-born parent 377 97.0% Native12 3.0% Foreign-bornChildren 6 to 17 years - Living with two parents Both parents native 894 100.0% NativeBoth parents foreign-born 263 43.2% Native345 56.8% Foreign-bornOne native, one foreign-born parent 471 100.0% NativeChildren 6 to 17 years - Living with one parent Native parent 1,309 100.0% NativeForeign-born parent 434 58.6% Native307 41.4% Foreign-born
Grandparents responsible for own grandchildren in Fredericksburg
Grandparents (30 to 59 years) White / Caucasian 44 72.3% Responsible for grandchildren17 27.7% Not responsible for grandchildrenAsian 37 100.0% Responsible for grandchildrenOther race 49 63.9% Responsible for grandchildren28 36.1% Not responsible for grandchildrenTwo or more races 81 100.0% Responsible for grandchildrenWhite alone, not Hispanic / Latino 44 70.4% Responsible for grandchildren19 29.6% Not responsible for grandchildrenHispanic or Latino 66 81.0% Responsible for grandchildren15 19.0% Not responsible for grandchildren
Grandparents (60 years and over) White / Caucasian 15 100.0% Not responsible for grandchildrenWhite alone, not Hispanic / Latino 15 100.0% Not responsible for grandchildren