Races in Fullerton, California (CA) Detailed Stats
Data:
Races - White alone (%)
Races - White alone (% change since 2000)
Races - Black alone (%)
Races - Black alone (% change since 2000)
Races - American Indian alone (%)
Races - American Indian alone (% change since 2000)
Races - Asian alone (%)
Races - Asian alone (% change since 2000)
Races - Hispanic (%)
Races - Hispanic (% change since 2000)
Races - Native Hawaiian and Other Pacific Islander alone (%)
Races - Native Hawaiian and Other Pacific Islander alone (% change since 2000)
Races - Two or more races(%)
Races - Two or more races(% change since 2000)
Races - Other race alone (%)
Races - Other race alone (% change since 2000)
Racial diversity
Place of birth - Born in state of residence (%)
Place of birth - Born in state of residence (%) - White
Place of birth - Born in state of residence (%) - Black or African American
Place of birth - Born in state of residence (%) - Asian
Place of birth - Born in state of residence (%) - Hispanic or Latino
Place of birth - Born in state of residence (%) - American Indian and Alaska Native
Place of birth - Born in state of residence (%) - Multirace
Place of birth - Born in state of residence (%) - Other Race
Place of birth - Born in other state (%)
Place of birth - Born in other state (%) - White
Place of birth - Born in other state (%) - Black or African American
Place of birth - Born in other state (%) - Asian
Place of birth - Born in other state (%) - Hispanic or Latino
Place of birth - Born in other state (%) - American Indian and Alaska Native
Place of birth - Born in other state (%) - Multirace
Place of birth - Born in other state (%) - Other Race
Place of birth - Native, outside of US (%)
Place of birth - Native, outside of US (%) - White
Place of birth - Native, outside of US (%) - Black or African American
Place of birth - Native, outside of US (%) - Asian
Place of birth - Native, outside of US (%) - Hispanic or Latino
Place of birth - Native, outside of US (%) - American Indian and Alaska Native
Place of birth - Native, outside of US (%) - Multirace
Place of birth - Native, outside of US (%) - Other Race
Place of birth - Foreign born (%)
Place of birth - Foreign born (%) - White
Place of birth - Foreign born (%) - Black or African American
Place of birth - Foreign born (%) - Asian
Place of birth - Foreign born (%) - Hispanic or Latino
Place of birth - Foreign born (%) - American Indian and Alaska Native
Place of birth - Foreign born (%) - Multirace
Place of birth - Foreign born (%) - Other Race
Residents speaking English at home (%)
Residents speaking English at home - Born in the United States (%)
Residents speaking English at home - Native, born elsewhere (%)
Residents speaking English at home - Foreign born (%)
Residents speaking Spanish at home (%)
Residents speaking Spanish at home - Born in the United States (%)
Residents speaking Spanish at home - Native, born elsewhere (%)
Residents speaking Spanish at home - Foreign born (%)
Residents speaking other language at home (%)
Residents speaking other language at home - Born in the United States (%)
Residents speaking other language at home - Native, born elsewhere (%)
Residents speaking other language at home - Foreign born (%)
Marital status - Never married (%)
Marital status - Now married (%)
Marital status - Separated (%)
Marital status - Widowed (%)
Marital status - Divorced (%)
Ancestries Reported - Arab (%)
Ancestries Reported - Czech (%)
Ancestries Reported - Danish (%)
Ancestries Reported - Dutch (%)
Ancestries Reported - English (%)
Ancestries Reported - French (%)
Ancestries Reported - French Canadian (%)
Ancestries Reported - German (%)
Ancestries Reported - Greek (%)
Ancestries Reported - Hungarian (%)
Ancestries Reported - Irish (%)
Ancestries Reported - Italian (%)
Ancestries Reported - Lithuanian (%)
Ancestries Reported - Norwegian (%)
Ancestries Reported - Polish (%)
Ancestries Reported - Portuguese (%)
Ancestries Reported - Russian (%)
Ancestries Reported - Scotch-Irish (%)
Ancestries Reported - Scottish (%)
Ancestries Reported - Slovak (%)
Ancestries Reported - Subsaharan African (%)
Ancestries Reported - Swedish (%)
Ancestries Reported - Swiss (%)
Ancestries Reported - Ukrainian (%)
Ancestries Reported - United States (%)
Ancestries Reported - Welsh (%)
Ancestries Reported - West Indian (%)
Ancestries Reported - Other (%)
Geographical mobility - Same house 1 year ago (%)
Geographical mobility - Same house 1 year ago (%) - White
Geographical mobility - Same house 1 year ago (%) - Black or African American
Geographical mobility - Same house 1 year ago (%) - Asian
Geographical mobility - Same house 1 year ago (%) - Hispanic or Latino
Geographical mobility - Same house 1 year ago (%) - American Indian and Alaska Native
Geographical mobility - Same house 1 year ago (%) - Multirace
Geographical mobility - Same house 1 year ago (%) - Other Race
Geographical mobility - Moved within same county (%)
Geographical mobility - Moved within same county (%) - White
Geographical mobility - Moved within same county (%) - Black or African American
Geographical mobility - Moved within same county (%) - Asian
Geographical mobility - Moved within same county (%) - Hispanic or Latino
Geographical mobility - Moved within same county (%) - American Indian and Alaska Native
Geographical mobility - Moved within same county (%) - Multirace
Geographical mobility - Moved within same county (%) - Other Race
Geographical mobility - Moved from different county within same state (%)
Geographical mobility - Moved from different county within same state (%) - White
Geographical mobility - Moved from different county within same state (%) - Black or African American
Geographical mobility - Moved from different county within same state (%) - Asian
Geographical mobility - Moved from different county within same state (%) - Hispanic or Latino
Geographical mobility - Moved from different county within same state (%) - American Indian and Alaska Native
Geographical mobility - Moved from different county within same state (%) - Multirace
Geographical mobility - Moved from different county within same state (%) - Other Race
Geographical mobility - Moved from different state (%)
Geographical mobility - Moved from different state (%) - White
Geographical mobility - Moved from different state (%) - Black or African American
Geographical mobility - Moved from different state (%) - Asian
Geographical mobility - Moved from different state (%) - Hispanic or Latino
Geographical mobility - Moved from different state (%) - American Indian and Alaska Native
Geographical mobility - Moved from different state (%) - Multirace
Geographical mobility - Moved from different state (%) - Other Race
Geographical mobility - Moved from abroad (%)
Geographical mobility - Moved from abroad (%) - White
Geographical mobility - Moved from abroad (%) - Black or African American
Geographical mobility - Moved from abroad (%) - Asian
Geographical mobility - Moved from abroad (%) - Hispanic or Latino
Geographical mobility - Moved from abroad (%) - American Indian and Alaska Native
Geographical mobility - Moved from abroad (%) - Multirace
Geographical mobility - Moved from abroad (%) - Other Race
Place of birth for the foreign-born population - Ireland (%)
Place of birth for the foreign-born population - Denmark (%)
Place of birth for the foreign-born population - Norway (%)
Place of birth for the foreign-born population - Sweden (%)
Place of birth for the foreign-born population - United Kingdom (%)
Place of birth for the foreign-born population - England (%)
Place of birth for the foreign-born population - Scotland (%)
Place of birth for the foreign-born population - Other Northern Europe (%)
Place of birth for the foreign-born population - Austria (%)
Place of birth for the foreign-born population - Belgium (%)
Place of birth for the foreign-born population - France (%)
Place of birth for the foreign-born population - Germany (%)
Place of birth for the foreign-born population - Netherlands (%)
Place of birth for the foreign-born population - Switzerland (%)
Place of birth for the foreign-born population - Other Western Europe (%)
Place of birth for the foreign-born population - Greece (%)
Place of birth for the foreign-born population - Italy (%)
Place of birth for the foreign-born population - Portugal (%)
Place of birth for the foreign-born population - Spain (%)
Place of birth for the foreign-born population - Other Southern Europe (%)
Place of birth for the foreign-born population - Albania (%)
Place of birth for the foreign-born population - Belarus (%)
Place of birth for the foreign-born population - Bosnia and Herzegovina (%)
Place of birth for the foreign-born population - Bulgaria (%)
Place of birth for the foreign-born population - Croatia (%)
Place of birth for the foreign-born population - Czechoslovakia (%)
Place of birth for the foreign-born population - Hungary (%)
Place of birth for the foreign-born population - Latvia (%)
Place of birth for the foreign-born population - Lithuania (%)
Place of birth for the foreign-born population - North Macedonia (Macedonia) (%)
Place of birth for the foreign-born population - Moldova (%)
Place of birth for the foreign-born population - Poland (%)
Place of birth for the foreign-born population - Romania (%)
Place of birth for the foreign-born population - Russia (%)
Place of birth for the foreign-born population - Serbia (%)
Place of birth for the foreign-born population - Ukraine (%)
Place of birth for the foreign-born population - Other Eastern Europe (%)
Place of birth for the foreign-born population - China (%)
Place of birth for the foreign-born population - Hong Kong (%)
Place of birth for the foreign-born population - Taiwan (%)
Place of birth for the foreign-born population - Japan (%)
Place of birth for the foreign-born population - Korea (%)
Place of birth for the foreign-born population - Other Eastern Asia (%)
Place of birth for the foreign-born population - Afghanistan (%)
Place of birth for the foreign-born population - Bangladesh (%)
Place of birth for the foreign-born population - India (%)
Place of birth for the foreign-born population - Iran (%)
Place of birth for the foreign-born population - Kazakhstan (%)
Place of birth for the foreign-born population - Nepal (%)
Place of birth for the foreign-born population - Pakistan (%)
Place of birth for the foreign-born population - Sri Lanka (%)
Place of birth for the foreign-born population - Uzbekistan (%)
Place of birth for the foreign-born population - Other South Central Asia (%)
Place of birth for the foreign-born population - Burma (%)
Place of birth for the foreign-born population - Cambodia (%)
Place of birth for the foreign-born population - Indonesia (%)
Place of birth for the foreign-born population - Laos (%)
Place of birth for the foreign-born population - Malaysia (%)
Place of birth for the foreign-born population - Philippines (%)
Place of birth for the foreign-born population - Singapore (%)
Place of birth for the foreign-born population - Thailand (%)
Place of birth for the foreign-born population - Vietnam (%)
Place of birth for the foreign-born population - Other South Eastern Asia (%)
Place of birth for the foreign-born population - Armenia (%)
Place of birth for the foreign-born population - Iraq (%)
Place of birth for the foreign-born population - Israel (%)
Place of birth for the foreign-born population - Jordan (%)
Place of birth for the foreign-born population - Kuwait (%)
Place of birth for the foreign-born population - Lebanon (%)
Place of birth for the foreign-born population - Saudi Arabia (%)
Place of birth for the foreign-born population - Syria (%)
Place of birth for the foreign-born population - Turkey (%)
Place of birth for the foreign-born population - Yemen (%)
Place of birth for the foreign-born population - Other Western Asia (%)
Place of birth for the foreign-born population - Eritrea (%)
Place of birth for the foreign-born population - Ethiopia (%)
Place of birth for the foreign-born population - Kenya (%)
Place of birth for the foreign-born population - Somalia (%)
Place of birth for the foreign-born population - Uganda (%)
Place of birth for the foreign-born population - Zimbabwe (%)
Place of birth for the foreign-born population - Other Eastern Africa (%)
Place of birth for the foreign-born population - Cameroon (%)
Place of birth for the foreign-born population - Congo (%)
Place of birth for the foreign-born population - Democratic Republic of Congo (Zaire) (%)
Place of birth for the foreign-born population - Other Middle Africa (%)
Place of birth for the foreign-born population - Egypt (%)
Place of birth for the foreign-born population - Morocco (%)
Place of birth for the foreign-born population - Sudan (%)
Place of birth for the foreign-born population - Other Northern Africa (%)
Place of birth for the foreign-born population - South Africa (%)
Place of birth for the foreign-born population - Other Southern Africa (%)
Place of birth for the foreign-born population - Cabo Verde (%)
Place of birth for the foreign-born population - Ghana (%)
Place of birth for the foreign-born population - Liberia (%)
Place of birth for the foreign-born population - Nigeria (%)
Place of birth for the foreign-born population - Senegal (%)
Place of birth for the foreign-born population - Sierra Leone (%)
Place of birth for the foreign-born population - Other Western Africa (%)
Place of birth for the foreign-born population - Australia (%)
Place of birth for the foreign-born population - New Zealand (%)
Place of birth for the foreign-born population - Fiji (%)
Place of birth for the foreign-born population - Micronesia (%)
Place of birth for the foreign-born population - Bahamas (%)
Place of birth for the foreign-born population - Barbados (%)
Place of birth for the foreign-born population - Cuba (%)
Place of birth for the foreign-born population - Dominica (%)
Place of birth for the foreign-born population - Dominican Republic (%)
Place of birth for the foreign-born population - Grenada (%)
Place of birth for the foreign-born population - Haiti (%)
Place of birth for the foreign-born population - Jamaica (%)
Place of birth for the foreign-born population - St. Vincent and the Grenadines (%)
Place of birth for the foreign-born population - Trinidad and Tobago (%)
Place of birth for the foreign-born population - West Indies (%)
Place of birth for the foreign-born population - Other Caribbean (%)
Place of birth for the foreign-born population - Belize (%)
Place of birth for the foreign-born population - Costa Rica (%)
Place of birth for the foreign-born population - El Salvador (%)
Place of birth for the foreign-born population - Guatemala (%)
Place of birth for the foreign-born population - Honduras (%)
Place of birth for the foreign-born population - Mexico (%)
Place of birth for the foreign-born population - Nicaragua (%)
Place of birth for the foreign-born population - Panama (%)
Place of birth for the foreign-born population - Other Central America (%)
Place of birth for the foreign-born population - Argentina (%)
Place of birth for the foreign-born population - Bolivia (%)
Place of birth for the foreign-born population - Brazil (%)
Place of birth for the foreign-born population - Chile (%)
Place of birth for the foreign-born population - Colombia (%)
Place of birth for the foreign-born population - Ecuador (%)
Place of birth for the foreign-born population - Guyana (%)
Place of birth for the foreign-born population - Peru (%)
Place of birth for the foreign-born population - Uruguay (%)
Place of birth for the foreign-born population - Venezuela (%)
Place of birth for the foreign-born population - Other South America (%)
Place of birth for the foreign-born population - Canada (%)
Place of birth for the foreign-born population - Other Northern America (%)
Place of birth for the foreign-born population - Other (%)
Latest news about races in Fullerton, CA collected exclusively by city-data.com from local newspapers, TV, and radio stations
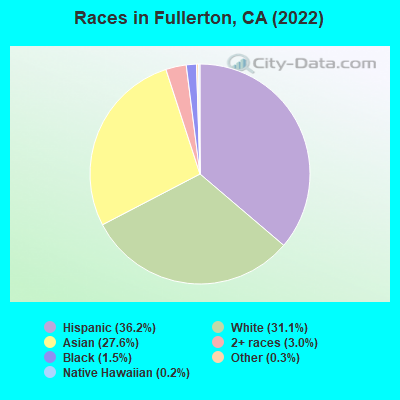
According to 2022 data, the most numerous races in Fullerton, CA are Hispanic (53,608 residents), White alone (44,946 residents), and Asian alone (33,392 residents). 54.2% of Fullerton residents speak English at home. 30.2% of Fullerton, CA residents are foreign-born (15.9% born in Asia, 12.0% born in Latin America), which is 14.0% greater than the foreign-born rate of 26.0% across the entire state of California.
Race distribution in Fullerton
2000 2022
61,420 48.7% White alone 38,014 30.2% Hispanic 20,130 16.0% Asian alone 2,872 2.3% Two or more races 2,675 2.1% Black alone 404 0.3% American Indian alone 237 0.2% Other race alone 251 0.2% Native Hawaiian and Other
53,608 38.6% Hispanic 44,946 32.4% White alone 33,392 24.0% Asian alone 5,268 3.8% Two or more races 1,730 1.2% Black alone 527 0.4% Other race alone 322 0.2% American Indian alone
2000 2022
15,816,790 46.7% White alone 10,966,556 32.4% Hispanic 3,648,860 10.8% Asian alone 2,181,926 6.4% Black alone 903,115 2.7% Two or more races 178,984 0.5% American Indian alone 103,736 0.3% Native Hawaiian and Other 71,681 0.2% Other race alone
15,732,184 40.3% Hispanic 13,160,426 33.7% White alone 5,957,867 15.3% Asian alone 2,025,218 5.2% Black alone 1,663,222 4.3% Two or more races 251,618 0.6% Other race alone 135,777 0.3% Native Hawaiian and Other 103,030 0.3% American Indian alone
Income and house value in Fullerton Median household income in 2022 $120,638 White non-Hispanic householders$127,525 Black householders$131,482 American Indian and Alaska Native householders$144,540 Asian householders$147,685 Native Hawaiian and other Pacific Islander householders$98,617 Some other race householders$75,447 Two or more races householders$89,690 Hispanic or Latino race householdersMedian 2022 house value $896,584 White Non-Hispanic householders$719,859 Black or African American householders$718,419 American Indian or Alaska Native householders over $1,000,000 Asian householders$838,276 Native Hawaiian and other Pacific Islander householders$663,710 Some other race householders$803,362 Two or more races householders$683,146 Hispanic or Latino householders
Median age by race in Fullerton
37.1 Median age for White residents36.4 37.6 42.1 Median age for Black or African American residents29.4 58.8 30.4 Median age for American Indian / Alaska Native residents61.5 24.5 43.3 Median age for Asian residents40.3 44.0 36.4 Median age for Native Hawaiian / Pacific Islander residents34.3 52.9 31.1 Median age for Other race residents31.6 30.1 27.5 Median age for Two or more races residents22.8 31.5 45.8 Median age for White alone residents45.0 46.3 28.3 Median age for Hispanic or Latino residents26.6 29.4
Owner/renter occupied households by race in Fullerton
House owners and renters - White residents 13,638 54.7% Owner occupied11,296 45.3% Renter occupiedHouse owners and renters - Black or African American residents 207 26.4% Owner occupied578 73.6% Renter occupiedHouse owners and renters - American Indian / Alaska Native residents 79 41.5% Owner occupied112 58.5% Renter occupiedHouse owners and renters - Asian residents 6,911 60.5% Owner occupied4,514 39.5% Renter occupiedHouse owners and renters - Native Hawaiian / Pacific Islander residents 96 69.6% Owner occupied42 30.4% Renter occupiedHouse owners and renters - Other race residents 968 33.6% Owner occupied1,910 66.4% Renter occupiedHouse owners and renters - Two or more races residents 1,922 43.1% Owner occupied2,537 56.9% Renter occupiedHouse owners and renters - White alone residents 11,957 63.7% Owner occupied6,812 36.3% Renter occupiedHouse owners and renters - Hispanic or Latino residents 4,242 32.8% Owner occupied8,680 67.2% Renter occupied
Language usage in Fullerton
English speakers - Total 54.2% of residents of Fullerton speak English at home.
24.5% of residents speak Spanish at home 19,680 60.9% Speak English very well12,614 39.1% Speak English less than very well21.4% of residents speak other language at home 15,435 54.9% Speak English very well12,686 45.1% Speak English less than very well
English speakers - Born in the United States 88.3% of residents of Fullerton speak English at home.
5.3% of residents speak Spanish at home 793 85.3% Speak English very well137 14.7% Speak English less than very well6.5% of residents speak other language at home 860 75.6% Speak English very well278 24.4% Speak English less than very well
English speakers - Native, born elsewhere 53.8% of residents of Fullerton speak English at home.
22.5% of residents speak Spanish at home 236 53.9% Speak English very well202 46.1% Speak English less than very well23.4% of residents speak other language at home 345 75.8% Speak English very well110 24.2% Speak English less than very well
English speakers - Foreign-born 13.1% of residents of Fullerton speak English at home.
35.8% of residents speak Spanish at home 4,697 31.7% Speak English very well10,111 68.3% Speak English less than very well51.6% of residents speak other language at home 9,815 45.9% Speak English very well11,561 54.1% Speak English less than very well
White (Caucasian) - Speak only English Native:
80.4% (46,867)Foreign-born:
17.0% (1,687)
White (Caucasian) - Speak another language Native:
18.4% (10,710)Foreign-born:
82.6% (8,205)
Black or African American - Speak only English Native:
92.7% (2,518)Foreign-born:
33.3% (173)
Black or African American - Speak another language Native:
7.4% (201)Foreign-born:
66.4% (345)
American Indian / Alaska Native - Speak only English Native:
70.9% (345)Foreign-born:
27.8% (15)
American Indian / Alaska Native - Speak another language Native:
23.0% (112)Foreign-born:
69.8% (39)
Asian - Speak only English Native:
53.8% (5,068)Foreign-born:
9.0% (2,007)
Asian - Speak another language Native:
45.9% (4,322)Foreign-born:
90.8% (20,202)
Native Hawaiian / Pacific Islander - Speak only English Native:
88.6% (287)Foreign-born:
100.0% (26)
Other race - Speak only English Native:
40.2% (2,244)Foreign-born:
8.9% (308)
Other race - Speak another language Native:
61.0% (3,407)Foreign-born:
92.1% (3,178)
Two or more races - Speak only English Native:
63.2% (9,375)Foreign-born:
31.5% (784)
Two or more races - Speak another language Native:
37.7% (5,589)Foreign-born:
59.7% (1,487)
White alone - Speak only English Native:
95.5% (38,281)Foreign-born:
31.1% (1,164)
White alone - Speak another language Native:
4.5% (1,788)Foreign-born:
68.9% (2,575)
Hispanic or Latino - Speak only English Native:
44.8% (15,711)Foreign-born:
8.3% (1,181)
Hispanic or Latino - Speak another language Native:
55.4% (19,409)Foreign-born:
92.4% (13,072)
Foreign-born residents in Fullerton 42,401 residents are foreign born (15.9% Asia , 12.0% Latin America ).
This city:
30.2%California:
100.0%
Marital status for residents in Fullerton Marital status - White (Caucasian) population 15 years and over
Males 41.5% Never married49.5% Now married0.3% Separated1.3% Widowed7.4% DivorcedFemales 33.3% Never married44.8% Now married1.5% Separated8.2% Widowed12.2% DivorcedWomen who gave birth in the past 12 months Now married:
81.4% (644)Unmarried:
18.6% (147)
Women who did not give birth in the past 12 months Now married:
39.2% (6,586)Unmarried:
60.8% (10,232)
Marital status - Black or African American population 15 years and over
Males 58.1% Never married30.3% Now married4.5% Separated0.3% Widowed6.8% DivorcedFemales 38.4% Never married38.3% Now married6.4% Separated5.6% Widowed11.4% DivorcedWomen who gave birth in the past 12 months Now married:
76.0% (17)Unmarried:
24.0% (5)
Women who did not give birth in the past 12 months Now married:
21.2% (116)Unmarried:
78.8% (432)
Marital status - American Indian / Alaska Native population 15 years and over
Males 25.6% Never married37.0% Now married0.0% Separated8.8% Widowed28.6% DivorcedFemales 22.4% Never married21.5% Now married9.6% Separated4.4% Widowed42.1% DivorcedWomen who did not give birth in the past 12 months Now married:
30.1% (29)Unmarried:
69.9% (68)
Marital status - Asian population 15 years and over
Males 27.1% Never married69.4% Now married0.0% Separated0.5% Widowed3.0% DivorcedFemales 26.1% Never married66.2% Now married1.5% Separated3.4% Widowed2.9% DivorcedWomen who gave birth in the past 12 months Now married:
100.0% (324)Unmarried:
0.0% (0)
Women who did not give birth in the past 12 months Now married:
53.3% (4,052)Unmarried:
46.7% (3,551)
Marital status - Native Hawaiian / Pacific Islander population 15 years and over
Males 50.9% Never married49.1% Now married0.0% Separated0.0% Widowed0.0% DivorcedFemales 32.4% Never married45.8% Now married14.2% Separated0.0% Widowed7.6% DivorcedWomen who did not give birth in the past 12 months Now married:
75.8% (95)Unmarried:
24.2% (30)
Marital status - Other race population 15 years and over
Males 41.1% Never married50.1% Now married5.0% Separated2.7% Widowed1.1% DivorcedFemales 23.5% Never married38.6% Now married7.6% Separated6.7% Widowed23.6% DivorcedWomen who gave birth in the past 12 months Now married:
97.6% (421)Unmarried:
2.4% (10)
Women who did not give birth in the past 12 months Now married:
42.7% (758)Unmarried:
57.3% (1,015)
Marital status - Two or more races population 15 years and over
Males 63.7% Never married30.2% Now married0.4% Separated1.0% Widowed4.7% DivorcedFemales 49.5% Never married33.0% Now married0.2% Separated5.2% Widowed12.1% DivorcedWomen who gave birth in the past 12 months Now married:
89.5% (149)Unmarried:
10.5% (18)
Women who did not give birth in the past 12 months Now married:
30.5% (1,459)Unmarried:
69.5% (3,317)
Marital status - White alone, not Hispanic / Latino population 15 years and over
Males 35.0% Never married52.2% Now married0.4% Separated2.2% Widowed10.3% DivorcedFemales 27.5% Never married47.1% Now married0.2% Separated10.3% Widowed14.9% DivorcedWomen who gave birth in the past 12 months Now married:
84.9% (637)Unmarried:
15.1% (113)
Women who did not give birth in the past 12 months Now married:
40.7% (4,013)Unmarried:
59.3% (5,852)
Marital status - Hispanic or Latino population 15 years and over
Males 49.5% Never married46.2% Now married1.1% Separated0.3% Widowed2.8% DivorcedFemales 40.5% Never married40.6% Now married3.9% Separated5.0% Widowed10.1% DivorcedWomen who gave birth in the past 12 months Now married:
87.0% (516)Unmarried:
13.0% (77)
Women who did not give birth in the past 12 months Now married:
37.8% (5,158)Unmarried:
62.2% (8,481)
Ancestries in Fullerton
3,013 3.6% American2,093 2.5% English1,925 2.3% European1,777 2.1% German1,719 2.1% Irish1,029 1.2% Italian423 0.5% Scottish400 0.5% Iranian383 0.5% Polish366 0.4% Romanian346 0.4% British332 0.4% Northern European279 0.3% Dutch257 0.3% Brazilian253 0.3% Norwegian226 0.3% Jamaican181 0.2% Eastern European176 0.2% French175 0.2% Russian174 0.2% French Canadian171 0.2% Hungarian164 0.2% Scotch-Irish153 0.2% Ethiopian147 0.2% Lebanese140 0.2% Greek133 0.2% Swedish123 0.1% African111 0.1% Armenian105 0.1% Ukrainian98 0.1% Canadian95 0.1% Portuguese94 0.1% Croatian86 0.1% Swiss82 0.10% Scandinavian80 0.10% Arab79 0.10% Belizean63 0.08% Egyptian62 0.07% Nigerian44 0.05% Kenyan42 0.05% Sudanese42 0.05% Welsh40 0.05% Lithuanian38 0.05% Austrian38 0.05% Basque37 0.04% Jordanian36 0.04% Czech34 0.04% Danish30 0.04% Bulgarian27 0.03% Cape Verdean24 0.03% Yugoslavian21 0.03% Syrian21 0.03% Turkish20 0.02% Belgian19 0.02% Assyrian17 0.02% Barbadian14 0.02% Guyanese12 0.01% Slovak10 0.01% Celtic6 0.01% Palestinian6 0.01% Czechoslovakian
Geographical mobility in Fullerton Same house 1 year ago 60,469 85.0% White (Caucasian)2,102 62.3% Black or African American543 75.0% American Indian / Alaska Native28,384 85.6% Asian337 85.1% Native Hawaiian / Pacific Islander12,654 86.7% Other race17,123 88.9% Two or more races37,519 86.9% White alone, not Hispanic / Latino44,538 85.6% Hispanic or LatinoMoved within same county 8,049 11.3% White / Caucasian571 16.9% Black or African American127 17.5% American Indian / Alaska Native2,605 7.9% Asian54 13.6% Native Hawaiian / Pacific Islander1,102 7.6% Other race1,569 8.1% Two or more races3,198 7.4% White alone, not Hispanic / Latino4,962 9.5% Hispanic or LatinoMoved within same state 1,691 2.4% White / Caucasian341 10.1% Black or African American38 5.2% American Indian / Alaska Native1,294 3.9% Asian662 4.5% Other race530 2.8% Two or more races1,837 4.3% White alone, not Hispanic / Latino1,909 3.7% Hispanic or LatinoMoved from different state 405 0.6% White / Caucasian267 7.9% Black or African American514 1.5% Asian46 0.3% Other race36 0.2% Two or more races501 1.2% White alone, not Hispanic / Latino218 0.4% Hispanic or LatinoMoved from abroad 144 0.2% White416 1.3% Asian19 0.1% Other race139 0.3% White alone, not Hispanic / Latino48 0.1% Hispanic or Latino
Children Nativity (place of birth) in Fullerton
Children under 6 years - Living with two parents Both parents native 4,010 100.0% NativeBoth parents foreign-born 2,504 100.0% NativeOne native, one foreign-born parent 2,143 100.0% NativeChildren under 6 years - Living with one parent Native parent 1,289 100.0% NativeForeign-born parent 292 100.0% NativeChildren 6 to 17 years - Living with two parents Both parents native 6,569 100.0% NativeBoth parents foreign-born 5,250 85.8% Native871 14.2% Foreign-bornOne native, one foreign-born parent 2,491 100.0% NativeChildren 6 to 17 years - Living with one parent Native parent 2,174 100.0% NativeForeign-born parent 1,667 57.1% Native1,252 42.9% Foreign-born
Place of birth for residents in Fullerton 22,425 Asia17,552 Americas17,008 Latin America15,232 Central America14,717 Eastern Asia4,849 South Eastern Asia3,575 China2,335 South Central Asia1,865 Europe1,544 South America701 Eastern Europe576 Northern Europe544 Northern America516 Western Asia492 Africa415 Western Europe230 Caribbean226 Eastern Africa172 Southern Europe138 Northern Africa86 Western Africa64 Oceania43 Australia and New Zealand Subregion34 Southern Africa13,703 Mexico10,659 Korea2,801 Philippines1,976 China1,635 India1,266 Taiwan1,215 Vietnam572 Guatemala555 Peru544 Canada485 El Salvador483 Japan406 Iran360 Nicaragua356 Romania333 Hong Kong302 Argentina287 United Kingdom261 Cambodia232 Germany226 Indonesia218 Brazil186 England140 Ethiopia136 Colombia122 Cuba114 France109 Laos106 Thailand102 Saudi Arabia94 Lebanon90 Italy89 Pakistan89 Egypt87 Chile81 Nepal80 Kuwait77 Kenya74 Jordan73 Bolivia68 Ecuador67 Jamaica67 Ukraine66 Hungary61 Uzbekistan56 Belize54 Malaysia53 Guyana48 Singapore45 Honduras41 Sudan41 Nigeria41 Bangladesh39 Russia38 Uruguay36 Poland35 Ireland35 Ghana34 South Africa34 Trinidad and Tobago34 Scotland33 Bulgaria32 Greece31 Portugal30 Australia28 Israel25 Burma23 Czechoslovakia21 Austria21 Denmark20 Sri Lanka20 Bosnia and Herzegovina19 Turkey18 Spain18 Syria17 Netherlands15 Switzerland14 Belgium13 New Zealand13 Armenia11 Sweden9 Cabo Verde9 Venezuela9 Panama8 Morocco7 Serbia6 Iraq6 Croatia
Grandparents responsible for own grandchildren in Fullerton
Grandparents (30 to 59 years) White / Caucasian 278 63.1% Responsible for grandchildren162 36.9% Not responsible for grandchildrenBlack or African American 31 41.6% Responsible for grandchildren43 58.4% Not responsible for grandchildrenAmerican Indian / Alaska Native 48 100.0% Responsible for grandchildrenAsian 24 100.0% Not responsible for grandchildrenOther race 178 44.9% Responsible for grandchildren218 55.1% Not responsible for grandchildrenWhite alone, not Hispanic / Latino 51 35.5% Responsible for grandchildren92 64.5% Not responsible for grandchildrenHispanic or Latino 303 36.3% Responsible for grandchildren532 63.7% Not responsible for grandchildrenGrandparents (60 years and over) White / Caucasian 323 39.2% Responsible for grandchildren502 60.8% Not responsible for grandchildrenBlack or African American 19 72.5% Responsible for grandchildren7 27.5% Not responsible for grandchildrenAmerican Indian / Alaska Native 40 100.0% Not responsible for grandchildrenAsian 129 13.5% Responsible for grandchildren831 86.5% Not responsible for grandchildrenOther race 74 31.6% Responsible for grandchildren161 68.4% Not responsible for grandchildrenWhite alone, not Hispanic / Latino 141 28.5% Responsible for grandchildren353 71.5% Not responsible for grandchildrenHispanic or Latino 132 19.3% Responsible for grandchildren554 80.7% Not responsible for grandchildren