Races in Garden City, Georgia (GA) Detailed Stats
Data:
Races - White alone (%)
Races - White alone (% change since 2000)
Races - Black alone (%)
Races - Black alone (% change since 2000)
Races - American Indian alone (%)
Races - American Indian alone (% change since 2000)
Races - Asian alone (%)
Races - Asian alone (% change since 2000)
Races - Hispanic (%)
Races - Hispanic (% change since 2000)
Races - Native Hawaiian and Other Pacific Islander alone (%)
Races - Native Hawaiian and Other Pacific Islander alone (% change since 2000)
Races - Two or more races(%)
Races - Two or more races(% change since 2000)
Races - Other race alone (%)
Races - Other race alone (% change since 2000)
Racial diversity
Place of birth - Born in state of residence (%)
Place of birth - Born in state of residence (%) - White
Place of birth - Born in state of residence (%) - Black or African American
Place of birth - Born in state of residence (%) - Asian
Place of birth - Born in state of residence (%) - Hispanic or Latino
Place of birth - Born in state of residence (%) - American Indian and Alaska Native
Place of birth - Born in state of residence (%) - Multirace
Place of birth - Born in state of residence (%) - Other Race
Place of birth - Born in other state (%)
Place of birth - Born in other state (%) - White
Place of birth - Born in other state (%) - Black or African American
Place of birth - Born in other state (%) - Asian
Place of birth - Born in other state (%) - Hispanic or Latino
Place of birth - Born in other state (%) - American Indian and Alaska Native
Place of birth - Born in other state (%) - Multirace
Place of birth - Born in other state (%) - Other Race
Place of birth - Native, outside of US (%)
Place of birth - Native, outside of US (%) - White
Place of birth - Native, outside of US (%) - Black or African American
Place of birth - Native, outside of US (%) - Asian
Place of birth - Native, outside of US (%) - Hispanic or Latino
Place of birth - Native, outside of US (%) - American Indian and Alaska Native
Place of birth - Native, outside of US (%) - Multirace
Place of birth - Native, outside of US (%) - Other Race
Place of birth - Foreign born (%)
Place of birth - Foreign born (%) - White
Place of birth - Foreign born (%) - Black or African American
Place of birth - Foreign born (%) - Asian
Place of birth - Foreign born (%) - Hispanic or Latino
Place of birth - Foreign born (%) - American Indian and Alaska Native
Place of birth - Foreign born (%) - Multirace
Place of birth - Foreign born (%) - Other Race
Residents speaking English at home (%)
Residents speaking English at home - Born in the United States (%)
Residents speaking English at home - Native, born elsewhere (%)
Residents speaking English at home - Foreign born (%)
Residents speaking Spanish at home (%)
Residents speaking Spanish at home - Born in the United States (%)
Residents speaking Spanish at home - Native, born elsewhere (%)
Residents speaking Spanish at home - Foreign born (%)
Residents speaking other language at home (%)
Residents speaking other language at home - Born in the United States (%)
Residents speaking other language at home - Native, born elsewhere (%)
Residents speaking other language at home - Foreign born (%)
Marital status - Never married (%)
Marital status - Now married (%)
Marital status - Separated (%)
Marital status - Widowed (%)
Marital status - Divorced (%)
Ancestries Reported - Arab (%)
Ancestries Reported - Czech (%)
Ancestries Reported - Danish (%)
Ancestries Reported - Dutch (%)
Ancestries Reported - English (%)
Ancestries Reported - French (%)
Ancestries Reported - French Canadian (%)
Ancestries Reported - German (%)
Ancestries Reported - Greek (%)
Ancestries Reported - Hungarian (%)
Ancestries Reported - Irish (%)
Ancestries Reported - Italian (%)
Ancestries Reported - Lithuanian (%)
Ancestries Reported - Norwegian (%)
Ancestries Reported - Polish (%)
Ancestries Reported - Portuguese (%)
Ancestries Reported - Russian (%)
Ancestries Reported - Scotch-Irish (%)
Ancestries Reported - Scottish (%)
Ancestries Reported - Slovak (%)
Ancestries Reported - Subsaharan African (%)
Ancestries Reported - Swedish (%)
Ancestries Reported - Swiss (%)
Ancestries Reported - Ukrainian (%)
Ancestries Reported - United States (%)
Ancestries Reported - Welsh (%)
Ancestries Reported - West Indian (%)
Ancestries Reported - Other (%)
Geographical mobility - Same house 1 year ago (%)
Geographical mobility - Same house 1 year ago (%) - White
Geographical mobility - Same house 1 year ago (%) - Black or African American
Geographical mobility - Same house 1 year ago (%) - Asian
Geographical mobility - Same house 1 year ago (%) - Hispanic or Latino
Geographical mobility - Same house 1 year ago (%) - American Indian and Alaska Native
Geographical mobility - Same house 1 year ago (%) - Multirace
Geographical mobility - Same house 1 year ago (%) - Other Race
Geographical mobility - Moved within same county (%)
Geographical mobility - Moved within same county (%) - White
Geographical mobility - Moved within same county (%) - Black or African American
Geographical mobility - Moved within same county (%) - Asian
Geographical mobility - Moved within same county (%) - Hispanic or Latino
Geographical mobility - Moved within same county (%) - American Indian and Alaska Native
Geographical mobility - Moved within same county (%) - Multirace
Geographical mobility - Moved within same county (%) - Other Race
Geographical mobility - Moved from different county within same state (%)
Geographical mobility - Moved from different county within same state (%) - White
Geographical mobility - Moved from different county within same state (%) - Black or African American
Geographical mobility - Moved from different county within same state (%) - Asian
Geographical mobility - Moved from different county within same state (%) - Hispanic or Latino
Geographical mobility - Moved from different county within same state (%) - American Indian and Alaska Native
Geographical mobility - Moved from different county within same state (%) - Multirace
Geographical mobility - Moved from different county within same state (%) - Other Race
Geographical mobility - Moved from different state (%)
Geographical mobility - Moved from different state (%) - White
Geographical mobility - Moved from different state (%) - Black or African American
Geographical mobility - Moved from different state (%) - Asian
Geographical mobility - Moved from different state (%) - Hispanic or Latino
Geographical mobility - Moved from different state (%) - American Indian and Alaska Native
Geographical mobility - Moved from different state (%) - Multirace
Geographical mobility - Moved from different state (%) - Other Race
Geographical mobility - Moved from abroad (%)
Geographical mobility - Moved from abroad (%) - White
Geographical mobility - Moved from abroad (%) - Black or African American
Geographical mobility - Moved from abroad (%) - Asian
Geographical mobility - Moved from abroad (%) - Hispanic or Latino
Geographical mobility - Moved from abroad (%) - American Indian and Alaska Native
Geographical mobility - Moved from abroad (%) - Multirace
Geographical mobility - Moved from abroad (%) - Other Race
Place of birth for the foreign-born population - Ireland (%)
Place of birth for the foreign-born population - Denmark (%)
Place of birth for the foreign-born population - Norway (%)
Place of birth for the foreign-born population - Sweden (%)
Place of birth for the foreign-born population - United Kingdom (%)
Place of birth for the foreign-born population - England (%)
Place of birth for the foreign-born population - Scotland (%)
Place of birth for the foreign-born population - Other Northern Europe (%)
Place of birth for the foreign-born population - Austria (%)
Place of birth for the foreign-born population - Belgium (%)
Place of birth for the foreign-born population - France (%)
Place of birth for the foreign-born population - Germany (%)
Place of birth for the foreign-born population - Netherlands (%)
Place of birth for the foreign-born population - Switzerland (%)
Place of birth for the foreign-born population - Other Western Europe (%)
Place of birth for the foreign-born population - Greece (%)
Place of birth for the foreign-born population - Italy (%)
Place of birth for the foreign-born population - Portugal (%)
Place of birth for the foreign-born population - Spain (%)
Place of birth for the foreign-born population - Other Southern Europe (%)
Place of birth for the foreign-born population - Albania (%)
Place of birth for the foreign-born population - Belarus (%)
Place of birth for the foreign-born population - Bosnia and Herzegovina (%)
Place of birth for the foreign-born population - Bulgaria (%)
Place of birth for the foreign-born population - Croatia (%)
Place of birth for the foreign-born population - Czechoslovakia (%)
Place of birth for the foreign-born population - Hungary (%)
Place of birth for the foreign-born population - Latvia (%)
Place of birth for the foreign-born population - Lithuania (%)
Place of birth for the foreign-born population - North Macedonia (Macedonia) (%)
Place of birth for the foreign-born population - Moldova (%)
Place of birth for the foreign-born population - Poland (%)
Place of birth for the foreign-born population - Romania (%)
Place of birth for the foreign-born population - Russia (%)
Place of birth for the foreign-born population - Serbia (%)
Place of birth for the foreign-born population - Ukraine (%)
Place of birth for the foreign-born population - Other Eastern Europe (%)
Place of birth for the foreign-born population - China (%)
Place of birth for the foreign-born population - Hong Kong (%)
Place of birth for the foreign-born population - Taiwan (%)
Place of birth for the foreign-born population - Japan (%)
Place of birth for the foreign-born population - Korea (%)
Place of birth for the foreign-born population - Other Eastern Asia (%)
Place of birth for the foreign-born population - Afghanistan (%)
Place of birth for the foreign-born population - Bangladesh (%)
Place of birth for the foreign-born population - India (%)
Place of birth for the foreign-born population - Iran (%)
Place of birth for the foreign-born population - Kazakhstan (%)
Place of birth for the foreign-born population - Nepal (%)
Place of birth for the foreign-born population - Pakistan (%)
Place of birth for the foreign-born population - Sri Lanka (%)
Place of birth for the foreign-born population - Uzbekistan (%)
Place of birth for the foreign-born population - Other South Central Asia (%)
Place of birth for the foreign-born population - Burma (%)
Place of birth for the foreign-born population - Cambodia (%)
Place of birth for the foreign-born population - Indonesia (%)
Place of birth for the foreign-born population - Laos (%)
Place of birth for the foreign-born population - Malaysia (%)
Place of birth for the foreign-born population - Philippines (%)
Place of birth for the foreign-born population - Singapore (%)
Place of birth for the foreign-born population - Thailand (%)
Place of birth for the foreign-born population - Vietnam (%)
Place of birth for the foreign-born population - Other South Eastern Asia (%)
Place of birth for the foreign-born population - Armenia (%)
Place of birth for the foreign-born population - Iraq (%)
Place of birth for the foreign-born population - Israel (%)
Place of birth for the foreign-born population - Jordan (%)
Place of birth for the foreign-born population - Kuwait (%)
Place of birth for the foreign-born population - Lebanon (%)
Place of birth for the foreign-born population - Saudi Arabia (%)
Place of birth for the foreign-born population - Syria (%)
Place of birth for the foreign-born population - Turkey (%)
Place of birth for the foreign-born population - Yemen (%)
Place of birth for the foreign-born population - Other Western Asia (%)
Place of birth for the foreign-born population - Eritrea (%)
Place of birth for the foreign-born population - Ethiopia (%)
Place of birth for the foreign-born population - Kenya (%)
Place of birth for the foreign-born population - Somalia (%)
Place of birth for the foreign-born population - Uganda (%)
Place of birth for the foreign-born population - Zimbabwe (%)
Place of birth for the foreign-born population - Other Eastern Africa (%)
Place of birth for the foreign-born population - Cameroon (%)
Place of birth for the foreign-born population - Congo (%)
Place of birth for the foreign-born population - Democratic Republic of Congo (Zaire) (%)
Place of birth for the foreign-born population - Other Middle Africa (%)
Place of birth for the foreign-born population - Egypt (%)
Place of birth for the foreign-born population - Morocco (%)
Place of birth for the foreign-born population - Sudan (%)
Place of birth for the foreign-born population - Other Northern Africa (%)
Place of birth for the foreign-born population - South Africa (%)
Place of birth for the foreign-born population - Other Southern Africa (%)
Place of birth for the foreign-born population - Cabo Verde (%)
Place of birth for the foreign-born population - Ghana (%)
Place of birth for the foreign-born population - Liberia (%)
Place of birth for the foreign-born population - Nigeria (%)
Place of birth for the foreign-born population - Senegal (%)
Place of birth for the foreign-born population - Sierra Leone (%)
Place of birth for the foreign-born population - Other Western Africa (%)
Place of birth for the foreign-born population - Australia (%)
Place of birth for the foreign-born population - New Zealand (%)
Place of birth for the foreign-born population - Fiji (%)
Place of birth for the foreign-born population - Micronesia (%)
Place of birth for the foreign-born population - Bahamas (%)
Place of birth for the foreign-born population - Barbados (%)
Place of birth for the foreign-born population - Cuba (%)
Place of birth for the foreign-born population - Dominica (%)
Place of birth for the foreign-born population - Dominican Republic (%)
Place of birth for the foreign-born population - Grenada (%)
Place of birth for the foreign-born population - Haiti (%)
Place of birth for the foreign-born population - Jamaica (%)
Place of birth for the foreign-born population - St. Vincent and the Grenadines (%)
Place of birth for the foreign-born population - Trinidad and Tobago (%)
Place of birth for the foreign-born population - West Indies (%)
Place of birth for the foreign-born population - Other Caribbean (%)
Place of birth for the foreign-born population - Belize (%)
Place of birth for the foreign-born population - Costa Rica (%)
Place of birth for the foreign-born population - El Salvador (%)
Place of birth for the foreign-born population - Guatemala (%)
Place of birth for the foreign-born population - Honduras (%)
Place of birth for the foreign-born population - Mexico (%)
Place of birth for the foreign-born population - Nicaragua (%)
Place of birth for the foreign-born population - Panama (%)
Place of birth for the foreign-born population - Other Central America (%)
Place of birth for the foreign-born population - Argentina (%)
Place of birth for the foreign-born population - Bolivia (%)
Place of birth for the foreign-born population - Brazil (%)
Place of birth for the foreign-born population - Chile (%)
Place of birth for the foreign-born population - Colombia (%)
Place of birth for the foreign-born population - Ecuador (%)
Place of birth for the foreign-born population - Guyana (%)
Place of birth for the foreign-born population - Peru (%)
Place of birth for the foreign-born population - Uruguay (%)
Place of birth for the foreign-born population - Venezuela (%)
Place of birth for the foreign-born population - Other South America (%)
Place of birth for the foreign-born population - Canada (%)
Place of birth for the foreign-born population - Other Northern America (%)
Place of birth for the foreign-born population - Other (%)
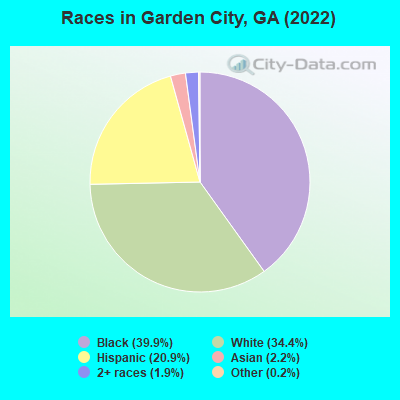
According to 2022 data, the most numerous races in Garden City, GA are White alone (3,619 residents), Black alone (4,198 residents), and Hispanic (2,196 residents). 84.9% of Garden City residents speak English at home. 12.6% of Garden City, GA residents are foreign-born (9.9% born in Latin America, 2.1% born in Asia), which is 20.7% greater than the foreign-born rate of 10.0% across the entire state of Georgia.
Race distribution in Garden City
2000 2022
5,128,661 62.6% White alone 2,331,465 28.5% Black alone 435,227 5.3% Hispanic 171,513 2.1% Asian alone 87,364 1.1% Two or more races 17,670 0.2% American Indian alone 11,275 0.1% Other race alone 3,278 0.04% Native Hawaiian and Other
5,415,657 49.6% White alone 3,349,240 30.7% Black alone 1,132,604 10.4% Hispanic 479,156 4.4% Asian alone 462,923 4.2% Two or more races 54,416 0.5% Other race alone 11,923 0.1% American Indian alone 6,957 0.06% Native Hawaiian and Other
Income and house value in Garden City Median household income in 2022 $46,745 White non-Hispanic householders$35,970 Black householders$112,735 Asian householders$53,573 Some other race householders$120,829 Two or more races householders$70,275 Hispanic or Latino race householdersMedian 2022 house value $217,120 White Non-Hispanic householders$163,429 Black or African American householders $248,810 Asian householders$117,857 Two or more races householders$199,834 Hispanic or Latino householders
Median age by race in Garden City
41.0 Median age for White residents38.4 42.9 30.0 Median age for Black or African American residents23.4 34.7 -588,353,413.1 Median age for American Indian / Alaska Native residents-487,455,196.6 -663,013,698.0 69.3 Median age for Asian residents-770,491,802.5 70.5 -657,243,815.6 Median age for Native Hawaiian / Pacific Islander residents-693,227,090.9 -776,776,776.0 29.5 Median age for Other race residents25.3 34.4 36.9 Median age for Two or more races residents40.4 34.8 46.5 Median age for White alone residents46.1 47.6 25.9 Median age for Hispanic or Latino residents24.9 30.0
Owner/renter occupied households by race in Garden City
House owners and renters - White residents 1,058 56.5% Owner occupied813 43.5% Renter occupiedHouse owners and renters - Black or African American residents 413 21.7% Owner occupied1,491 78.3% Renter occupiedHouse owners and renters - American Indian / Alaska Native residents 10 100.0% Renter occupiedHouse owners and renters - Asian residents 7 4.6% Owner occupied146 95.4% Renter occupiedHouse owners and renters - Other race residents 25 9.4% Owner occupied239 90.6% Renter occupiedHouse owners and renters - Two or more races residents 40 36.0% Owner occupied71 64.0% Renter occupiedHouse owners and renters - White alone residents 1,031 57.9% Owner occupied748 42.1% Renter occupiedHouse owners and renters - Hispanic or Latino residents 81 23.1% Owner occupied270 76.9% Renter occupied
Language usage in Garden City
English speakers - Total 84.9% of residents of Garden City speak English at home.
13.4% of residents speak Spanish at home 683 51.5% Speak English very well644 48.5% Speak English less than very well1.1% of residents speak other language at home 103 92.8% Speak English very well8 7.2% Speak English less than very well
English speakers - Born in the United States 94.1% of residents of Garden City speak English at home.
7.8% of residents speak Spanish at home 77 35.6% Speak English very well139 64.4% Speak English less than very well
English speakers - Native, born elsewhere 46.8% of residents of Garden City speak English at home.
42.6% of residents speak other language at home 20 100.0% Speak English very well
English speakers - Foreign-born 23.5% of residents of Garden City speak English at home.
68.6% of residents speak Spanish at home 448 51.2% Speak English very well427 48.8% Speak English less than very well5.6% of residents speak other language at home 64 90.1% Speak English very well7 9.9% Speak English less than very well
White (Caucasian) - Speak another language Native:
3.2% (117)Foreign-born:
92.6% (171)
Black or African American - Speak only English Native:
100.0% (3,956)Foreign-born:
96.4% (90)
Black or African American - Speak another language Native:
0.3% (10)Foreign-born:
12.2% (11)
Asian - Speak only English Native:
100.0% (4)Foreign-born:
100.0% (204)
Other race - Speak another language Native:
76.4% (531)Foreign-born:
99.6% (751)
Two or more races - Speak another language Native:
19.5% (65)Foreign-born:
100.0% (61)
White alone - Speak another language Native:
0.7% (23)Foreign-born:
66.5% (29)
Hispanic or Latino - Speak another language Native:
50.7% (498)Foreign-born:
94.7% (965)
Foreign-born residents in Garden City 1,326 residents are foreign born (9.9% Latin America , 2.1% Asia ).
This city:
12.6%Georgia:
10.4%
Marital status for residents in Garden City Marital status - White (Caucasian) population 15 years and over
Males 38.7% Never married41.0% Now married6.1% Separated2.8% Widowed11.5% DivorcedFemales 22.5% Never married36.9% Now married4.9% Separated19.0% Widowed16.7% DivorcedWomen who gave birth in the past 12 months Now married:
0.0% (0)Unmarried:
100.0% (37)
Women who did not give birth in the past 12 months Now married:
44.2% (435)Unmarried:
55.8% (550)
Marital status - Black or African American population 15 years and over
Males 58.5% Never married22.1% Now married0.0% Separated0.3% Widowed19.1% DivorcedFemales 59.7% Never married19.2% Now married4.2% Separated6.5% Widowed10.4% DivorcedWomen who gave birth in the past 12 months Now married:
100.0% (46)Unmarried:
0.0% (0)
Women who did not give birth in the past 12 months Now married:
15.7% (227)Unmarried:
84.3% (1,216)
Marital status - Asian population 15 years and over
Males 0.0% Never married100.0% Now married0.0% Separated0.0% Widowed0.0% DivorcedFemales 6.2% Never married88.0% Now married0.0% Separated5.7% Widowed0.0% DivorcedWomen who did not give birth in the past 12 months Now married:
71.7% (34)Unmarried:
28.3% (13)
Marital status - Other race population 15 years and over
Males 68.9% Never married7.7% Now married6.1% Separated6.6% Widowed10.8% DivorcedFemales 66.7% Never married27.9% Now married5.5% Separated0.0% Widowed0.0% DivorcedWomen who gave birth in the past 12 months Now married:
0.0% (0)Unmarried:
100.0% (62)
Women who did not give birth in the past 12 months Now married:
92.4% (95)Unmarried:
7.6% (8)
Marital status - Two or more races population 15 years and over
Males 66.7% Never married27.5% Now married0.0% Separated0.0% Widowed5.8% DivorcedFemales 20.0% Never married40.0% Now married7.8% Separated32.2% Widowed0.0% DivorcedWomen who gave birth in the past 12 months Now married:
0.0% (0)Unmarried:
100.0% (25)
Women who did not give birth in the past 12 months Now married:
67.9% (57)Unmarried:
32.1% (27)
Marital status - White alone, not Hispanic / Latino population 15 years and over
Males 39.6% Never married41.3% Now married6.5% Separated3.0% Widowed9.6% DivorcedFemales 17.6% Never married36.3% Now married5.6% Separated21.6% Widowed19.0% DivorcedWomen who gave birth in the past 12 months Now married:
0.0% (0)Unmarried:
100.0% (38)
Women who did not give birth in the past 12 months Now married:
44.8% (359)Unmarried:
55.2% (442)
Marital status - Hispanic or Latino population 15 years and over
Males 61.6% Never married14.5% Now married4.6% Separated5.6% Widowed13.6% DivorcedFemales 56.4% Never married36.4% Now married3.8% Separated3.4% Widowed0.0% DivorcedWomen who gave birth in the past 12 months Now married:
0.0% (0)Unmarried:
100.0% (68)
Women who did not give birth in the past 12 months Now married:
58.9% (209)Unmarried:
41.1% (146)
Ancestries in Garden City
430 6.6% Irish265 4.0% English258 3.9% American131 2.0% German97 1.5% African86 1.3% Scottish60 0.9% Italian54 0.8% Norwegian34 0.5% Barbadian32 0.5% French17 0.3% Scotch-Irish15 0.2% European15 0.2% Jamaican3 0.05% Ukrainian
Children Nativity (place of birth) in Garden City
Children under 6 years - Living with two parents Both parents native 188 100.0% NativeBoth parents foreign-born 36 100.0% NativeChildren under 6 years - Living with one parent Native parent 296 100.0% NativeForeign-born parent 145 100.0% NativeChildren 6 to 17 years - Living with two parents Both parents native 216 100.0% NativeBoth parents foreign-born 52 80.2% Native13 19.8% Foreign-bornOne native, one foreign-born parent 134 100.0% NativeChildren 6 to 17 years - Living with one parent Native parent 1,266 100.0% NativeForeign-born parent 254 59.0% Native176 41.0% Foreign-born
Grandparents responsible for own grandchildren in Garden City
Grandparents (30 to 59 years) Black or African American 46 100.0% Responsible for grandchildrenOther race 58 100.0% Responsible for grandchildrenTwo or more races 62 100.0% Responsible for grandchildrenHispanic or Latino 90 100.0% Responsible for grandchildrenGrandparents (60 years and over) Black or African American 72 61.6% Responsible for grandchildren45 38.4% Not responsible for grandchildren