Races in Garden City, Idaho (ID) Detailed Stats
Data:
Races - White alone (%)
Races - White alone (% change since 2000)
Races - Black alone (%)
Races - Black alone (% change since 2000)
Races - American Indian alone (%)
Races - American Indian alone (% change since 2000)
Races - Asian alone (%)
Races - Asian alone (% change since 2000)
Races - Hispanic (%)
Races - Hispanic (% change since 2000)
Races - Native Hawaiian and Other Pacific Islander alone (%)
Races - Native Hawaiian and Other Pacific Islander alone (% change since 2000)
Races - Two or more races(%)
Races - Two or more races(% change since 2000)
Races - Other race alone (%)
Races - Other race alone (% change since 2000)
Racial diversity
Place of birth - Born in state of residence (%)
Place of birth - Born in state of residence (%) - White
Place of birth - Born in state of residence (%) - Black or African American
Place of birth - Born in state of residence (%) - Asian
Place of birth - Born in state of residence (%) - Hispanic or Latino
Place of birth - Born in state of residence (%) - American Indian and Alaska Native
Place of birth - Born in state of residence (%) - Multirace
Place of birth - Born in state of residence (%) - Other Race
Place of birth - Born in other state (%)
Place of birth - Born in other state (%) - White
Place of birth - Born in other state (%) - Black or African American
Place of birth - Born in other state (%) - Asian
Place of birth - Born in other state (%) - Hispanic or Latino
Place of birth - Born in other state (%) - American Indian and Alaska Native
Place of birth - Born in other state (%) - Multirace
Place of birth - Born in other state (%) - Other Race
Place of birth - Native, outside of US (%)
Place of birth - Native, outside of US (%) - White
Place of birth - Native, outside of US (%) - Black or African American
Place of birth - Native, outside of US (%) - Asian
Place of birth - Native, outside of US (%) - Hispanic or Latino
Place of birth - Native, outside of US (%) - American Indian and Alaska Native
Place of birth - Native, outside of US (%) - Multirace
Place of birth - Native, outside of US (%) - Other Race
Place of birth - Foreign born (%)
Place of birth - Foreign born (%) - White
Place of birth - Foreign born (%) - Black or African American
Place of birth - Foreign born (%) - Asian
Place of birth - Foreign born (%) - Hispanic or Latino
Place of birth - Foreign born (%) - American Indian and Alaska Native
Place of birth - Foreign born (%) - Multirace
Place of birth - Foreign born (%) - Other Race
Residents speaking English at home (%)
Residents speaking English at home - Born in the United States (%)
Residents speaking English at home - Native, born elsewhere (%)
Residents speaking English at home - Foreign born (%)
Residents speaking Spanish at home (%)
Residents speaking Spanish at home - Born in the United States (%)
Residents speaking Spanish at home - Native, born elsewhere (%)
Residents speaking Spanish at home - Foreign born (%)
Residents speaking other language at home (%)
Residents speaking other language at home - Born in the United States (%)
Residents speaking other language at home - Native, born elsewhere (%)
Residents speaking other language at home - Foreign born (%)
Marital status - Never married (%)
Marital status - Now married (%)
Marital status - Separated (%)
Marital status - Widowed (%)
Marital status - Divorced (%)
Ancestries Reported - Arab (%)
Ancestries Reported - Czech (%)
Ancestries Reported - Danish (%)
Ancestries Reported - Dutch (%)
Ancestries Reported - English (%)
Ancestries Reported - French (%)
Ancestries Reported - French Canadian (%)
Ancestries Reported - German (%)
Ancestries Reported - Greek (%)
Ancestries Reported - Hungarian (%)
Ancestries Reported - Irish (%)
Ancestries Reported - Italian (%)
Ancestries Reported - Lithuanian (%)
Ancestries Reported - Norwegian (%)
Ancestries Reported - Polish (%)
Ancestries Reported - Portuguese (%)
Ancestries Reported - Russian (%)
Ancestries Reported - Scotch-Irish (%)
Ancestries Reported - Scottish (%)
Ancestries Reported - Slovak (%)
Ancestries Reported - Subsaharan African (%)
Ancestries Reported - Swedish (%)
Ancestries Reported - Swiss (%)
Ancestries Reported - Ukrainian (%)
Ancestries Reported - United States (%)
Ancestries Reported - Welsh (%)
Ancestries Reported - West Indian (%)
Ancestries Reported - Other (%)
Geographical mobility - Same house 1 year ago (%)
Geographical mobility - Same house 1 year ago (%) - White
Geographical mobility - Same house 1 year ago (%) - Black or African American
Geographical mobility - Same house 1 year ago (%) - Asian
Geographical mobility - Same house 1 year ago (%) - Hispanic or Latino
Geographical mobility - Same house 1 year ago (%) - American Indian and Alaska Native
Geographical mobility - Same house 1 year ago (%) - Multirace
Geographical mobility - Same house 1 year ago (%) - Other Race
Geographical mobility - Moved within same county (%)
Geographical mobility - Moved within same county (%) - White
Geographical mobility - Moved within same county (%) - Black or African American
Geographical mobility - Moved within same county (%) - Asian
Geographical mobility - Moved within same county (%) - Hispanic or Latino
Geographical mobility - Moved within same county (%) - American Indian and Alaska Native
Geographical mobility - Moved within same county (%) - Multirace
Geographical mobility - Moved within same county (%) - Other Race
Geographical mobility - Moved from different county within same state (%)
Geographical mobility - Moved from different county within same state (%) - White
Geographical mobility - Moved from different county within same state (%) - Black or African American
Geographical mobility - Moved from different county within same state (%) - Asian
Geographical mobility - Moved from different county within same state (%) - Hispanic or Latino
Geographical mobility - Moved from different county within same state (%) - American Indian and Alaska Native
Geographical mobility - Moved from different county within same state (%) - Multirace
Geographical mobility - Moved from different county within same state (%) - Other Race
Geographical mobility - Moved from different state (%)
Geographical mobility - Moved from different state (%) - White
Geographical mobility - Moved from different state (%) - Black or African American
Geographical mobility - Moved from different state (%) - Asian
Geographical mobility - Moved from different state (%) - Hispanic or Latino
Geographical mobility - Moved from different state (%) - American Indian and Alaska Native
Geographical mobility - Moved from different state (%) - Multirace
Geographical mobility - Moved from different state (%) - Other Race
Geographical mobility - Moved from abroad (%)
Geographical mobility - Moved from abroad (%) - White
Geographical mobility - Moved from abroad (%) - Black or African American
Geographical mobility - Moved from abroad (%) - Asian
Geographical mobility - Moved from abroad (%) - Hispanic or Latino
Geographical mobility - Moved from abroad (%) - American Indian and Alaska Native
Geographical mobility - Moved from abroad (%) - Multirace
Geographical mobility - Moved from abroad (%) - Other Race
Place of birth for the foreign-born population - Ireland (%)
Place of birth for the foreign-born population - Denmark (%)
Place of birth for the foreign-born population - Norway (%)
Place of birth for the foreign-born population - Sweden (%)
Place of birth for the foreign-born population - United Kingdom (%)
Place of birth for the foreign-born population - England (%)
Place of birth for the foreign-born population - Scotland (%)
Place of birth for the foreign-born population - Other Northern Europe (%)
Place of birth for the foreign-born population - Austria (%)
Place of birth for the foreign-born population - Belgium (%)
Place of birth for the foreign-born population - France (%)
Place of birth for the foreign-born population - Germany (%)
Place of birth for the foreign-born population - Netherlands (%)
Place of birth for the foreign-born population - Switzerland (%)
Place of birth for the foreign-born population - Other Western Europe (%)
Place of birth for the foreign-born population - Greece (%)
Place of birth for the foreign-born population - Italy (%)
Place of birth for the foreign-born population - Portugal (%)
Place of birth for the foreign-born population - Spain (%)
Place of birth for the foreign-born population - Other Southern Europe (%)
Place of birth for the foreign-born population - Albania (%)
Place of birth for the foreign-born population - Belarus (%)
Place of birth for the foreign-born population - Bosnia and Herzegovina (%)
Place of birth for the foreign-born population - Bulgaria (%)
Place of birth for the foreign-born population - Croatia (%)
Place of birth for the foreign-born population - Czechoslovakia (%)
Place of birth for the foreign-born population - Hungary (%)
Place of birth for the foreign-born population - Latvia (%)
Place of birth for the foreign-born population - Lithuania (%)
Place of birth for the foreign-born population - North Macedonia (Macedonia) (%)
Place of birth for the foreign-born population - Moldova (%)
Place of birth for the foreign-born population - Poland (%)
Place of birth for the foreign-born population - Romania (%)
Place of birth for the foreign-born population - Russia (%)
Place of birth for the foreign-born population - Serbia (%)
Place of birth for the foreign-born population - Ukraine (%)
Place of birth for the foreign-born population - Other Eastern Europe (%)
Place of birth for the foreign-born population - China (%)
Place of birth for the foreign-born population - Hong Kong (%)
Place of birth for the foreign-born population - Taiwan (%)
Place of birth for the foreign-born population - Japan (%)
Place of birth for the foreign-born population - Korea (%)
Place of birth for the foreign-born population - Other Eastern Asia (%)
Place of birth for the foreign-born population - Afghanistan (%)
Place of birth for the foreign-born population - Bangladesh (%)
Place of birth for the foreign-born population - India (%)
Place of birth for the foreign-born population - Iran (%)
Place of birth for the foreign-born population - Kazakhstan (%)
Place of birth for the foreign-born population - Nepal (%)
Place of birth for the foreign-born population - Pakistan (%)
Place of birth for the foreign-born population - Sri Lanka (%)
Place of birth for the foreign-born population - Uzbekistan (%)
Place of birth for the foreign-born population - Other South Central Asia (%)
Place of birth for the foreign-born population - Burma (%)
Place of birth for the foreign-born population - Cambodia (%)
Place of birth for the foreign-born population - Indonesia (%)
Place of birth for the foreign-born population - Laos (%)
Place of birth for the foreign-born population - Malaysia (%)
Place of birth for the foreign-born population - Philippines (%)
Place of birth for the foreign-born population - Singapore (%)
Place of birth for the foreign-born population - Thailand (%)
Place of birth for the foreign-born population - Vietnam (%)
Place of birth for the foreign-born population - Other South Eastern Asia (%)
Place of birth for the foreign-born population - Armenia (%)
Place of birth for the foreign-born population - Iraq (%)
Place of birth for the foreign-born population - Israel (%)
Place of birth for the foreign-born population - Jordan (%)
Place of birth for the foreign-born population - Kuwait (%)
Place of birth for the foreign-born population - Lebanon (%)
Place of birth for the foreign-born population - Saudi Arabia (%)
Place of birth for the foreign-born population - Syria (%)
Place of birth for the foreign-born population - Turkey (%)
Place of birth for the foreign-born population - Yemen (%)
Place of birth for the foreign-born population - Other Western Asia (%)
Place of birth for the foreign-born population - Eritrea (%)
Place of birth for the foreign-born population - Ethiopia (%)
Place of birth for the foreign-born population - Kenya (%)
Place of birth for the foreign-born population - Somalia (%)
Place of birth for the foreign-born population - Uganda (%)
Place of birth for the foreign-born population - Zimbabwe (%)
Place of birth for the foreign-born population - Other Eastern Africa (%)
Place of birth for the foreign-born population - Cameroon (%)
Place of birth for the foreign-born population - Congo (%)
Place of birth for the foreign-born population - Democratic Republic of Congo (Zaire) (%)
Place of birth for the foreign-born population - Other Middle Africa (%)
Place of birth for the foreign-born population - Egypt (%)
Place of birth for the foreign-born population - Morocco (%)
Place of birth for the foreign-born population - Sudan (%)
Place of birth for the foreign-born population - Other Northern Africa (%)
Place of birth for the foreign-born population - South Africa (%)
Place of birth for the foreign-born population - Other Southern Africa (%)
Place of birth for the foreign-born population - Cabo Verde (%)
Place of birth for the foreign-born population - Ghana (%)
Place of birth for the foreign-born population - Liberia (%)
Place of birth for the foreign-born population - Nigeria (%)
Place of birth for the foreign-born population - Senegal (%)
Place of birth for the foreign-born population - Sierra Leone (%)
Place of birth for the foreign-born population - Other Western Africa (%)
Place of birth for the foreign-born population - Australia (%)
Place of birth for the foreign-born population - New Zealand (%)
Place of birth for the foreign-born population - Fiji (%)
Place of birth for the foreign-born population - Micronesia (%)
Place of birth for the foreign-born population - Bahamas (%)
Place of birth for the foreign-born population - Barbados (%)
Place of birth for the foreign-born population - Cuba (%)
Place of birth for the foreign-born population - Dominica (%)
Place of birth for the foreign-born population - Dominican Republic (%)
Place of birth for the foreign-born population - Grenada (%)
Place of birth for the foreign-born population - Haiti (%)
Place of birth for the foreign-born population - Jamaica (%)
Place of birth for the foreign-born population - St. Vincent and the Grenadines (%)
Place of birth for the foreign-born population - Trinidad and Tobago (%)
Place of birth for the foreign-born population - West Indies (%)
Place of birth for the foreign-born population - Other Caribbean (%)
Place of birth for the foreign-born population - Belize (%)
Place of birth for the foreign-born population - Costa Rica (%)
Place of birth for the foreign-born population - El Salvador (%)
Place of birth for the foreign-born population - Guatemala (%)
Place of birth for the foreign-born population - Honduras (%)
Place of birth for the foreign-born population - Mexico (%)
Place of birth for the foreign-born population - Nicaragua (%)
Place of birth for the foreign-born population - Panama (%)
Place of birth for the foreign-born population - Other Central America (%)
Place of birth for the foreign-born population - Argentina (%)
Place of birth for the foreign-born population - Bolivia (%)
Place of birth for the foreign-born population - Brazil (%)
Place of birth for the foreign-born population - Chile (%)
Place of birth for the foreign-born population - Colombia (%)
Place of birth for the foreign-born population - Ecuador (%)
Place of birth for the foreign-born population - Guyana (%)
Place of birth for the foreign-born population - Peru (%)
Place of birth for the foreign-born population - Uruguay (%)
Place of birth for the foreign-born population - Venezuela (%)
Place of birth for the foreign-born population - Other South America (%)
Place of birth for the foreign-born population - Canada (%)
Place of birth for the foreign-born population - Other Northern America (%)
Place of birth for the foreign-born population - Other (%)
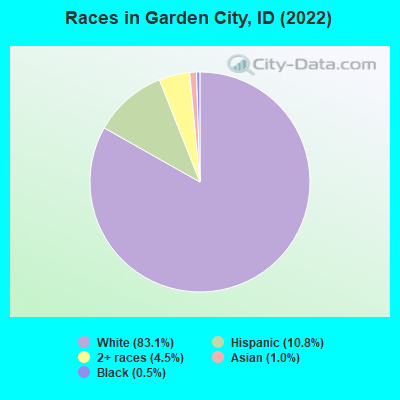
According to 2022 data, the most numerous races in Garden City, ID are White alone (10,659 residents), Hispanic (1,389 residents), and Two or more races (581 residents). 89.5% of Garden City residents speak English at home. 6.1% of Garden City, ID residents are foreign-born (2.6% born in Latin America, 2.6% born in Europe, 0.8% born in North America), which is 18.7% greater than the foreign-born rate of 5.0% across the entire state of Idaho.
Race distribution in Garden City
2000 2022
1,139,291 88.0% White alone 101,690 7.9% Hispanic 18,261 1.4% Two or more races 15,789 1.2% American Indian alone 11,641 0.9% Asian alone 4,889 0.4% Black alone 1,192 0.09% Other race alone 1,200 0.09% Native Hawaiian and Other
1,531,219 79.0% White alone 261,921 13.5% Hispanic 81,112 4.2% Two or more races 25,174 1.3% Asian alone 15,825 0.8% American Indian alone 11,868 0.6% Black alone 8,752 0.5% Other race alone 3,162 0.2% Native Hawaiian and Other
Income and house value in Garden City Median household income in 2022 $68,207 White non-Hispanic householders$22,674 Black householders$171,840 Asian householders$70,174 Some other race householders$63,055 Two or more races householders$44,755 Hispanic or Latino race householdersMedian 2022 house value $652,932 White Non-Hispanic householders$539,532 Black or African American householders$518,343 American Indian or Alaska Native householders $539,532 Asian householders$339,415 Two or more races householders$574,455 Hispanic or Latino householders
Median age by race in Garden City
50.8 Median age for White residents49.5 51.1 24.4 Median age for Black or African American residents-776,190,475.4 16.3 -733,529,989.4 Median age for American Indian / Alaska Native residents-735,294,116.9 -682,399,212.7 20.1 Median age for Asian residents20.5 46.2 -587,719,297.7 Median age for Native Hawaiian / Pacific Islander residents-438,794,726.5 -1,099,502,486.5 29.1 Median age for Other race residents29.8 31.5 29.6 Median age for Two or more races residents27.6 47.0 51.4 Median age for White alone residents51.3 52.1 26.1 Median age for Hispanic or Latino residents25.2 29.3
Owner/renter occupied households by race in Garden City
House owners and renters - White residents 3,606 66.4% Owner occupied1,826 33.6% Renter occupiedHouse owners and renters - Black or African American residents 10 9.6% Owner occupied90 90.4% Renter occupiedHouse owners and renters - American Indian / Alaska Native residents 13 100.0% Owner occupiedHouse owners and renters - Asian residents 32 87.5% Owner occupied5 12.5% Renter occupiedHouse owners and renters - Other race residents 13 31.7% Owner occupied28 68.3% Renter occupiedHouse owners and renters - Two or more races residents 68 37.0% Owner occupied116 63.0% Renter occupiedHouse owners and renters - White alone residents 3,549 67.4% Owner occupied1,719 32.6% Renter occupiedHouse owners and renters - Hispanic or Latino residents 117 34.2% Owner occupied225 65.8% Renter occupied
Language usage in Garden City
English speakers - Total 89.5% of residents of Garden City speak English at home.
5.3% of residents speak Spanish at home 426 64.4% Speak English very well235 35.6% Speak English less than very well5.1% of residents speak other language at home 524 81.9% Speak English very well116 18.1% Speak English less than very well
English speakers - Born in the United States 96.6% of residents of Garden City speak English at home.
1.6% of residents speak Spanish at home 125 100.0% Speak English very well1.8% of residents speak other language at home 136 100.0% Speak English very well
English speakers - Native, born elsewhere 65.8% of residents of Garden City speak English at home.
49.0% of residents speak Spanish at home 44 45.8% Speak English very well52 54.2% Speak English less than very well
English speakers - Foreign-born 19.3% of residents of Garden City speak English at home.
43.2% of residents speak Spanish at home 146 39.5% Speak English very well224 60.5% Speak English less than very well37.6% of residents speak other language at home 204 63.4% Speak English very well118 36.6% Speak English less than very well
White (Caucasian) - Speak only English Native:
95.9% (9,840)Foreign-born:
21.9% (133)
White (Caucasian) - Speak another language Native:
3.7% (378)Foreign-born:
83.7% (508)
Other race - Speak another language Native:
77.1% (145)Foreign-born:
100.0% (83)
Two or more races - Speak another language Native:
4.1% (33)Foreign-born:
98.2% (31)
White alone - Speak only English Native:
96.1% (9,597)Foreign-born:
30.0% (137)
White alone - Speak another language Native:
3.7% (373)Foreign-born:
74.8% (343)
Hispanic or Latino - Speak another language Native:
25.1% (221)Foreign-born:
100.0% (371)
Foreign-born residents in Garden City 789 residents are foreign born (2.6% Latin America , 2.6% Europe , 0.8% North America ).
Marital status for residents in Garden City Marital status - White (Caucasian) population 15 years and over
Males 26.9% Never married54.4% Now married0.7% Separated1.6% Widowed16.5% DivorcedFemales 25.0% Never married43.8% Now married1.0% Separated12.8% Widowed17.5% DivorcedWomen who gave birth in the past 12 months Now married:
98.2% (161)Unmarried:
1.8% (3)
Women who did not give birth in the past 12 months Now married:
34.6% (746)Unmarried:
65.4% (1,410)
Marital status - Black or African American population 15 years and over
Males 100.0% Never married0.0% Now married0.0% Separated0.0% Widowed0.0% DivorcedFemales 100.0% Never married0.0% Now married0.0% Separated0.0% Widowed0.0% DivorcedWomen who did not give birth in the past 12 months Now married:
0.0% (0)Unmarried:
100.0% (40)
Marital status - Asian population 15 years and over
Males 69.2% Never married30.8% Now married0.0% Separated0.0% Widowed0.0% DivorcedFemales 0.0% Never married100.0% Now married0.0% Separated0.0% Widowed0.0% DivorcedWomen who did not give birth in the past 12 months Now married:
100.0% (32)Unmarried:
0.0% (0)
Marital status - Other race population 15 years and over
Males 68.6% Never married31.4% Now married0.0% Separated0.0% Widowed0.0% DivorcedFemales 29.6% Never married70.4% Now married0.0% Separated0.0% Widowed0.0% DivorcedWomen who gave birth in the past 12 months Now married:
100.0% (10)Unmarried:
0.0% (0)
Women who did not give birth in the past 12 months Now married:
52.1% (40)Unmarried:
47.9% (37)
Marital status - Two or more races population 15 years and over
Males 55.9% Never married27.9% Now married0.0% Separated0.0% Widowed16.2% DivorcedFemales 39.8% Never married37.5% Now married0.0% Separated9.2% Widowed13.4% DivorcedWomen who did not give birth in the past 12 months Now married:
34.4% (70)Unmarried:
65.6% (134)
Marital status - White alone, not Hispanic / Latino population 15 years and over
Males 26.7% Never married54.4% Now married0.7% Separated1.7% Widowed16.6% DivorcedFemales 23.3% Never married44.3% Now married1.1% Separated13.1% Widowed18.2% DivorcedWomen who gave birth in the past 12 months Now married:
96.8% (92)Unmarried:
3.2% (3)
Women who did not give birth in the past 12 months Now married:
36.0% (755)Unmarried:
64.0% (1,342)
Marital status - Hispanic or Latino population 15 years and over
Males 41.3% Never married48.2% Now married0.0% Separated0.0% Widowed10.5% DivorcedFemales 45.5% Never married40.3% Now married0.0% Separated7.8% Widowed6.4% DivorcedWomen who gave birth in the past 12 months Now married:
100.0% (86)Unmarried:
0.0% (0)
Women who did not give birth in the past 12 months Now married:
18.3% (41)Unmarried:
81.7% (182)
Ancestries in Garden City
718 13.8% English506 9.7% American443 8.5% European412 7.9% German388 7.5% Irish292 5.6% Norwegian126 2.4% Russian109 2.1% Italian105 2.0% Ukrainian79 1.5% Scottish74 1.4% Scandinavian71 1.4% Northern European61 1.2% French Canadian59 1.1% Polish54 1.0% Swedish53 1.0% Croatian52 1.0% Eastern European45 0.9% Dutch36 0.7% Canadian26 0.5% Basque26 0.5% Danish25 0.5% Scotch-Irish21 0.4% Portuguese21 0.4% Welsh18 0.3% Iranian16 0.3% British16 0.3% Yugoslavian12 0.2% Czechoslovakian11 0.2% Lithuanian10 0.2% Czech3 0.06% Serbian
Children Nativity (place of birth) in Garden City
Children under 6 years - Living with two parents Both parents native 204 100.0% NativeBoth parents foreign-born 221 100.0% NativeChildren under 6 years - Living with one parent Native parent 56 100.0% NativeChildren 6 to 17 years - Living with two parents Both parents native 881 99.1% Native8 0.9% Foreign-bornBoth parents foreign-born 249 72.8% Native93 27.2% Foreign-bornOne native, one foreign-born parent 62 100.0% NativeChildren 6 to 17 years - Living with one parent Native parent 497 100.0% Native
Grandparents responsible for own grandchildren in Garden City
Grandparents (30 to 59 years) White / Caucasian 8 100.0% Responsible for grandchildrenTwo or more races 47 100.0% Responsible for grandchildrenWhite alone, not Hispanic / Latino 8 100.0% Responsible for grandchildrenHispanic or Latino 30 100.0% Responsible for grandchildren
Grandparents (60 years and over) White / Caucasian 42 100.0% Not responsible for grandchildrenTwo or more races 1 100.0% Not responsible for grandchildrenWhite alone, not Hispanic / Latino 24 100.0% Not responsible for grandchildrenHispanic or Latino 8 100.0% Not responsible for grandchildren