Races in Garden City, New York (NY) Detailed Stats
Data:
Races - White alone (%)
Races - White alone (% change since 2000)
Races - Black alone (%)
Races - Black alone (% change since 2000)
Races - American Indian alone (%)
Races - American Indian alone (% change since 2000)
Races - Asian alone (%)
Races - Asian alone (% change since 2000)
Races - Hispanic (%)
Races - Hispanic (% change since 2000)
Races - Native Hawaiian and Other Pacific Islander alone (%)
Races - Native Hawaiian and Other Pacific Islander alone (% change since 2000)
Races - Two or more races(%)
Races - Two or more races(% change since 2000)
Races - Other race alone (%)
Races - Other race alone (% change since 2000)
Racial diversity
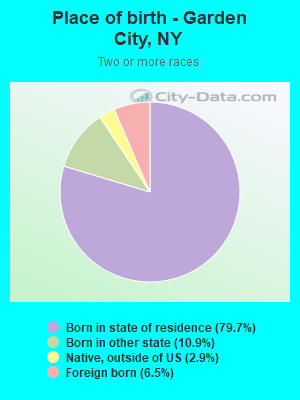
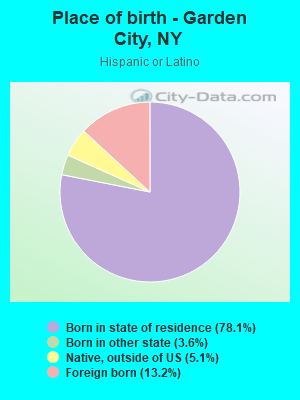
Place of birth - Born in state of residence (%)
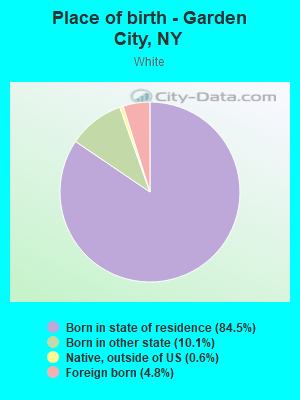
Place of birth - Born in state of residence (%) - White
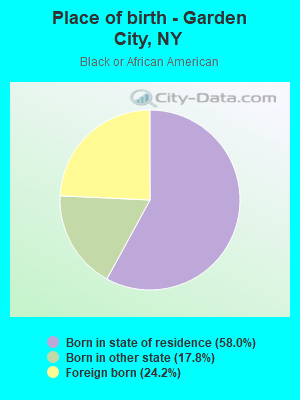
Place of birth - Born in state of residence (%) - Black or African American
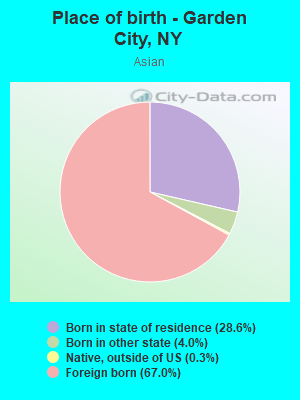
Place of birth - Born in state of residence (%) - Asian
Place of birth - Born in state of residence (%) - Hispanic or Latino
Place of birth - Born in state of residence (%) - American Indian and Alaska Native
Place of birth - Born in state of residence (%) - Multirace
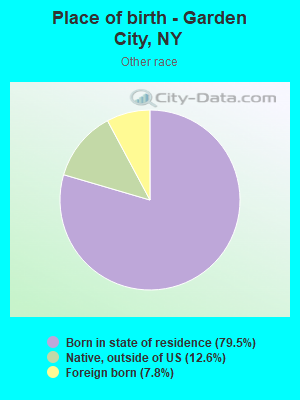
Place of birth - Born in state of residence (%) - Other Race
Place of birth - Born in other state (%)
Place of birth - Born in other state (%) - White
Place of birth - Born in other state (%) - Black or African American
Place of birth - Born in other state (%) - Asian
Place of birth - Born in other state (%) - Hispanic or Latino
Place of birth - Born in other state (%) - American Indian and Alaska Native
Place of birth - Born in other state (%) - Multirace
Place of birth - Born in other state (%) - Other Race
Place of birth - Native, outside of US (%)
Place of birth - Native, outside of US (%) - White
Place of birth - Native, outside of US (%) - Black or African American
Place of birth - Native, outside of US (%) - Asian
Place of birth - Native, outside of US (%) - Hispanic or Latino
Place of birth - Native, outside of US (%) - American Indian and Alaska Native
Place of birth - Native, outside of US (%) - Multirace
Place of birth - Native, outside of US (%) - Other Race
Place of birth - Foreign born (%)
Place of birth - Foreign born (%) - White
Place of birth - Foreign born (%) - Black or African American
Place of birth - Foreign born (%) - Asian
Place of birth - Foreign born (%) - Hispanic or Latino
Place of birth - Foreign born (%) - American Indian and Alaska Native
Place of birth - Foreign born (%) - Multirace
Place of birth - Foreign born (%) - Other Race
Residents speaking English at home (%)
Residents speaking English at home - Born in the United States (%)
Residents speaking English at home - Native, born elsewhere (%)
Residents speaking English at home - Foreign born (%)
Residents speaking Spanish at home (%)
Residents speaking Spanish at home - Born in the United States (%)
Residents speaking Spanish at home - Native, born elsewhere (%)
Residents speaking Spanish at home - Foreign born (%)
Residents speaking other language at home (%)
Residents speaking other language at home - Born in the United States (%)
Residents speaking other language at home - Native, born elsewhere (%)
Residents speaking other language at home - Foreign born (%)
Marital status - Never married (%)
Marital status - Now married (%)
Marital status - Separated (%)
Marital status - Widowed (%)
Marital status - Divorced (%)
Ancestries Reported - Arab (%)
Ancestries Reported - Czech (%)
Ancestries Reported - Danish (%)
Ancestries Reported - Dutch (%)
Ancestries Reported - English (%)
Ancestries Reported - French (%)
Ancestries Reported - French Canadian (%)
Ancestries Reported - German (%)
Ancestries Reported - Greek (%)
Ancestries Reported - Hungarian (%)
Ancestries Reported - Irish (%)
Ancestries Reported - Italian (%)
Ancestries Reported - Lithuanian (%)
Ancestries Reported - Norwegian (%)
Ancestries Reported - Polish (%)
Ancestries Reported - Portuguese (%)
Ancestries Reported - Russian (%)
Ancestries Reported - Scotch-Irish (%)
Ancestries Reported - Scottish (%)
Ancestries Reported - Slovak (%)
Ancestries Reported - Subsaharan African (%)
Ancestries Reported - Swedish (%)
Ancestries Reported - Swiss (%)
Ancestries Reported - Ukrainian (%)
Ancestries Reported - United States (%)
Ancestries Reported - Welsh (%)
Ancestries Reported - West Indian (%)
Ancestries Reported - Other (%)
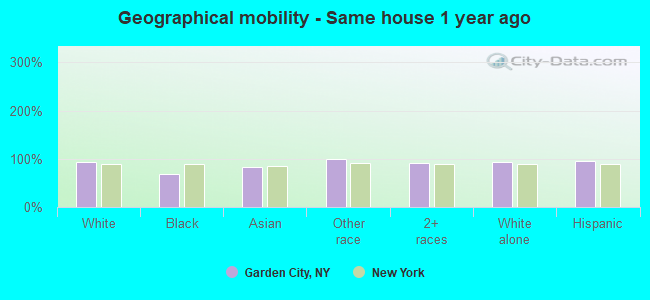
Geographical mobility - Same house 1 year ago (%)
Geographical mobility - Same house 1 year ago (%) - White
Geographical mobility - Same house 1 year ago (%) - Black or African American
Geographical mobility - Same house 1 year ago (%) - Asian
Geographical mobility - Same house 1 year ago (%) - Hispanic or Latino
Geographical mobility - Same house 1 year ago (%) - American Indian and Alaska Native
Geographical mobility - Same house 1 year ago (%) - Multirace
Geographical mobility - Same house 1 year ago (%) - Other Race
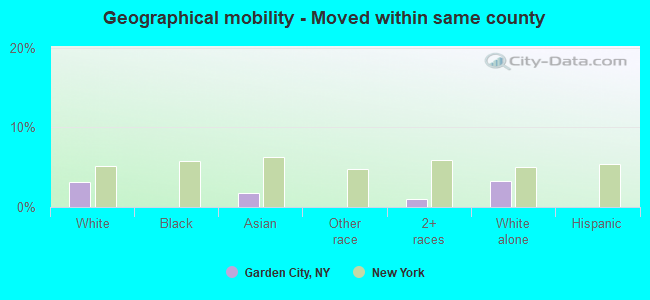
Geographical mobility - Moved within same county (%)
Geographical mobility - Moved within same county (%) - White
Geographical mobility - Moved within same county (%) - Black or African American
Geographical mobility - Moved within same county (%) - Asian
Geographical mobility - Moved within same county (%) - Hispanic or Latino
Geographical mobility - Moved within same county (%) - American Indian and Alaska Native
Geographical mobility - Moved within same county (%) - Multirace
Geographical mobility - Moved within same county (%) - Other Race
Geographical mobility - Moved from different county within same state (%)
Geographical mobility - Moved from different county within same state (%) - White
Geographical mobility - Moved from different county within same state (%) - Black or African American
Geographical mobility - Moved from different county within same state (%) - Asian
Geographical mobility - Moved from different county within same state (%) - Hispanic or Latino
Geographical mobility - Moved from different county within same state (%) - American Indian and Alaska Native
Geographical mobility - Moved from different county within same state (%) - Multirace
Geographical mobility - Moved from different county within same state (%) - Other Race
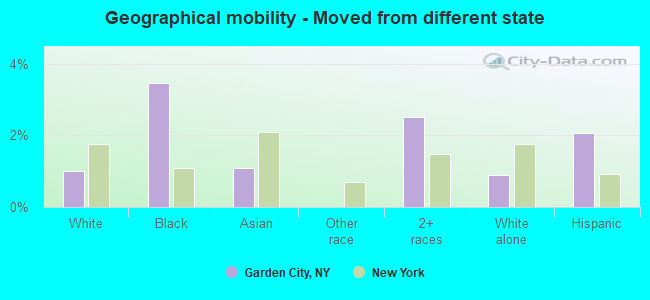
Geographical mobility - Moved from different state (%)
Geographical mobility - Moved from different state (%) - White
Geographical mobility - Moved from different state (%) - Black or African American
Geographical mobility - Moved from different state (%) - Asian
Geographical mobility - Moved from different state (%) - Hispanic or Latino
Geographical mobility - Moved from different state (%) - American Indian and Alaska Native
Geographical mobility - Moved from different state (%) - Multirace
Geographical mobility - Moved from different state (%) - Other Race
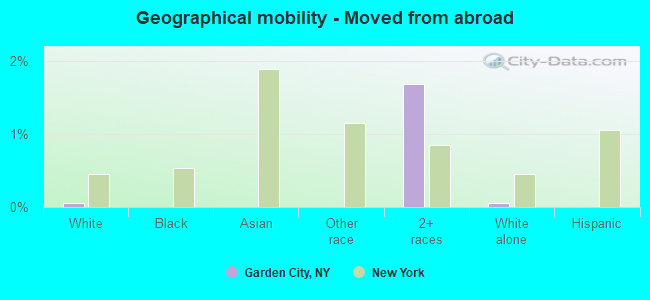
Geographical mobility - Moved from abroad (%)
Geographical mobility - Moved from abroad (%) - White
Geographical mobility - Moved from abroad (%) - Black or African American
Geographical mobility - Moved from abroad (%) - Asian
Geographical mobility - Moved from abroad (%) - Hispanic or Latino
Geographical mobility - Moved from abroad (%) - American Indian and Alaska Native
Geographical mobility - Moved from abroad (%) - Multirace
Geographical mobility - Moved from abroad (%) - Other Race
Place of birth for the foreign-born population - Ireland (%)
Place of birth for the foreign-born population - Denmark (%)
Place of birth for the foreign-born population - Norway (%)
Place of birth for the foreign-born population - Sweden (%)
Place of birth for the foreign-born population - United Kingdom (%)
Place of birth for the foreign-born population - England (%)
Place of birth for the foreign-born population - Scotland (%)
Place of birth for the foreign-born population - Other Northern Europe (%)
Place of birth for the foreign-born population - Austria (%)
Place of birth for the foreign-born population - Belgium (%)
Place of birth for the foreign-born population - France (%)
Place of birth for the foreign-born population - Germany (%)
Place of birth for the foreign-born population - Netherlands (%)
Place of birth for the foreign-born population - Switzerland (%)
Place of birth for the foreign-born population - Other Western Europe (%)
Place of birth for the foreign-born population - Greece (%)
Place of birth for the foreign-born population - Italy (%)
Place of birth for the foreign-born population - Portugal (%)
Place of birth for the foreign-born population - Spain (%)
Place of birth for the foreign-born population - Other Southern Europe (%)
Place of birth for the foreign-born population - Albania (%)
Place of birth for the foreign-born population - Belarus (%)
Place of birth for the foreign-born population - Bosnia and Herzegovina (%)
Place of birth for the foreign-born population - Bulgaria (%)
Place of birth for the foreign-born population - Croatia (%)
Place of birth for the foreign-born population - Czechoslovakia (%)
Place of birth for the foreign-born population - Hungary (%)
Place of birth for the foreign-born population - Latvia (%)
Place of birth for the foreign-born population - Lithuania (%)
Place of birth for the foreign-born population - North Macedonia (Macedonia) (%)
Place of birth for the foreign-born population - Moldova (%)
Place of birth for the foreign-born population - Poland (%)
Place of birth for the foreign-born population - Romania (%)
Place of birth for the foreign-born population - Russia (%)
Place of birth for the foreign-born population - Serbia (%)
Place of birth for the foreign-born population - Ukraine (%)
Place of birth for the foreign-born population - Other Eastern Europe (%)
Place of birth for the foreign-born population - China (%)
Place of birth for the foreign-born population - Hong Kong (%)
Place of birth for the foreign-born population - Taiwan (%)
Place of birth for the foreign-born population - Japan (%)
Place of birth for the foreign-born population - Korea (%)
Place of birth for the foreign-born population - Other Eastern Asia (%)
Place of birth for the foreign-born population - Afghanistan (%)
Place of birth for the foreign-born population - Bangladesh (%)
Place of birth for the foreign-born population - India (%)
Place of birth for the foreign-born population - Iran (%)
Place of birth for the foreign-born population - Kazakhstan (%)
Place of birth for the foreign-born population - Nepal (%)
Place of birth for the foreign-born population - Pakistan (%)
Place of birth for the foreign-born population - Sri Lanka (%)
Place of birth for the foreign-born population - Uzbekistan (%)
Place of birth for the foreign-born population - Other South Central Asia (%)
Place of birth for the foreign-born population - Burma (%)
Place of birth for the foreign-born population - Cambodia (%)
Place of birth for the foreign-born population - Indonesia (%)
Place of birth for the foreign-born population - Laos (%)
Place of birth for the foreign-born population - Malaysia (%)
Place of birth for the foreign-born population - Philippines (%)
Place of birth for the foreign-born population - Singapore (%)
Place of birth for the foreign-born population - Thailand (%)
Place of birth for the foreign-born population - Vietnam (%)
Place of birth for the foreign-born population - Other South Eastern Asia (%)
Place of birth for the foreign-born population - Armenia (%)
Place of birth for the foreign-born population - Iraq (%)
Place of birth for the foreign-born population - Israel (%)
Place of birth for the foreign-born population - Jordan (%)
Place of birth for the foreign-born population - Kuwait (%)
Place of birth for the foreign-born population - Lebanon (%)
Place of birth for the foreign-born population - Saudi Arabia (%)
Place of birth for the foreign-born population - Syria (%)
Place of birth for the foreign-born population - Turkey (%)
Place of birth for the foreign-born population - Yemen (%)
Place of birth for the foreign-born population - Other Western Asia (%)
Place of birth for the foreign-born population - Eritrea (%)
Place of birth for the foreign-born population - Ethiopia (%)
Place of birth for the foreign-born population - Kenya (%)
Place of birth for the foreign-born population - Somalia (%)
Place of birth for the foreign-born population - Uganda (%)
Place of birth for the foreign-born population - Zimbabwe (%)
Place of birth for the foreign-born population - Other Eastern Africa (%)
Place of birth for the foreign-born population - Cameroon (%)
Place of birth for the foreign-born population - Congo (%)
Place of birth for the foreign-born population - Democratic Republic of Congo (Zaire) (%)
Place of birth for the foreign-born population - Other Middle Africa (%)
Place of birth for the foreign-born population - Egypt (%)
Place of birth for the foreign-born population - Morocco (%)
Place of birth for the foreign-born population - Sudan (%)
Place of birth for the foreign-born population - Other Northern Africa (%)
Place of birth for the foreign-born population - South Africa (%)
Place of birth for the foreign-born population - Other Southern Africa (%)
Place of birth for the foreign-born population - Cabo Verde (%)
Place of birth for the foreign-born population - Ghana (%)
Place of birth for the foreign-born population - Liberia (%)
Place of birth for the foreign-born population - Nigeria (%)
Place of birth for the foreign-born population - Senegal (%)
Place of birth for the foreign-born population - Sierra Leone (%)
Place of birth for the foreign-born population - Other Western Africa (%)
Place of birth for the foreign-born population - Australia (%)
Place of birth for the foreign-born population - New Zealand (%)
Place of birth for the foreign-born population - Fiji (%)
Place of birth for the foreign-born population - Micronesia (%)
Place of birth for the foreign-born population - Bahamas (%)
Place of birth for the foreign-born population - Barbados (%)
Place of birth for the foreign-born population - Cuba (%)
Place of birth for the foreign-born population - Dominica (%)
Place of birth for the foreign-born population - Dominican Republic (%)
Place of birth for the foreign-born population - Grenada (%)
Place of birth for the foreign-born population - Haiti (%)
Place of birth for the foreign-born population - Jamaica (%)
Place of birth for the foreign-born population - St. Vincent and the Grenadines (%)
Place of birth for the foreign-born population - Trinidad and Tobago (%)
Place of birth for the foreign-born population - West Indies (%)
Place of birth for the foreign-born population - Other Caribbean (%)
Place of birth for the foreign-born population - Belize (%)
Place of birth for the foreign-born population - Costa Rica (%)
Place of birth for the foreign-born population - El Salvador (%)
Place of birth for the foreign-born population - Guatemala (%)
Place of birth for the foreign-born population - Honduras (%)
Place of birth for the foreign-born population - Mexico (%)
Place of birth for the foreign-born population - Nicaragua (%)
Place of birth for the foreign-born population - Panama (%)
Place of birth for the foreign-born population - Other Central America (%)
Place of birth for the foreign-born population - Argentina (%)
Place of birth for the foreign-born population - Bolivia (%)
Place of birth for the foreign-born population - Brazil (%)
Place of birth for the foreign-born population - Chile (%)
Place of birth for the foreign-born population - Colombia (%)
Place of birth for the foreign-born population - Ecuador (%)
Place of birth for the foreign-born population - Guyana (%)
Place of birth for the foreign-born population - Peru (%)
Place of birth for the foreign-born population - Uruguay (%)
Place of birth for the foreign-born population - Venezuela (%)
Place of birth for the foreign-born population - Other South America (%)
Place of birth for the foreign-born population - Canada (%)
Place of birth for the foreign-born population - Other Northern America (%)
Place of birth for the foreign-born population - Other (%)
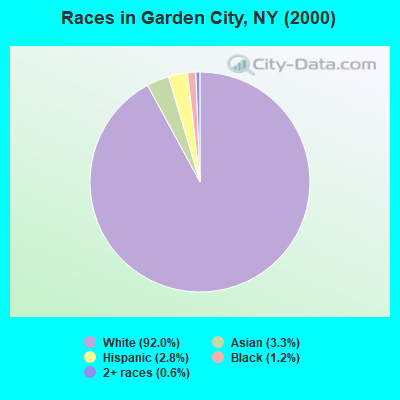
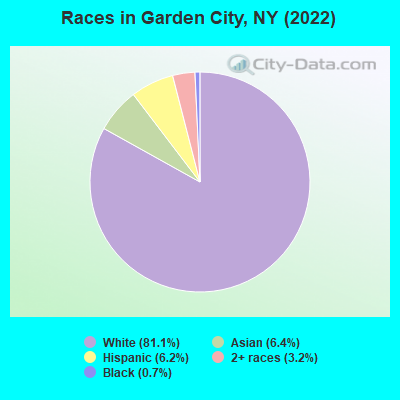
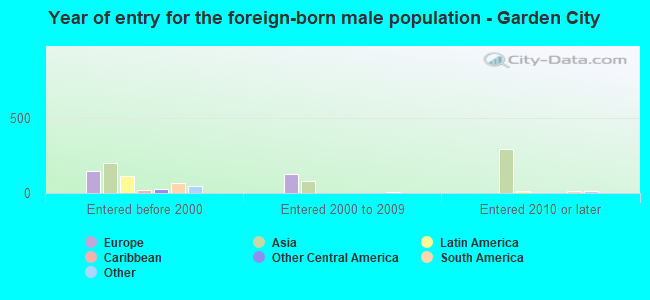
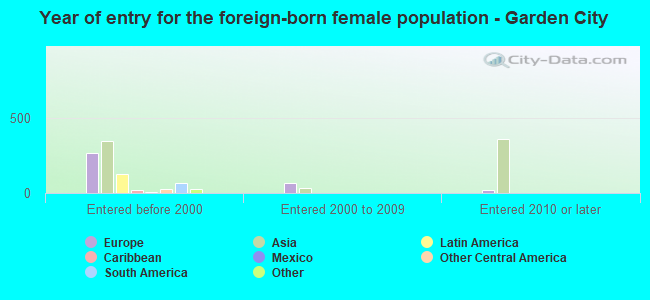
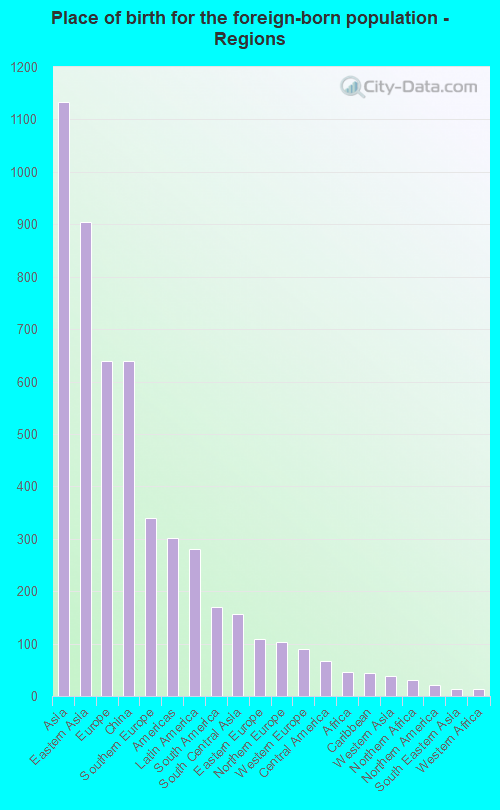
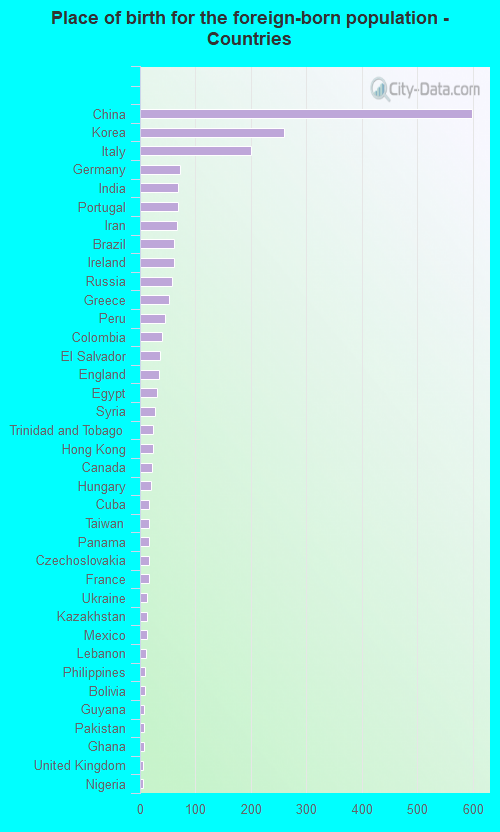
According to 2022 data, the most numerous races in Garden City, NY are White alone (18,485 residents), Hispanic (1,415 residents), and Black alone (161 residents). 86.7% of Garden City residents speak English at home. 9.3% of Garden City, NY residents are foreign-born (5.0% born in Asia, 2.8% born in Europe, 1.2% born in Latin America), which is 136.1% less than the foreign-born rate of 22.0% across the entire state of New York.
Race distribution in Garden City
2000 2022
11,760,981 62.0% White alone 2,867,583 15.1% Hispanic 2,812,623 14.8% Black alone 1,035,926 5.5% Asian alone 366,116 1.9% Two or more races 75,499 0.4% Other race alone 52,499 0.3% American Indian alone 5,230 0.03% Native Hawaiian and Other
10,408,933 52.9% White alone 3,867,299 19.7% Hispanic 2,633,840 13.4% Black alone 1,776,286 9.0% Asian alone 732,670 3.7% Two or more races 216,110 1.1% Other race alone 35,082 0.2% American Indian alone 6,931 0.04% Native Hawaiian and Other
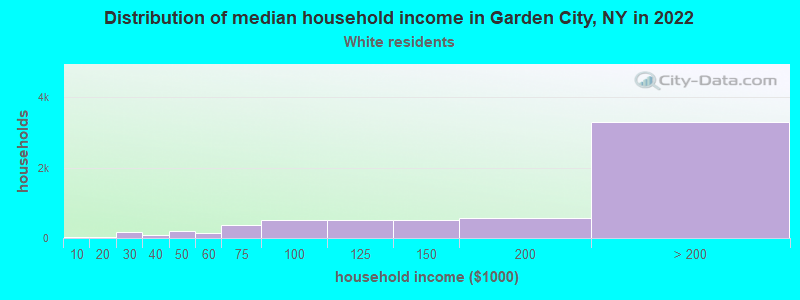
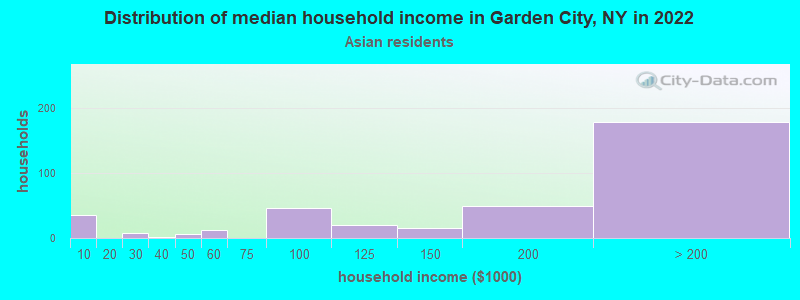
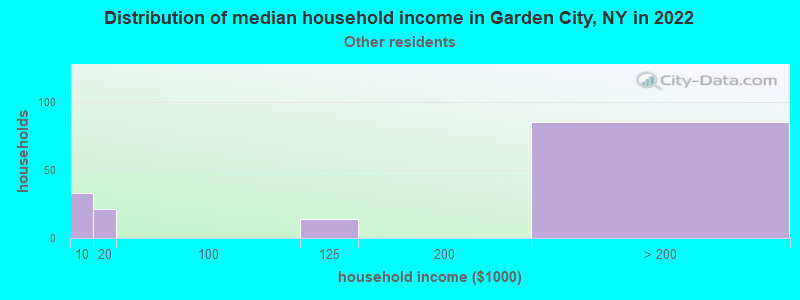
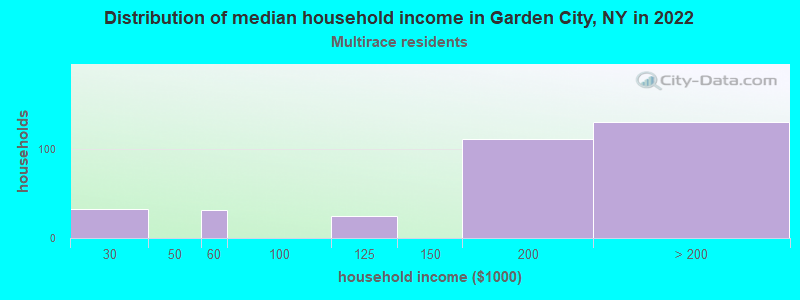
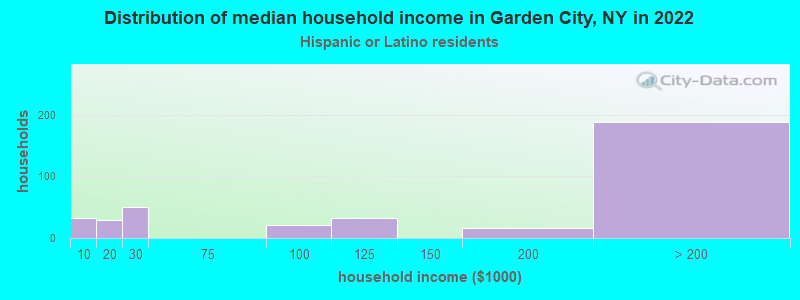
Income and house value in Garden City Median household income in 2022 over $200,000 White non-Hispanic householders$169,443 Asian householders$178,229 Two or more races householdersover $200,000 Hispanic or Latino race householdersMedian 2022 house value over $1,000,000 White Non-Hispanic householders$650,624 Black or African American householders $874,164 Asian householders$524,139 Some other race householders$621,193 Two or more races householders$780,479 Hispanic or Latino householders
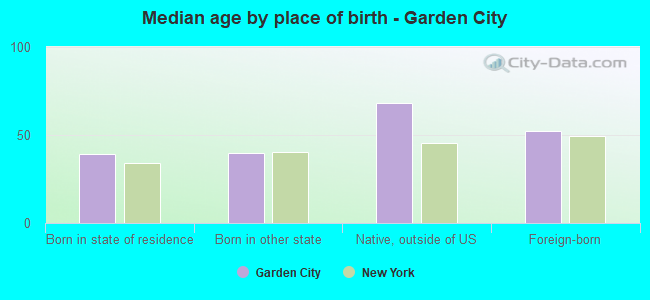
Median age by race in Garden City
43.8 Median age for White residents44.4 43.8 40.6 Median age for Black or African American residents40.4 18.5 -855,158,729.3 Median age for American Indian / Alaska Native residents-607,543,322.5 -837,121,211.3 33.1 Median age for Asian residents36.3 32.8 -487,992,314.6 Median age for Native Hawaiian / Pacific Islander residents-477,502,295.2 -497,387,669.3 47.2 Median age for Other race residents59.3 30.3 19.0 Median age for Two or more races residents19.3 18.4 43.5 Median age for White alone residents44.0 43.2 29.6 Median age for Hispanic or Latino residents34.0 24.1
Owner/renter occupied households by race in Garden City
House owners and renters - White residents 6,006 93.4% Owner occupied423 6.6% Renter occupiedHouse owners and renters - Black or African American residents 26 100.0% Owner occupiedHouse owners and renters - Asian residents 349 93.9% Owner occupied22 6.1% Renter occupiedHouse owners and renters - Other race residents 59 37.2% Owner occupied99 62.8% Renter occupiedHouse owners and renters - Two or more races residents 309 100.0% Owner occupiedHouse owners and renters - White alone residents 6,019 93.0% Owner occupied455 7.0% Renter occupiedHouse owners and renters - Hispanic or Latino residents 309 77.2% Owner occupied91 22.8% Renter occupied
Language usage in Garden City
English speakers - Total 86.7% of residents of Garden City speak English at home.
1.8% of residents speak Spanish at home 291 75.0% Speak English very well97 25.0% Speak English less than very well11.0% of residents speak other language at home 1,529 63.6% Speak English very well875 36.4% Speak English less than very well
English speakers - Born in the United States 92.0% of residents of Garden City speak English at home.
1.4% of residents speak Spanish at home 29 100.0% Speak English very well5.2% of residents speak other language at home 108 100.0% Speak English very well
English speakers - Native, born elsewhere 51.7% of residents of Garden City speak English at home.
14.4% of residents speak Spanish at home 21 72.4% Speak English very well8 27.6% Speak English less than very well33.3% of residents speak other language at home 67 100.0% Speak English very well
English speakers - Foreign-born 21.2% of residents of Garden City speak English at home.
6.5% of residents speak Spanish at home 62 43.7% Speak English very well80 56.3% Speak English less than very well75.3% of residents speak other language at home 886 53.7% Speak English very well765 46.3% Speak English less than very well
White (Caucasian) - Speak only English Native:
97.3% (16,501)Foreign-born:
41.4% (369)
White (Caucasian) - Speak another language Native:
3.6% (605)Foreign-born:
61.2% (547)
Black or African American - Speak only English Native:
91.9% (114)Foreign-born:
99.0% (38)
Asian - Speak only English Native:
94.8% (261)Foreign-born:
1.5% (15)
Asian - Speak another language Native:
8.2% (23)Foreign-born:
100.0% (981)
Other race - Speak another language Native:
30.7% (106)Foreign-born:
100.0% (29)
Two or more races - Speak only English Native:
86.0% (1,113)Foreign-born:
36.9% (34)
Two or more races - Speak another language Native:
9.0% (117)Foreign-born:
60.2% (56)
White alone - Speak only English Native:
96.4% (16,237)Foreign-born:
37.3% (382)
White alone - Speak another language Native:
3.7% (630)Foreign-born:
62.6% (641)
Hispanic or Latino - Speak only English Native:
78.4% (903)Foreign-born:
12.8% (24)
Hispanic or Latino - Speak another language Native:
20.8% (239)Foreign-born:
87.2% (165)
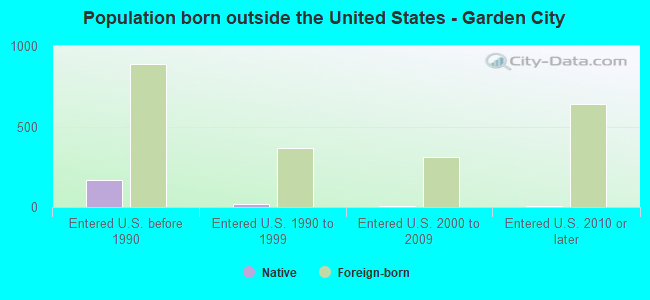
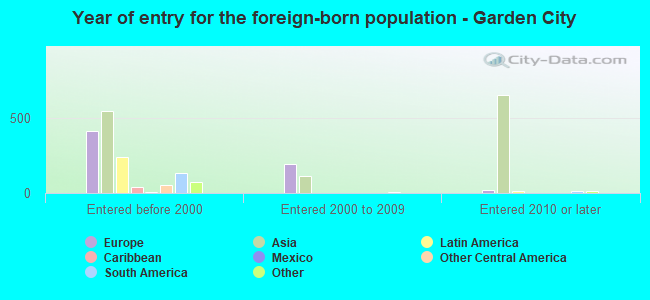
Foreign-born residents in Garden City 2,123 residents are foreign born (5.0% Asia , 2.8% Europe , 1.2% Latin America ).
This city:
9.3%New York:
22.6%
Marital status for residents in Garden City Marital status - White (Caucasian) population 15 years and over
Males 27.7% Never married68.8% Now married0.3% Separated0.7% Widowed2.5% DivorcedFemales 30.2% Never married55.0% Now married0.9% Separated8.2% Widowed5.6% DivorcedWomen who gave birth in the past 12 months Now married:
94.2% (102)Unmarried:
5.8% (6)
Women who did not give birth in the past 12 months Now married:
46.0% (1,836)Unmarried:
54.0% (2,156)
Marital status - Black or African American population 15 years and over
Males 32.5% Never married67.5% Now married0.0% Separated0.0% Widowed0.0% DivorcedFemales 100.0% Never married0.0% Now married0.0% Separated0.0% Widowed0.0% DivorcedWomen who did not give birth in the past 12 months Now married:
0.0% (0)Unmarried:
100.0% (35)
Marital status - Asian population 15 years and over
Males 25.9% Never married67.6% Now married0.0% Separated0.0% Widowed6.5% DivorcedFemales 25.8% Never married59.5% Now married0.2% Separated10.5% Widowed4.0% DivorcedWomen who gave birth in the past 12 months Now married:
100.0% (47)Unmarried:
0.0% (0)
Women who did not give birth in the past 12 months Now married:
58.2% (218)Unmarried:
41.8% (156)
Marital status - Other race population 15 years and over
Males 31.6% Never married24.1% Now married0.0% Separated0.0% Widowed44.4% DivorcedFemales 49.4% Never married40.5% Now married0.0% Separated0.0% Widowed10.1% DivorcedWomen who did not give birth in the past 12 months Now married:
24.2% (34)Unmarried:
75.8% (107)
Marital status - Two or more races population 15 years and over
Males 35.1% Never married64.9% Now married0.0% Separated0.0% Widowed0.0% DivorcedFemales 36.8% Never married58.7% Now married0.0% Separated2.6% Widowed1.9% DivorcedWomen who did not give birth in the past 12 months Now married:
42.6% (125)Unmarried:
57.4% (169)
Marital status - White alone, not Hispanic / Latino population 15 years and over
Males 27.5% Never married68.8% Now married0.3% Separated0.7% Widowed2.6% DivorcedFemales 29.5% Never married55.4% Now married1.0% Separated8.5% Widowed5.6% DivorcedWomen who gave birth in the past 12 months Now married:
94.2% (109)Unmarried:
5.8% (7)
Women who did not give birth in the past 12 months Now married:
46.5% (1,912)Unmarried:
53.5% (2,198)
Marital status - Hispanic or Latino population 15 years and over
Males 30.4% Never married57.9% Now married0.0% Separated0.0% Widowed11.7% DivorcedFemales 46.7% Never married44.6% Now married0.0% Separated1.6% Widowed7.1% DivorcedWomen who did not give birth in the past 12 months Now married:
37.2% (134)Unmarried:
62.8% (226)
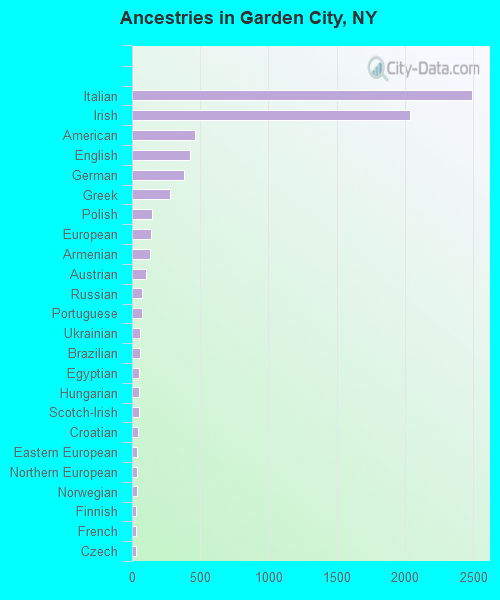
Ancestries in Garden City
2,491 26.8% Italian2,040 21.9% Irish465 5.0% American423 4.5% English380 4.1% German282 3.0% Greek144 1.5% Polish139 1.5% European132 1.4% Armenian104 1.1% Austrian76 0.8% Russian75 0.8% Portuguese61 0.7% Ukrainian59 0.6% Brazilian54 0.6% Egyptian52 0.6% Hungarian48 0.5% Scotch-Irish45 0.5% Croatian40 0.4% Eastern European37 0.4% Northern European34 0.4% Norwegian32 0.3% Finnish28 0.3% French27 0.3% Czech19 0.2% Scottish12 0.1% British8 0.09% African8 0.09% Belizean7 0.08% Cypriot7 0.08% Dutch6 0.06% Canadian6 0.06% Iranian6 0.06% Slovak6 0.06% Swedish4 0.04% Lebanese4 0.04% Maltese4 0.04% Haitian
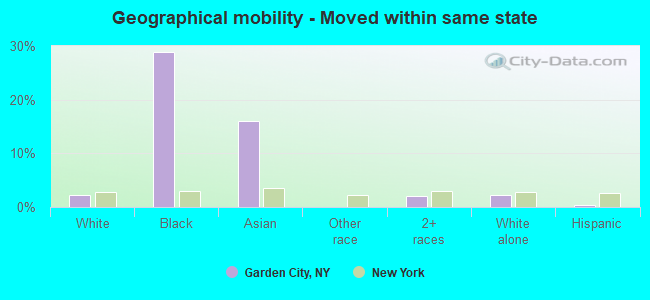
Geographical mobility in Garden City Same house 1 year ago 17,044 93.5% White (Caucasian)113 69.1% Black or African American1,212 84.1% Asian355 99.9% Other race1,291 91.4% Two or more races17,226 93.4% White alone, not Hispanic / Latino1,301 96.0% Hispanic or LatinoMoved within same county 572 3.1% White / Caucasian24 1.7% Asian14 1.0% Two or more races608 3.3% White alone, not Hispanic / LatinoMoved within same state 410 2.2% White / Caucasian47 28.9% Black or African American232 16.1% Asian30 2.1% Two or more races419 2.3% White alone, not Hispanic / Latino5 0.4% Hispanic or LatinoMoved from different state 183 1.0% White / Caucasian6 3.5% Black or African American16 1.1% Asian36 2.5% Two or more races167 0.9% White alone, not Hispanic / Latino28 2.1% Hispanic or LatinoMoved from abroad 11 0.1% White24 1.7% Two or more races11 0.1% White alone, not Hispanic / Latino
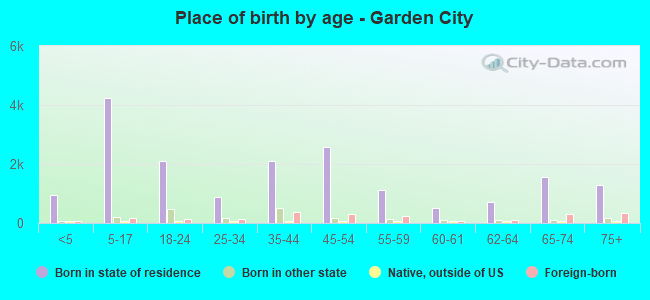
Children Nativity (place of birth) in Garden City
Children under 6 years - Living with two parents Both parents native 1,136 100.0% NativeBoth parents foreign-born 248 100.0% NativeOne native, one foreign-born parent 110 100.0% NativeChildren under 6 years - Living with one parent Native parent 15 100.0% NativeChildren 6 to 17 years - Living with two parents Both parents native 3,160 99.0% Native31 1.0% Foreign-bornBoth parents foreign-born 72 56.2% Native57 43.8% Foreign-bornOne native, one foreign-born parent 256 100.0% NativeChildren 6 to 17 years - Living with one parent Native parent 81 90.1% Native9 9.9% Foreign-bornForeign-born parent 21 100.0% Native
Grandparents responsible for own grandchildren in Garden City
Grandparents (30 to 59 years) White / Caucasian 19 100.0% Not responsible for grandchildrenAsian 81 100.0% Not responsible for grandchildrenWhite alone, not Hispanic / Latino 12 100.0% Not responsible for grandchildrenGrandparents (60 years and over) White / Caucasian 13 13.2% Responsible for grandchildren87 86.8% Not responsible for grandchildrenAsian 36 100.0% Not responsible for grandchildrenWhite alone, not Hispanic / Latino 12 12.0% Responsible for grandchildren91 88.0% Not responsible for grandchildren