Races in Garden Home-Whitford, Oregon (OR) Detailed Stats
Data:
Races - White alone (%)
Races - White alone (% change since 2000)
Races - Black alone (%)
Races - Black alone (% change since 2000)
Races - American Indian alone (%)
Races - American Indian alone (% change since 2000)
Races - Asian alone (%)
Races - Asian alone (% change since 2000)
Races - Hispanic (%)
Races - Hispanic (% change since 2000)
Races - Native Hawaiian and Other Pacific Islander alone (%)
Races - Native Hawaiian and Other Pacific Islander alone (% change since 2000)
Races - Two or more races(%)
Races - Two or more races(% change since 2000)
Races - Other race alone (%)
Races - Other race alone (% change since 2000)
Racial diversity
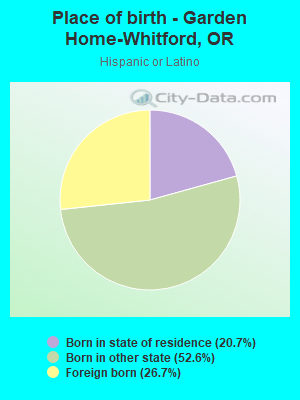
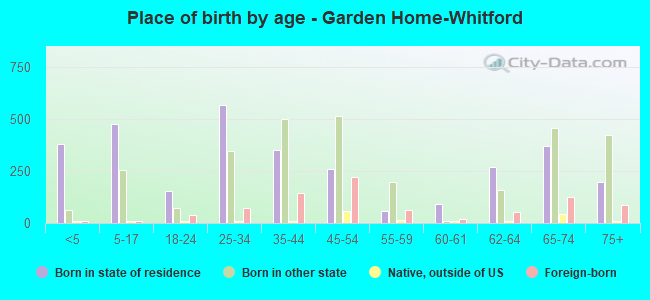
Place of birth - Born in state of residence (%)
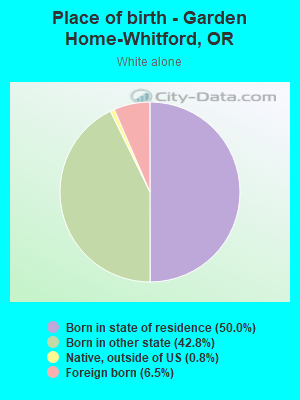
Place of birth - Born in state of residence (%) - White
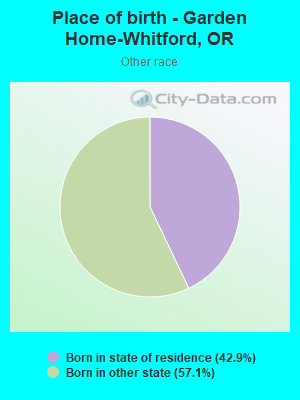
Place of birth - Born in state of residence (%) - Black or African American
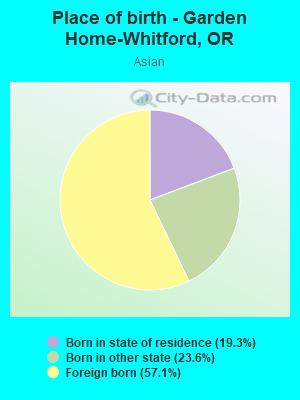
Place of birth - Born in state of residence (%) - Asian
Place of birth - Born in state of residence (%) - Hispanic or Latino
Place of birth - Born in state of residence (%) - American Indian and Alaska Native
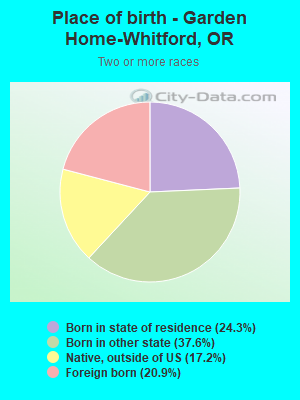
Place of birth - Born in state of residence (%) - Multirace
Place of birth - Born in state of residence (%) - Other Race
Place of birth - Born in other state (%)
Place of birth - Born in other state (%) - White
Place of birth - Born in other state (%) - Black or African American
Place of birth - Born in other state (%) - Asian
Place of birth - Born in other state (%) - Hispanic or Latino
Place of birth - Born in other state (%) - American Indian and Alaska Native
Place of birth - Born in other state (%) - Multirace
Place of birth - Born in other state (%) - Other Race
Place of birth - Native, outside of US (%)
Place of birth - Native, outside of US (%) - White
Place of birth - Native, outside of US (%) - Black or African American
Place of birth - Native, outside of US (%) - Asian
Place of birth - Native, outside of US (%) - Hispanic or Latino
Place of birth - Native, outside of US (%) - American Indian and Alaska Native
Place of birth - Native, outside of US (%) - Multirace
Place of birth - Native, outside of US (%) - Other Race
Place of birth - Foreign born (%)
Place of birth - Foreign born (%) - White
Place of birth - Foreign born (%) - Black or African American
Place of birth - Foreign born (%) - Asian
Place of birth - Foreign born (%) - Hispanic or Latino
Place of birth - Foreign born (%) - American Indian and Alaska Native
Place of birth - Foreign born (%) - Multirace
Place of birth - Foreign born (%) - Other Race
Residents speaking English at home (%)
Residents speaking English at home - Born in the United States (%)
Residents speaking English at home - Native, born elsewhere (%)
Residents speaking English at home - Foreign born (%)
Residents speaking Spanish at home (%)
Residents speaking Spanish at home - Born in the United States (%)
Residents speaking Spanish at home - Native, born elsewhere (%)
Residents speaking Spanish at home - Foreign born (%)
Residents speaking other language at home (%)
Residents speaking other language at home - Born in the United States (%)
Residents speaking other language at home - Native, born elsewhere (%)
Residents speaking other language at home - Foreign born (%)
Marital status - Never married (%)
Marital status - Now married (%)
Marital status - Separated (%)
Marital status - Widowed (%)
Marital status - Divorced (%)
Ancestries Reported - Arab (%)
Ancestries Reported - Czech (%)
Ancestries Reported - Danish (%)
Ancestries Reported - Dutch (%)
Ancestries Reported - English (%)
Ancestries Reported - French (%)
Ancestries Reported - French Canadian (%)
Ancestries Reported - German (%)
Ancestries Reported - Greek (%)
Ancestries Reported - Hungarian (%)
Ancestries Reported - Irish (%)
Ancestries Reported - Italian (%)
Ancestries Reported - Lithuanian (%)
Ancestries Reported - Norwegian (%)
Ancestries Reported - Polish (%)
Ancestries Reported - Portuguese (%)
Ancestries Reported - Russian (%)
Ancestries Reported - Scotch-Irish (%)
Ancestries Reported - Scottish (%)
Ancestries Reported - Slovak (%)
Ancestries Reported - Subsaharan African (%)
Ancestries Reported - Swedish (%)
Ancestries Reported - Swiss (%)
Ancestries Reported - Ukrainian (%)
Ancestries Reported - United States (%)
Ancestries Reported - Welsh (%)
Ancestries Reported - West Indian (%)
Ancestries Reported - Other (%)
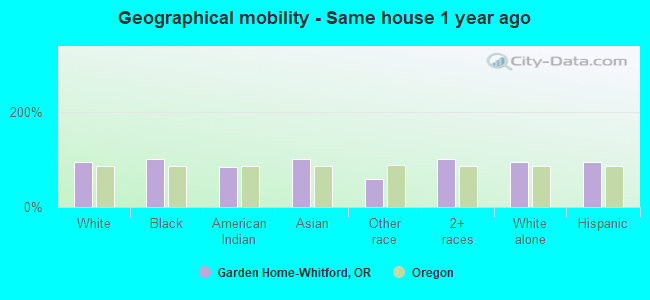
Geographical mobility - Same house 1 year ago (%)
Geographical mobility - Same house 1 year ago (%) - White
Geographical mobility - Same house 1 year ago (%) - Black or African American
Geographical mobility - Same house 1 year ago (%) - Asian
Geographical mobility - Same house 1 year ago (%) - Hispanic or Latino
Geographical mobility - Same house 1 year ago (%) - American Indian and Alaska Native
Geographical mobility - Same house 1 year ago (%) - Multirace
Geographical mobility - Same house 1 year ago (%) - Other Race
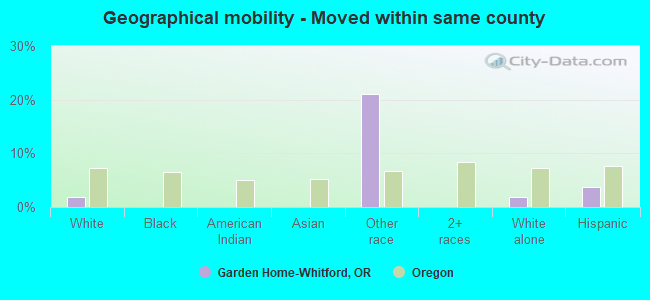
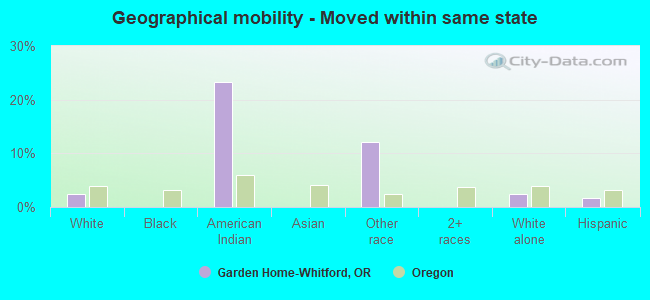
Geographical mobility - Moved within same county (%)
Geographical mobility - Moved within same county (%) - White
Geographical mobility - Moved within same county (%) - Black or African American
Geographical mobility - Moved within same county (%) - Asian
Geographical mobility - Moved within same county (%) - Hispanic or Latino
Geographical mobility - Moved within same county (%) - American Indian and Alaska Native
Geographical mobility - Moved within same county (%) - Multirace
Geographical mobility - Moved within same county (%) - Other Race
Geographical mobility - Moved from different county within same state (%)
Geographical mobility - Moved from different county within same state (%) - White
Geographical mobility - Moved from different county within same state (%) - Black or African American
Geographical mobility - Moved from different county within same state (%) - Asian
Geographical mobility - Moved from different county within same state (%) - Hispanic or Latino
Geographical mobility - Moved from different county within same state (%) - American Indian and Alaska Native
Geographical mobility - Moved from different county within same state (%) - Multirace
Geographical mobility - Moved from different county within same state (%) - Other Race
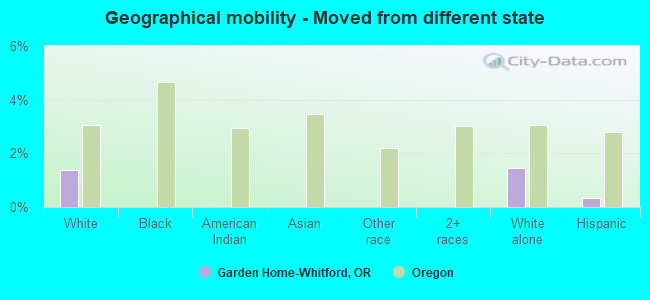
Geographical mobility - Moved from different state (%)
Geographical mobility - Moved from different state (%) - White
Geographical mobility - Moved from different state (%) - Black or African American
Geographical mobility - Moved from different state (%) - Asian
Geographical mobility - Moved from different state (%) - Hispanic or Latino
Geographical mobility - Moved from different state (%) - American Indian and Alaska Native
Geographical mobility - Moved from different state (%) - Multirace
Geographical mobility - Moved from different state (%) - Other Race
Geographical mobility - Moved from abroad (%)
Geographical mobility - Moved from abroad (%) - White
Geographical mobility - Moved from abroad (%) - Black or African American
Geographical mobility - Moved from abroad (%) - Asian
Geographical mobility - Moved from abroad (%) - Hispanic or Latino
Geographical mobility - Moved from abroad (%) - American Indian and Alaska Native
Geographical mobility - Moved from abroad (%) - Multirace
Geographical mobility - Moved from abroad (%) - Other Race
Place of birth for the foreign-born population - Ireland (%)
Place of birth for the foreign-born population - Denmark (%)
Place of birth for the foreign-born population - Norway (%)
Place of birth for the foreign-born population - Sweden (%)
Place of birth for the foreign-born population - United Kingdom (%)
Place of birth for the foreign-born population - England (%)
Place of birth for the foreign-born population - Scotland (%)
Place of birth for the foreign-born population - Other Northern Europe (%)
Place of birth for the foreign-born population - Austria (%)
Place of birth for the foreign-born population - Belgium (%)
Place of birth for the foreign-born population - France (%)
Place of birth for the foreign-born population - Germany (%)
Place of birth for the foreign-born population - Netherlands (%)
Place of birth for the foreign-born population - Switzerland (%)
Place of birth for the foreign-born population - Other Western Europe (%)
Place of birth for the foreign-born population - Greece (%)
Place of birth for the foreign-born population - Italy (%)
Place of birth for the foreign-born population - Portugal (%)
Place of birth for the foreign-born population - Spain (%)
Place of birth for the foreign-born population - Other Southern Europe (%)
Place of birth for the foreign-born population - Albania (%)
Place of birth for the foreign-born population - Belarus (%)
Place of birth for the foreign-born population - Bosnia and Herzegovina (%)
Place of birth for the foreign-born population - Bulgaria (%)
Place of birth for the foreign-born population - Croatia (%)
Place of birth for the foreign-born population - Czechoslovakia (%)
Place of birth for the foreign-born population - Hungary (%)
Place of birth for the foreign-born population - Latvia (%)
Place of birth for the foreign-born population - Lithuania (%)
Place of birth for the foreign-born population - North Macedonia (Macedonia) (%)
Place of birth for the foreign-born population - Moldova (%)
Place of birth for the foreign-born population - Poland (%)
Place of birth for the foreign-born population - Romania (%)
Place of birth for the foreign-born population - Russia (%)
Place of birth for the foreign-born population - Serbia (%)
Place of birth for the foreign-born population - Ukraine (%)
Place of birth for the foreign-born population - Other Eastern Europe (%)
Place of birth for the foreign-born population - China (%)
Place of birth for the foreign-born population - Hong Kong (%)
Place of birth for the foreign-born population - Taiwan (%)
Place of birth for the foreign-born population - Japan (%)
Place of birth for the foreign-born population - Korea (%)
Place of birth for the foreign-born population - Other Eastern Asia (%)
Place of birth for the foreign-born population - Afghanistan (%)
Place of birth for the foreign-born population - Bangladesh (%)
Place of birth for the foreign-born population - India (%)
Place of birth for the foreign-born population - Iran (%)
Place of birth for the foreign-born population - Kazakhstan (%)
Place of birth for the foreign-born population - Nepal (%)
Place of birth for the foreign-born population - Pakistan (%)
Place of birth for the foreign-born population - Sri Lanka (%)
Place of birth for the foreign-born population - Uzbekistan (%)
Place of birth for the foreign-born population - Other South Central Asia (%)
Place of birth for the foreign-born population - Burma (%)
Place of birth for the foreign-born population - Cambodia (%)
Place of birth for the foreign-born population - Indonesia (%)
Place of birth for the foreign-born population - Laos (%)
Place of birth for the foreign-born population - Malaysia (%)
Place of birth for the foreign-born population - Philippines (%)
Place of birth for the foreign-born population - Singapore (%)
Place of birth for the foreign-born population - Thailand (%)
Place of birth for the foreign-born population - Vietnam (%)
Place of birth for the foreign-born population - Other South Eastern Asia (%)
Place of birth for the foreign-born population - Armenia (%)
Place of birth for the foreign-born population - Iraq (%)
Place of birth for the foreign-born population - Israel (%)
Place of birth for the foreign-born population - Jordan (%)
Place of birth for the foreign-born population - Kuwait (%)
Place of birth for the foreign-born population - Lebanon (%)
Place of birth for the foreign-born population - Saudi Arabia (%)
Place of birth for the foreign-born population - Syria (%)
Place of birth for the foreign-born population - Turkey (%)
Place of birth for the foreign-born population - Yemen (%)
Place of birth for the foreign-born population - Other Western Asia (%)
Place of birth for the foreign-born population - Eritrea (%)
Place of birth for the foreign-born population - Ethiopia (%)
Place of birth for the foreign-born population - Kenya (%)
Place of birth for the foreign-born population - Somalia (%)
Place of birth for the foreign-born population - Uganda (%)
Place of birth for the foreign-born population - Zimbabwe (%)
Place of birth for the foreign-born population - Other Eastern Africa (%)
Place of birth for the foreign-born population - Cameroon (%)
Place of birth for the foreign-born population - Congo (%)
Place of birth for the foreign-born population - Democratic Republic of Congo (Zaire) (%)
Place of birth for the foreign-born population - Other Middle Africa (%)
Place of birth for the foreign-born population - Egypt (%)
Place of birth for the foreign-born population - Morocco (%)
Place of birth for the foreign-born population - Sudan (%)
Place of birth for the foreign-born population - Other Northern Africa (%)
Place of birth for the foreign-born population - South Africa (%)
Place of birth for the foreign-born population - Other Southern Africa (%)
Place of birth for the foreign-born population - Cabo Verde (%)
Place of birth for the foreign-born population - Ghana (%)
Place of birth for the foreign-born population - Liberia (%)
Place of birth for the foreign-born population - Nigeria (%)
Place of birth for the foreign-born population - Senegal (%)
Place of birth for the foreign-born population - Sierra Leone (%)
Place of birth for the foreign-born population - Other Western Africa (%)
Place of birth for the foreign-born population - Australia (%)
Place of birth for the foreign-born population - New Zealand (%)
Place of birth for the foreign-born population - Fiji (%)
Place of birth for the foreign-born population - Micronesia (%)
Place of birth for the foreign-born population - Bahamas (%)
Place of birth for the foreign-born population - Barbados (%)
Place of birth for the foreign-born population - Cuba (%)
Place of birth for the foreign-born population - Dominica (%)
Place of birth for the foreign-born population - Dominican Republic (%)
Place of birth for the foreign-born population - Grenada (%)
Place of birth for the foreign-born population - Haiti (%)
Place of birth for the foreign-born population - Jamaica (%)
Place of birth for the foreign-born population - St. Vincent and the Grenadines (%)
Place of birth for the foreign-born population - Trinidad and Tobago (%)
Place of birth for the foreign-born population - West Indies (%)
Place of birth for the foreign-born population - Other Caribbean (%)
Place of birth for the foreign-born population - Belize (%)
Place of birth for the foreign-born population - Costa Rica (%)
Place of birth for the foreign-born population - El Salvador (%)
Place of birth for the foreign-born population - Guatemala (%)
Place of birth for the foreign-born population - Honduras (%)
Place of birth for the foreign-born population - Mexico (%)
Place of birth for the foreign-born population - Nicaragua (%)
Place of birth for the foreign-born population - Panama (%)
Place of birth for the foreign-born population - Other Central America (%)
Place of birth for the foreign-born population - Argentina (%)
Place of birth for the foreign-born population - Bolivia (%)
Place of birth for the foreign-born population - Brazil (%)
Place of birth for the foreign-born population - Chile (%)
Place of birth for the foreign-born population - Colombia (%)
Place of birth for the foreign-born population - Ecuador (%)
Place of birth for the foreign-born population - Guyana (%)
Place of birth for the foreign-born population - Peru (%)
Place of birth for the foreign-born population - Uruguay (%)
Place of birth for the foreign-born population - Venezuela (%)
Place of birth for the foreign-born population - Other South America (%)
Place of birth for the foreign-born population - Canada (%)
Place of birth for the foreign-born population - Other Northern America (%)
Place of birth for the foreign-born population - Other (%)
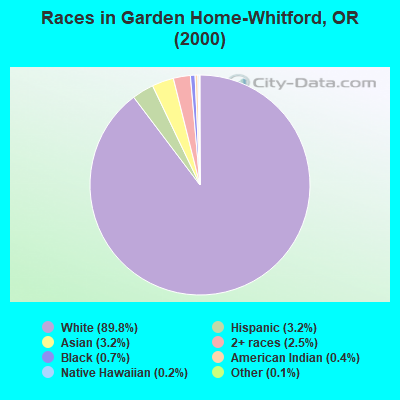
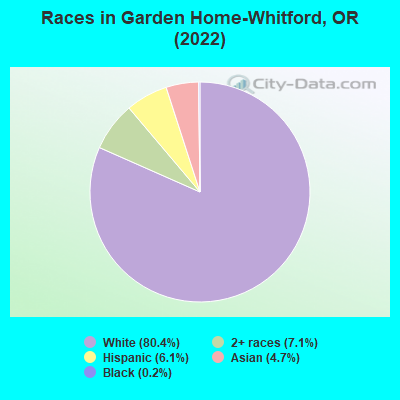
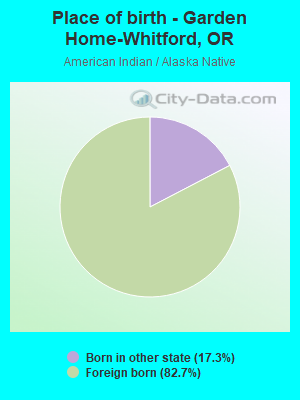
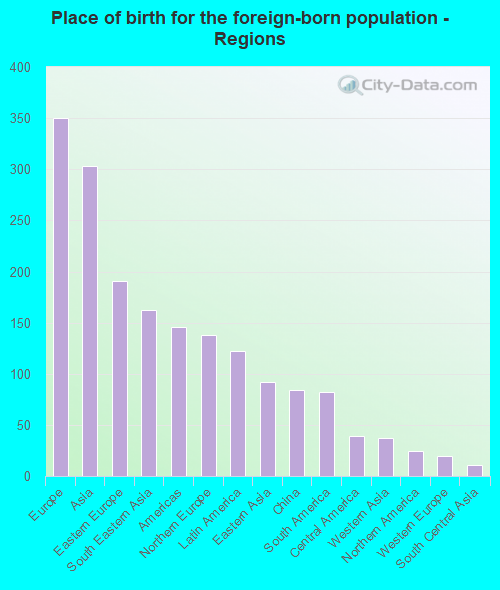
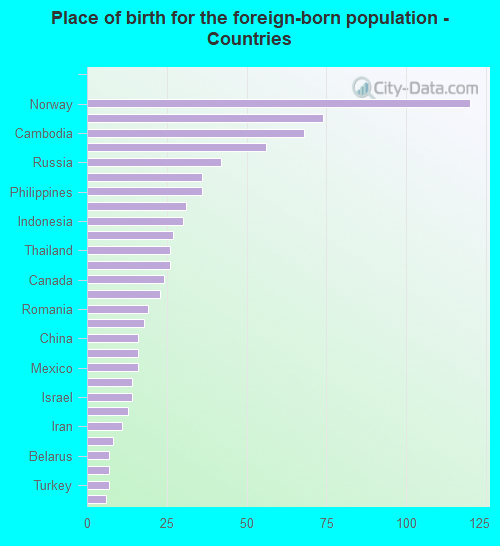
According to 2022 data, the most numerous races in Garden Home-Whitford, OR are White alone (5,703 residents), Hispanic (430 residents), and Two or more races (506 residents). 85.8% of Garden Home-Whitford residents speak English at home. 11.3% of Garden Home-Whitford, OR residents are foreign-born (4.8% born in Europe, 4.2% born in Asia, 1.7% born in Latin America), which is 20.3% greater than the foreign-born rate of 9.0% across the entire state of Oregon.
Race distribution in Garden Home-Whitford
2000 2022
2,857,616 83.5% White alone 275,314 8.0% Hispanic 100,333 2.9% Asian alone 82,733 2.4% Two or more races 53,325 1.6% Black alone 40,130 1.2% American Indian alone 7,398 0.2% Native Hawaiian and Other 4,550 0.1% Other race alone
3,037,571 71.6% White alone 609,538 14.4% Hispanic 252,744 6.0% Two or more races 191,283 4.5% Asian alone 78,228 1.8% Black alone 29,399 0.7% American Indian alone 25,731 0.6% Other race alone 15,643 0.4% Native Hawaiian and Other
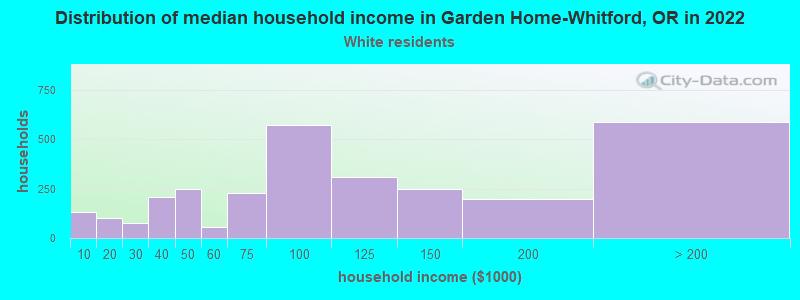
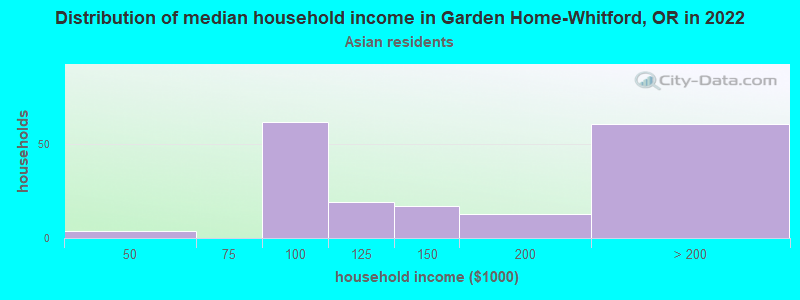
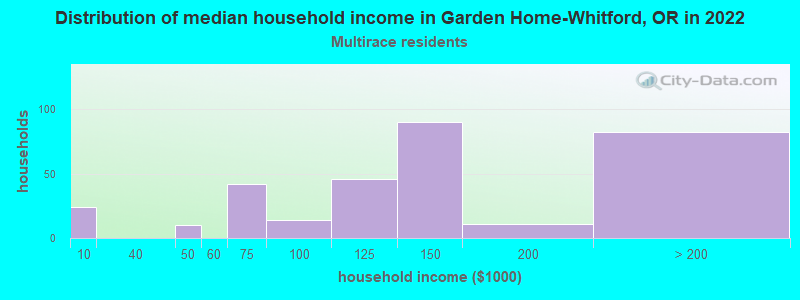
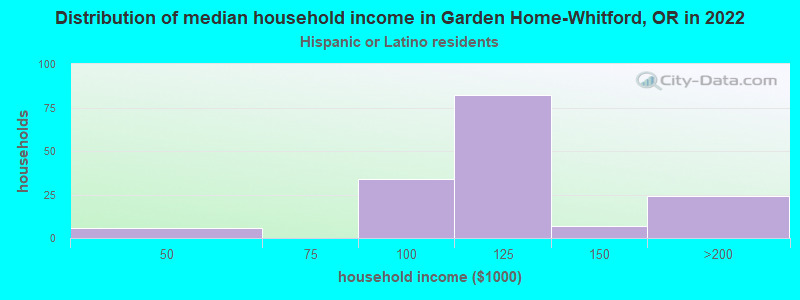
Income and house value in Garden Home-Whitford Median household income in 2022 $88,260 White non-Hispanic householders$126,887 Two or more races householders$107,173 Hispanic or Latino race householdersMedian 2022 house value $670,833 White Non-Hispanic householders$623,997 Black or African American householders$585,448 American Indian or Alaska Native householders $524,201 Asian householders$675,516 Some other race householders$866,823 Two or more races householders$810,620 Hispanic or Latino householders
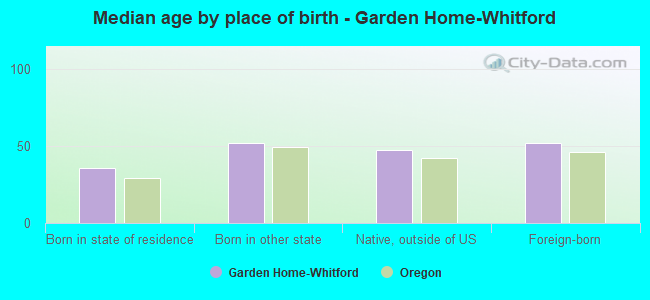
Median age by race in Garden Home-Whitford
49.5 Median age for White residents45.2 53.3 -699,487,178.8 Median age for Black or African American residents-707,566,461.5 -652,307,691.7 -740,740,740.0 Median age for American Indian / Alaska Native residents-838,647,342.2 -658,119,657.5 47.7 Median age for Asian residents48.1 47.4 -642,169,728.1 Median age for Native Hawaiian / Pacific Islander residents-476,923,076.4 -850,649,349.8 43.7 Median age for Other race residents-666,666,666.0 -641,807,909.0 38.7 Median age for Two or more races residents34.9 52.2 49.1 Median age for White alone residents44.5 53.0 40.2 Median age for Hispanic or Latino residents47.3 33.4
Owner/renter occupied households by race in Garden Home-Whitford
House owners and renters - White residents 2,006 68.8% Owner occupied911 31.2% Renter occupiedHouse owners and renters - Black or African American residents 7 100.0% Owner occupiedHouse owners and renters - American Indian / Alaska Native residents 23 100.0% Renter occupiedHouse owners and renters - Asian residents 107 62.0% Owner occupied65 38.0% Renter occupiedHouse owners and renters - Two or more races residents 255 76.2% Owner occupied80 23.8% Renter occupiedHouse owners and renters - White alone residents 1,992 68.0% Owner occupied936 32.0% Renter occupiedHouse owners and renters - Hispanic or Latino residents 124 73.5% Owner occupied44 26.5% Renter occupied
Language usage in Garden Home-Whitford
English speakers - Total 85.8% of residents of Garden Home-Whitford speak English at home.
2.4% of residents speak Spanish at home 142 89.9% Speak English very well16 10.1% Speak English less than very well10.6% of residents speak other language at home 561 79.7% Speak English very well143 20.3% Speak English less than very well
English speakers - Born in the United States 96.2% of residents of Garden Home-Whitford speak English at home.
0.8% of residents speak Spanish at home 23 100.0% Speak English very well1.5% of residents speak other language at home 44 100.0% Speak English very well
English speakers - Native, born elsewhere 81.2% of residents of Garden Home-Whitford speak English at home.
18.8% of residents speak other language at home 22 100.0% Speak English very well
English speakers - Foreign-born 23.9% of residents of Garden Home-Whitford speak English at home.
14.5% of residents speak Spanish at home 100 86.2% Speak English very well16 13.8% Speak English less than very well58.8% of residents speak other language at home 333 70.9% Speak English very well137 29.1% Speak English less than very well
White (Caucasian) - Speak only English Native:
97.0% (4,803)Foreign-born:
23.0% (73)
White (Caucasian) - Speak another language Native:
3.2% (160)Foreign-born:
76.3% (242)
Asian - Speak only English Native:
85.0% (124)Foreign-born:
42.8% (86)
Asian - Speak another language Native:
9.7% (14)Foreign-born:
50.3% (101)
Two or more races - Speak only English Native:
95.8% (481)Foreign-born:
22.8% (36)
Two or more races - Speak another language Native:
2.3% (12)Foreign-born:
76.8% (122)
White alone - Speak only English Native:
96.1% (4,804)Foreign-born:
19.5% (72)
White alone - Speak another language Native:
4.0% (199)Foreign-born:
80.3% (298)
Hispanic or Latino - Speak only English Native:
75.1% (184)Foreign-born:
8.2% (10)
Hispanic or Latino - Speak another language Native:
20.7% (51)Foreign-born:
91.2% (108)
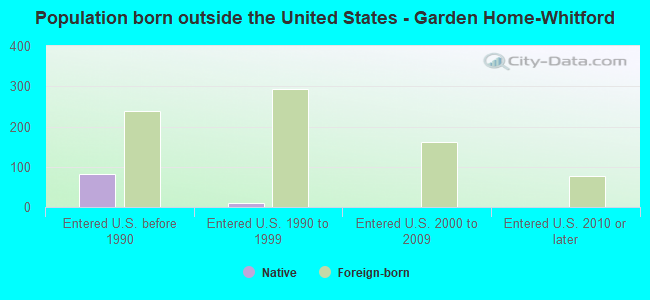
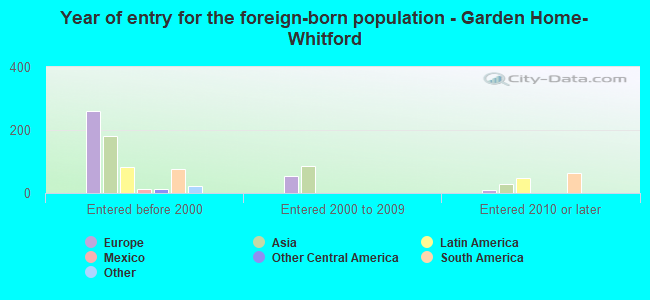
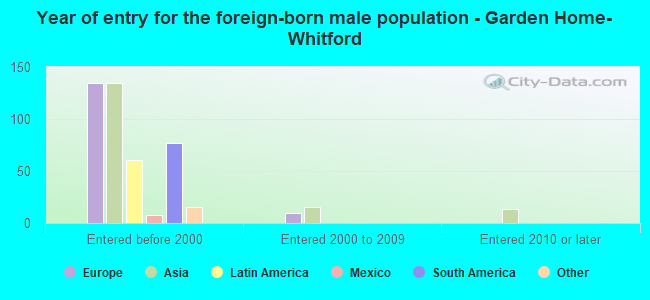
Foreign-born residents in Garden Home-Whitford 801 residents are foreign born (4.8% Europe , 4.2% Asia , 1.7% Latin America ).
This city:
11.3%Oregon:
9.8%
Marital status for residents in Garden Home-Whitford Marital status - White (Caucasian) population 15 years and over
Males 25.9% Never married51.2% Now married0.8% Separated0.0% Widowed22.0% DivorcedFemales 19.6% Never married47.9% Now married0.3% Separated12.3% Widowed19.9% DivorcedWomen who gave birth in the past 12 months Now married:
100.0% (73)Unmarried:
0.0% (0)
Women who did not give birth in the past 12 months Now married:
50.4% (426)Unmarried:
49.6% (420)
Marital status - American Indian / Alaska Native population 15 years and over
Males 100.0% Never married0.0% Now married0.0% Separated0.0% Widowed0.0% DivorcedFemales 0.0% Never married100.0% Now married0.0% Separated0.0% Widowed0.0% DivorcedWomen who did not give birth in the past 12 months Now married:
100.0% (25)Unmarried:
0.0% (0)
Marital status - Asian population 15 years and over
Males 18.3% Never married17.5% Now married0.0% Separated0.0% Widowed64.3% DivorcedFemales 27.9% Never married63.6% Now married0.0% Separated0.0% Widowed8.5% DivorcedWomen who did not give birth in the past 12 months Now married:
49.5% (56)Unmarried:
50.5% (58)
Marital status - Other race population 15 years and over
Males 32.8% Never married67.2% Now married0.0% Separated0.0% Widowed0.0% DivorcedFemales 91.7% Never married8.3% Now married0.0% Separated0.0% Widowed0.0% DivorcedWomen who did not give birth in the past 12 months Now married:
0.0% (0)Unmarried:
100.0% (15)
Marital status - Two or more races population 15 years and over
Males 46.2% Never married35.7% Now married0.0% Separated0.0% Widowed18.0% DivorcedFemales 51.1% Never married25.3% Now married11.2% Separated7.3% Widowed5.1% DivorcedWomen who did not give birth in the past 12 months Now married:
67.2% (48)Unmarried:
32.8% (23)
Marital status - White alone, not Hispanic / Latino population 15 years and over
Males 26.6% Never married50.4% Now married0.9% Separated0.0% Widowed22.2% DivorcedFemales 20.0% Never married47.2% Now married0.0% Separated12.5% Widowed20.3% DivorcedWomen who gave birth in the past 12 months Now married:
100.0% (78)Unmarried:
0.0% (0)
Women who did not give birth in the past 12 months Now married:
48.0% (410)Unmarried:
52.0% (444)
Marital status - Hispanic or Latino population 15 years and over
Males 15.4% Never married50.0% Now married0.0% Separated0.0% Widowed34.6% DivorcedFemales 13.7% Never married67.1% Now married19.2% Separated0.0% Widowed0.0% DivorcedWomen who did not give birth in the past 12 months Now married:
84.3% (111)Unmarried:
15.7% (21)
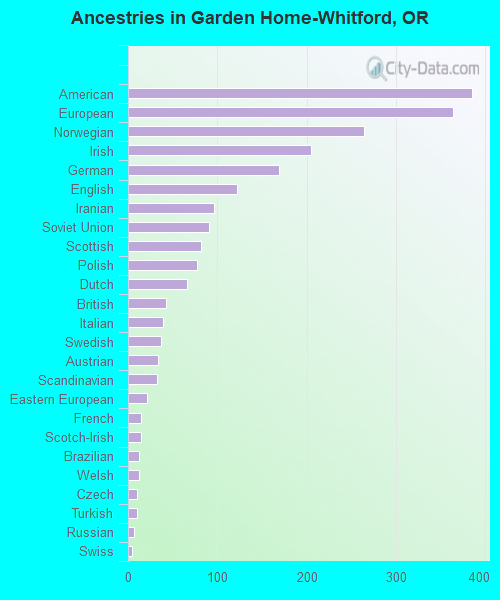
Ancestries in Garden Home-Whitford
385 11.9% American364 11.3% European264 8.2% Norwegian205 6.3% Irish169 5.2% German122 3.8% English96 3.0% Iranian91 2.8% Soviet Union82 2.5% Scottish77 2.4% Polish66 2.0% Dutch43 1.3% British39 1.2% Italian37 1.1% Swedish34 1.1% Austrian32 1.0% Scandinavian21 0.7% Eastern European14 0.4% French14 0.4% Scotch-Irish12 0.4% Brazilian12 0.4% Welsh10 0.3% Czech10 0.3% Turkish7 0.2% Russian5 0.2% Swiss5 0.2% Yugoslavian
Children Nativity (place of birth) in Garden Home-Whitford
Children under 6 years - Living with two parents Both parents native 261 100.0% NativeOne native, one foreign-born parent 125 100.0% NativeChildren under 6 years - Living with one parent Native parent 119 100.0% NativeChildren 6 to 17 years - Living with two parents Both parents native 377 100.0% NativeBoth parents foreign-born 43 100.0% NativeOne native, one foreign-born parent 48 100.0% NativeChildren 6 to 17 years - Living with one parent Native parent 184 100.0% NativeForeign-born parent 20 51.3% Native19 48.7% Foreign-born