Races in Gautier, Mississippi (MS) Detailed Stats
Data:
Races - White alone (%)
Races - White alone (% change since 2000)
Races - Black alone (%)
Races - Black alone (% change since 2000)
Races - American Indian alone (%)
Races - American Indian alone (% change since 2000)
Races - Asian alone (%)
Races - Asian alone (% change since 2000)
Races - Hispanic (%)
Races - Hispanic (% change since 2000)
Races - Native Hawaiian and Other Pacific Islander alone (%)
Races - Native Hawaiian and Other Pacific Islander alone (% change since 2000)
Races - Two or more races(%)
Races - Two or more races(% change since 2000)
Races - Other race alone (%)
Races - Other race alone (% change since 2000)
Racial diversity
Place of birth - Born in state of residence (%)
Place of birth - Born in state of residence (%) - White
Place of birth - Born in state of residence (%) - Black or African American
Place of birth - Born in state of residence (%) - Asian
Place of birth - Born in state of residence (%) - Hispanic or Latino
Place of birth - Born in state of residence (%) - American Indian and Alaska Native
Place of birth - Born in state of residence (%) - Multirace
Place of birth - Born in state of residence (%) - Other Race
Place of birth - Born in other state (%)
Place of birth - Born in other state (%) - White
Place of birth - Born in other state (%) - Black or African American
Place of birth - Born in other state (%) - Asian
Place of birth - Born in other state (%) - Hispanic or Latino
Place of birth - Born in other state (%) - American Indian and Alaska Native
Place of birth - Born in other state (%) - Multirace
Place of birth - Born in other state (%) - Other Race
Place of birth - Native, outside of US (%)
Place of birth - Native, outside of US (%) - White
Place of birth - Native, outside of US (%) - Black or African American
Place of birth - Native, outside of US (%) - Asian
Place of birth - Native, outside of US (%) - Hispanic or Latino
Place of birth - Native, outside of US (%) - American Indian and Alaska Native
Place of birth - Native, outside of US (%) - Multirace
Place of birth - Native, outside of US (%) - Other Race
Place of birth - Foreign born (%)
Place of birth - Foreign born (%) - White
Place of birth - Foreign born (%) - Black or African American
Place of birth - Foreign born (%) - Asian
Place of birth - Foreign born (%) - Hispanic or Latino
Place of birth - Foreign born (%) - American Indian and Alaska Native
Place of birth - Foreign born (%) - Multirace
Place of birth - Foreign born (%) - Other Race
Residents speaking English at home (%)
Residents speaking English at home - Born in the United States (%)
Residents speaking English at home - Native, born elsewhere (%)
Residents speaking English at home - Foreign born (%)
Residents speaking Spanish at home (%)
Residents speaking Spanish at home - Born in the United States (%)
Residents speaking Spanish at home - Native, born elsewhere (%)
Residents speaking Spanish at home - Foreign born (%)
Residents speaking other language at home (%)
Residents speaking other language at home - Born in the United States (%)
Residents speaking other language at home - Native, born elsewhere (%)
Residents speaking other language at home - Foreign born (%)
Marital status - Never married (%)
Marital status - Now married (%)
Marital status - Separated (%)
Marital status - Widowed (%)
Marital status - Divorced (%)
Ancestries Reported - Arab (%)
Ancestries Reported - Czech (%)
Ancestries Reported - Danish (%)
Ancestries Reported - Dutch (%)
Ancestries Reported - English (%)
Ancestries Reported - French (%)
Ancestries Reported - French Canadian (%)
Ancestries Reported - German (%)
Ancestries Reported - Greek (%)
Ancestries Reported - Hungarian (%)
Ancestries Reported - Irish (%)
Ancestries Reported - Italian (%)
Ancestries Reported - Lithuanian (%)
Ancestries Reported - Norwegian (%)
Ancestries Reported - Polish (%)
Ancestries Reported - Portuguese (%)
Ancestries Reported - Russian (%)
Ancestries Reported - Scotch-Irish (%)
Ancestries Reported - Scottish (%)
Ancestries Reported - Slovak (%)
Ancestries Reported - Subsaharan African (%)
Ancestries Reported - Swedish (%)
Ancestries Reported - Swiss (%)
Ancestries Reported - Ukrainian (%)
Ancestries Reported - United States (%)
Ancestries Reported - Welsh (%)
Ancestries Reported - West Indian (%)
Ancestries Reported - Other (%)
Geographical mobility - Same house 1 year ago (%)
Geographical mobility - Same house 1 year ago (%) - White
Geographical mobility - Same house 1 year ago (%) - Black or African American
Geographical mobility - Same house 1 year ago (%) - Asian
Geographical mobility - Same house 1 year ago (%) - Hispanic or Latino
Geographical mobility - Same house 1 year ago (%) - American Indian and Alaska Native
Geographical mobility - Same house 1 year ago (%) - Multirace
Geographical mobility - Same house 1 year ago (%) - Other Race
Geographical mobility - Moved within same county (%)
Geographical mobility - Moved within same county (%) - White
Geographical mobility - Moved within same county (%) - Black or African American
Geographical mobility - Moved within same county (%) - Asian
Geographical mobility - Moved within same county (%) - Hispanic or Latino
Geographical mobility - Moved within same county (%) - American Indian and Alaska Native
Geographical mobility - Moved within same county (%) - Multirace
Geographical mobility - Moved within same county (%) - Other Race
Geographical mobility - Moved from different county within same state (%)
Geographical mobility - Moved from different county within same state (%) - White
Geographical mobility - Moved from different county within same state (%) - Black or African American
Geographical mobility - Moved from different county within same state (%) - Asian
Geographical mobility - Moved from different county within same state (%) - Hispanic or Latino
Geographical mobility - Moved from different county within same state (%) - American Indian and Alaska Native
Geographical mobility - Moved from different county within same state (%) - Multirace
Geographical mobility - Moved from different county within same state (%) - Other Race
Geographical mobility - Moved from different state (%)
Geographical mobility - Moved from different state (%) - White
Geographical mobility - Moved from different state (%) - Black or African American
Geographical mobility - Moved from different state (%) - Asian
Geographical mobility - Moved from different state (%) - Hispanic or Latino
Geographical mobility - Moved from different state (%) - American Indian and Alaska Native
Geographical mobility - Moved from different state (%) - Multirace
Geographical mobility - Moved from different state (%) - Other Race
Geographical mobility - Moved from abroad (%)
Geographical mobility - Moved from abroad (%) - White
Geographical mobility - Moved from abroad (%) - Black or African American
Geographical mobility - Moved from abroad (%) - Asian
Geographical mobility - Moved from abroad (%) - Hispanic or Latino
Geographical mobility - Moved from abroad (%) - American Indian and Alaska Native
Geographical mobility - Moved from abroad (%) - Multirace
Geographical mobility - Moved from abroad (%) - Other Race
Place of birth for the foreign-born population - Ireland (%)
Place of birth for the foreign-born population - Denmark (%)
Place of birth for the foreign-born population - Norway (%)
Place of birth for the foreign-born population - Sweden (%)
Place of birth for the foreign-born population - United Kingdom (%)
Place of birth for the foreign-born population - England (%)
Place of birth for the foreign-born population - Scotland (%)
Place of birth for the foreign-born population - Other Northern Europe (%)
Place of birth for the foreign-born population - Austria (%)
Place of birth for the foreign-born population - Belgium (%)
Place of birth for the foreign-born population - France (%)
Place of birth for the foreign-born population - Germany (%)
Place of birth for the foreign-born population - Netherlands (%)
Place of birth for the foreign-born population - Switzerland (%)
Place of birth for the foreign-born population - Other Western Europe (%)
Place of birth for the foreign-born population - Greece (%)
Place of birth for the foreign-born population - Italy (%)
Place of birth for the foreign-born population - Portugal (%)
Place of birth for the foreign-born population - Spain (%)
Place of birth for the foreign-born population - Other Southern Europe (%)
Place of birth for the foreign-born population - Albania (%)
Place of birth for the foreign-born population - Belarus (%)
Place of birth for the foreign-born population - Bosnia and Herzegovina (%)
Place of birth for the foreign-born population - Bulgaria (%)
Place of birth for the foreign-born population - Croatia (%)
Place of birth for the foreign-born population - Czechoslovakia (%)
Place of birth for the foreign-born population - Hungary (%)
Place of birth for the foreign-born population - Latvia (%)
Place of birth for the foreign-born population - Lithuania (%)
Place of birth for the foreign-born population - North Macedonia (Macedonia) (%)
Place of birth for the foreign-born population - Moldova (%)
Place of birth for the foreign-born population - Poland (%)
Place of birth for the foreign-born population - Romania (%)
Place of birth for the foreign-born population - Russia (%)
Place of birth for the foreign-born population - Serbia (%)
Place of birth for the foreign-born population - Ukraine (%)
Place of birth for the foreign-born population - Other Eastern Europe (%)
Place of birth for the foreign-born population - China (%)
Place of birth for the foreign-born population - Hong Kong (%)
Place of birth for the foreign-born population - Taiwan (%)
Place of birth for the foreign-born population - Japan (%)
Place of birth for the foreign-born population - Korea (%)
Place of birth for the foreign-born population - Other Eastern Asia (%)
Place of birth for the foreign-born population - Afghanistan (%)
Place of birth for the foreign-born population - Bangladesh (%)
Place of birth for the foreign-born population - India (%)
Place of birth for the foreign-born population - Iran (%)
Place of birth for the foreign-born population - Kazakhstan (%)
Place of birth for the foreign-born population - Nepal (%)
Place of birth for the foreign-born population - Pakistan (%)
Place of birth for the foreign-born population - Sri Lanka (%)
Place of birth for the foreign-born population - Uzbekistan (%)
Place of birth for the foreign-born population - Other South Central Asia (%)
Place of birth for the foreign-born population - Burma (%)
Place of birth for the foreign-born population - Cambodia (%)
Place of birth for the foreign-born population - Indonesia (%)
Place of birth for the foreign-born population - Laos (%)
Place of birth for the foreign-born population - Malaysia (%)
Place of birth for the foreign-born population - Philippines (%)
Place of birth for the foreign-born population - Singapore (%)
Place of birth for the foreign-born population - Thailand (%)
Place of birth for the foreign-born population - Vietnam (%)
Place of birth for the foreign-born population - Other South Eastern Asia (%)
Place of birth for the foreign-born population - Armenia (%)
Place of birth for the foreign-born population - Iraq (%)
Place of birth for the foreign-born population - Israel (%)
Place of birth for the foreign-born population - Jordan (%)
Place of birth for the foreign-born population - Kuwait (%)
Place of birth for the foreign-born population - Lebanon (%)
Place of birth for the foreign-born population - Saudi Arabia (%)
Place of birth for the foreign-born population - Syria (%)
Place of birth for the foreign-born population - Turkey (%)
Place of birth for the foreign-born population - Yemen (%)
Place of birth for the foreign-born population - Other Western Asia (%)
Place of birth for the foreign-born population - Eritrea (%)
Place of birth for the foreign-born population - Ethiopia (%)
Place of birth for the foreign-born population - Kenya (%)
Place of birth for the foreign-born population - Somalia (%)
Place of birth for the foreign-born population - Uganda (%)
Place of birth for the foreign-born population - Zimbabwe (%)
Place of birth for the foreign-born population - Other Eastern Africa (%)
Place of birth for the foreign-born population - Cameroon (%)
Place of birth for the foreign-born population - Congo (%)
Place of birth for the foreign-born population - Democratic Republic of Congo (Zaire) (%)
Place of birth for the foreign-born population - Other Middle Africa (%)
Place of birth for the foreign-born population - Egypt (%)
Place of birth for the foreign-born population - Morocco (%)
Place of birth for the foreign-born population - Sudan (%)
Place of birth for the foreign-born population - Other Northern Africa (%)
Place of birth for the foreign-born population - South Africa (%)
Place of birth for the foreign-born population - Other Southern Africa (%)
Place of birth for the foreign-born population - Cabo Verde (%)
Place of birth for the foreign-born population - Ghana (%)
Place of birth for the foreign-born population - Liberia (%)
Place of birth for the foreign-born population - Nigeria (%)
Place of birth for the foreign-born population - Senegal (%)
Place of birth for the foreign-born population - Sierra Leone (%)
Place of birth for the foreign-born population - Other Western Africa (%)
Place of birth for the foreign-born population - Australia (%)
Place of birth for the foreign-born population - New Zealand (%)
Place of birth for the foreign-born population - Fiji (%)
Place of birth for the foreign-born population - Micronesia (%)
Place of birth for the foreign-born population - Bahamas (%)
Place of birth for the foreign-born population - Barbados (%)
Place of birth for the foreign-born population - Cuba (%)
Place of birth for the foreign-born population - Dominica (%)
Place of birth for the foreign-born population - Dominican Republic (%)
Place of birth for the foreign-born population - Grenada (%)
Place of birth for the foreign-born population - Haiti (%)
Place of birth for the foreign-born population - Jamaica (%)
Place of birth for the foreign-born population - St. Vincent and the Grenadines (%)
Place of birth for the foreign-born population - Trinidad and Tobago (%)
Place of birth for the foreign-born population - West Indies (%)
Place of birth for the foreign-born population - Other Caribbean (%)
Place of birth for the foreign-born population - Belize (%)
Place of birth for the foreign-born population - Costa Rica (%)
Place of birth for the foreign-born population - El Salvador (%)
Place of birth for the foreign-born population - Guatemala (%)
Place of birth for the foreign-born population - Honduras (%)
Place of birth for the foreign-born population - Mexico (%)
Place of birth for the foreign-born population - Nicaragua (%)
Place of birth for the foreign-born population - Panama (%)
Place of birth for the foreign-born population - Other Central America (%)
Place of birth for the foreign-born population - Argentina (%)
Place of birth for the foreign-born population - Bolivia (%)
Place of birth for the foreign-born population - Brazil (%)
Place of birth for the foreign-born population - Chile (%)
Place of birth for the foreign-born population - Colombia (%)
Place of birth for the foreign-born population - Ecuador (%)
Place of birth for the foreign-born population - Guyana (%)
Place of birth for the foreign-born population - Peru (%)
Place of birth for the foreign-born population - Uruguay (%)
Place of birth for the foreign-born population - Venezuela (%)
Place of birth for the foreign-born population - Other South America (%)
Place of birth for the foreign-born population - Canada (%)
Place of birth for the foreign-born population - Other Northern America (%)
Place of birth for the foreign-born population - Other (%)
Latest news about races in Gautier, MS collected exclusively by city-data.com from local newspapers, TV, and radio stations
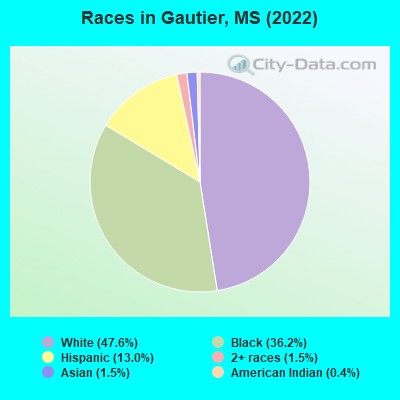
According to 2022 data, the most numerous races in Gautier, MS are White alone (9,135 residents), Black alone (6,946 residents), and Hispanic (2,487 residents). 90.1% of Gautier residents speak English at home. 4.2% of Gautier, MS residents are foreign-born (2.2% born in Latin America, 1.7% born in Asia), which is 52.4% greater than the foreign-born rate of 2.0% across the entire state of Mississippi.
Race distribution in Gautier
2000 2022
1,727,908 60.7% White alone 1,028,473 36.2% Black alone 39,569 1.4% Hispanic 17,272 0.6% Two or more races 18,349 0.6% Asian alone 11,224 0.4% American Indian alone 1,294 0.05% Other race alone 569 0.02% Native Hawaiian and Other
1,625,979 55.3% White alone 1,072,962 36.5% Black alone 97,177 3.3% Hispanic 96,367 3.3% Two or more races 25,217 0.9% Asian alone 12,457 0.4% American Indian alone 9,501 0.3% Other race alone 397 0.01% Native Hawaiian and Other
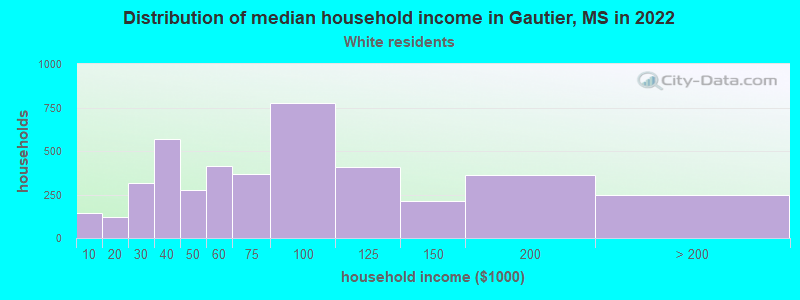
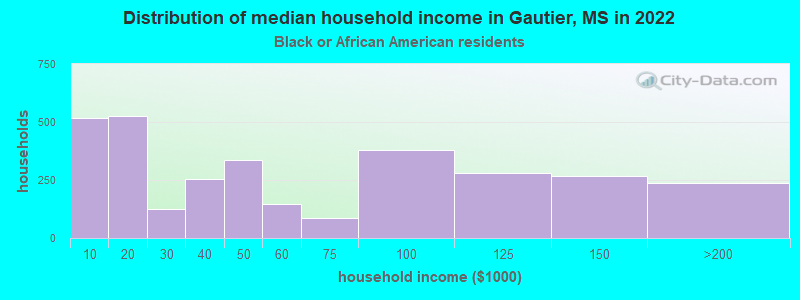
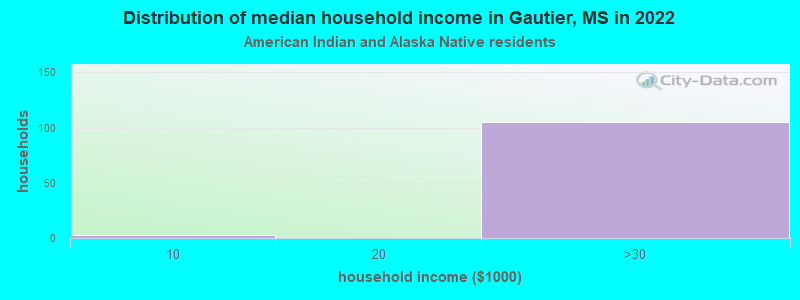
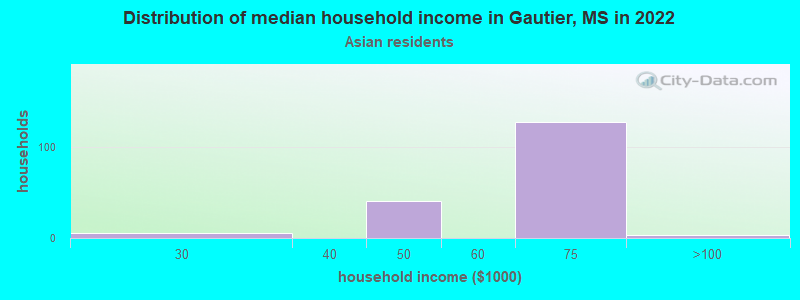
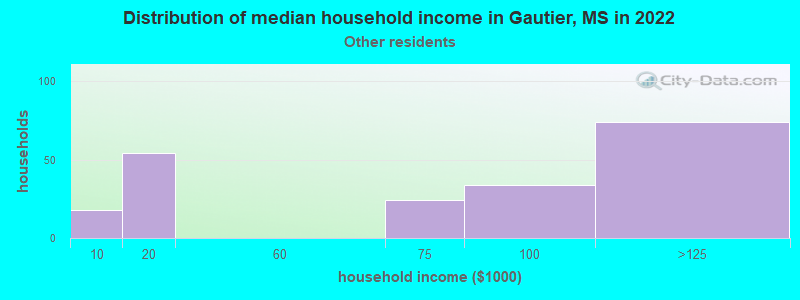
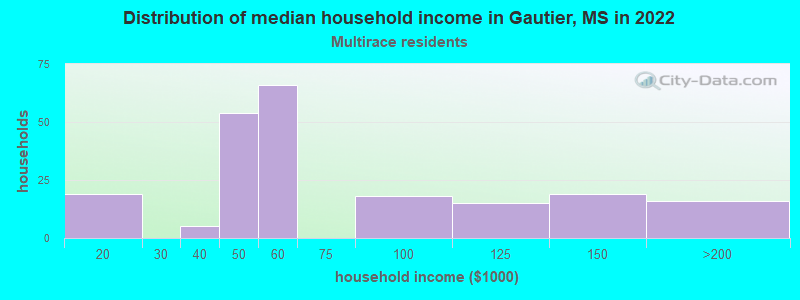
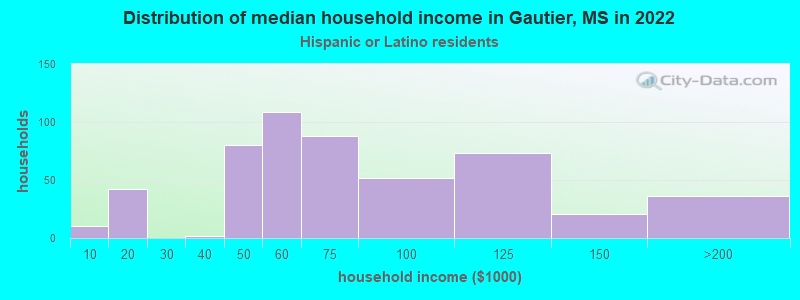
Income and house value in Gautier Median household income in 2022 $66,051 White non-Hispanic householders$41,012 Black householders$49,432 Asian householders$51,086 Two or more races householders$99,721 Hispanic or Latino race householdersMedian 2022 house value $183,094 White Non-Hispanic householders$126,586 Black or African American householders$172,157 American Indian or Alaska Native householders $92,964 Asian householders$205,170 Two or more races householders
Median age by race in Gautier
46.8 Median age for White residents43.7 49.0 41.0 Median age for Black or African American residents40.8 43.9 20.0 Median age for American Indian / Alaska Native residents20.3 -710,601,718.5 44.2 Median age for Asian residents45.6 65.0 -666,666,666.0 Median age for Native Hawaiian / Pacific Islander residents-666,666,666.0 -666,666,666.0 44.5 Median age for Other race residents64.4 34.4 18.0 Median age for Two or more races residents12.6 26.1 47.9 Median age for White alone residents44.3 49.3 29.2 Median age for Hispanic or Latino residents28.6 34.0
Owner/renter occupied households by race in Gautier
House owners and renters - White residents 3,198 76.6% Owner occupied974 23.4% Renter occupiedHouse owners and renters - Black or African American residents 1,438 47.0% Owner occupied1,621 53.0% Renter occupiedHouse owners and renters - American Indian / Alaska Native residents 91 100.0% Renter occupiedHouse owners and renters - Asian residents 111 70.5% Owner occupied47 29.5% Renter occupiedHouse owners and renters - Other race residents 134 85.0% Owner occupied24 15.0% Renter occupiedHouse owners and renters - Two or more races residents 180 80.9% Owner occupied43 19.1% Renter occupiedHouse owners and renters - White alone residents 3,116 78.1% Owner occupied874 21.9% Renter occupiedHouse owners and renters - Hispanic or Latino residents 299 70.1% Owner occupied128 29.9% Renter occupied
Language usage in Gautier
English speakers - Total 90.1% of residents of Gautier speak English at home.
7.0% of residents speak Spanish at home 883 67.9% Speak English very well417 32.1% Speak English less than very well2.5% of residents speak other language at home 340 72.8% Speak English very well127 27.2% Speak English less than very well
English speakers - Born in the United States 93.8% of residents of Gautier speak English at home.
3.3% of residents speak Spanish at home 177 85.5% Speak English very well30 14.5% Speak English less than very well0.7% of residents speak other language at home 46 100.0% Speak English very well
English speakers - Native, born elsewhere 32.7% of residents of Gautier speak English at home.
48.4% of residents speak Spanish at home 269 62.3% Speak English very well163 37.7% Speak English less than very well
English speakers - Foreign-born 11.1% of residents of Gautier speak English at home.
64.2% of residents speak Spanish at home 206 54.1% Speak English very well175 45.9% Speak English less than very well49.9% of residents speak other language at home 166 56.1% Speak English very well130 43.9% Speak English less than very well
White (Caucasian) - Speak only English Native:
95.0% (8,811)Foreign-born:
40.2% (32)
White (Caucasian) - Speak another language Native:
4.8% (441)Foreign-born:
82.7% (66)
Asian - Speak another language Native:
100.0% (79)Foreign-born:
85.6% (257)
Other race - Speak another language Native:
45.7% (264)Foreign-born:
76.9% (115)
Two or more races - Speak another language Native:
26.2% (228)Foreign-born:
100.0% (73)
White alone - Speak only English Native:
98.6% (8,677)Foreign-born:
33.3% (14)
White alone - Speak another language Native:
1.6% (144)Foreign-born:
41.8% (18)
Hispanic or Latino - Speak only English Native:
63.6% (1,414)Foreign-born:
7.2% (29)
Hispanic or Latino - Speak another language Native:
38.5% (856)Foreign-born:
99.2% (398)
Foreign-born residents in Gautier 805 residents are foreign born (2.2% Latin America , 1.7% Asia ).
This city:
4.2%Mississippi:
2.3%
Marital status for residents in Gautier Marital status - White (Caucasian) population 15 years and over
Males 25.0% Never married59.2% Now married2.6% Separated2.3% Widowed11.0% DivorcedFemales 20.1% Never married48.8% Now married4.4% Separated13.4% Widowed13.3% DivorcedWomen who gave birth in the past 12 months Now married:
100.0% (90)Unmarried:
0.0% (0)
Women who did not give birth in the past 12 months Now married:
51.0% (1,046)Unmarried:
49.0% (1,005)
Marital status - Black or African American population 15 years and over
Males 45.6% Never married38.5% Now married0.0% Separated2.6% Widowed13.4% DivorcedFemales 39.2% Never married28.9% Now married11.7% Separated4.6% Widowed15.6% DivorcedWomen who gave birth in the past 12 months Now married:
0.0% (0)Unmarried:
100.0% (67)
Women who did not give birth in the past 12 months Now married:
36.7% (667)Unmarried:
63.3% (1,149)
Marital status - American Indian / Alaska Native population 15 years and over
Males 100.0% Never married0.0% Now married0.0% Separated0.0% Widowed0.0% DivorcedFemales 0.0% Never married39.7% Now married0.0% Separated0.0% Widowed60.3% DivorcedWomen who did not give birth in the past 12 months Now married:
100.0% (25)Unmarried:
0.0% (0)
Marital status - Asian population 15 years and over
Males 34.9% Never married58.4% Now married0.0% Separated0.0% Widowed6.7% DivorcedFemales 36.8% Never married53.2% Now married0.0% Separated9.9% Widowed0.0% DivorcedWomen who did not give birth in the past 12 months Now married:
51.9% (58)Unmarried:
48.1% (53)
Marital status - Other race population 15 years and over
Males 35.9% Never married64.1% Now married0.0% Separated0.0% Widowed0.0% DivorcedFemales 6.0% Never married94.0% Now married0.0% Separated0.0% Widowed0.0% DivorcedWomen who did not give birth in the past 12 months Now married:
93.7% (384)Unmarried:
6.3% (26)
Marital status - Two or more races population 15 years and over
Males 53.0% Never married40.6% Now married0.0% Separated0.0% Widowed6.4% DivorcedFemales 47.7% Never married40.4% Now married0.0% Separated4.6% Widowed7.3% DivorcedWomen who gave birth in the past 12 months Now married:
60.0% (67)Unmarried:
40.0% (45)
Women who did not give birth in the past 12 months Now married:
20.0% (31)Unmarried:
80.0% (125)
Marital status - White alone, not Hispanic / Latino population 15 years and over
Males 23.7% Never married61.9% Now married2.0% Separated2.5% Widowed9.9% DivorcedFemales 18.3% Never married51.1% Now married2.6% Separated14.6% Widowed13.4% DivorcedWomen who gave birth in the past 12 months Now married:
100.0% (92)Unmarried:
0.0% (0)
Women who did not give birth in the past 12 months Now married:
53.0% (948)Unmarried:
47.0% (839)
Marital status - Hispanic or Latino population 15 years and over
Males 48.8% Never married40.0% Now married3.3% Separated0.0% Widowed7.9% DivorcedFemales 25.3% Never married52.5% Now married11.4% Separated0.4% Widowed10.4% DivorcedWomen who gave birth in the past 12 months Now married:
100.0% (40)Unmarried:
0.0% (0)
Women who did not give birth in the past 12 months Now married:
61.6% (523)Unmarried:
38.4% (326)
Ancestries in Gautier
1,128 10.7% English784 7.4% American284 2.7% European277 2.6% Irish233 2.2% German216 2.0% Italian190 1.8% French182 1.7% Scottish82 0.8% Scotch-Irish57 0.5% British50 0.5% Northern European49 0.5% African31 0.3% Polish17 0.2% Swedish13 0.1% Czech13 0.1% Ukrainian7 0.07% Russian
Children Nativity (place of birth) in Gautier
Children under 6 years - Living with two parents Both parents native 425 100.0% NativeOne native, one foreign-born parent 12 100.0% NativeChildren under 6 years - Living with one parent Native parent 488 100.0% NativeChildren 6 to 17 years - Living with two parents Both parents native 1,731 100.0% NativeBoth parents foreign-born 76 57.0% Native57 43.0% Foreign-bornOne native, one foreign-born parent 19 100.0% NativeChildren 6 to 17 years - Living with one parent Native parent 1,249 100.0% Native
Grandparents responsible for own grandchildren in Gautier
Grandparents (30 to 59 years) White / Caucasian 12 100.0% Responsible for grandchildrenBlack or African American 23 9.8% Responsible for grandchildren213 90.2% Not responsible for grandchildrenWhite alone, not Hispanic / Latino 12 100.0% Responsible for grandchildrenGrandparents (60 years and over) White / Caucasian 91 100.0% Not responsible for grandchildrenBlack or African American 42 75.4% Responsible for grandchildren14 24.6% Not responsible for grandchildrenWhite alone, not Hispanic / Latino 96 100.0% Not responsible for grandchildren