Races in Gilroy, California (CA) Detailed Stats
Data:
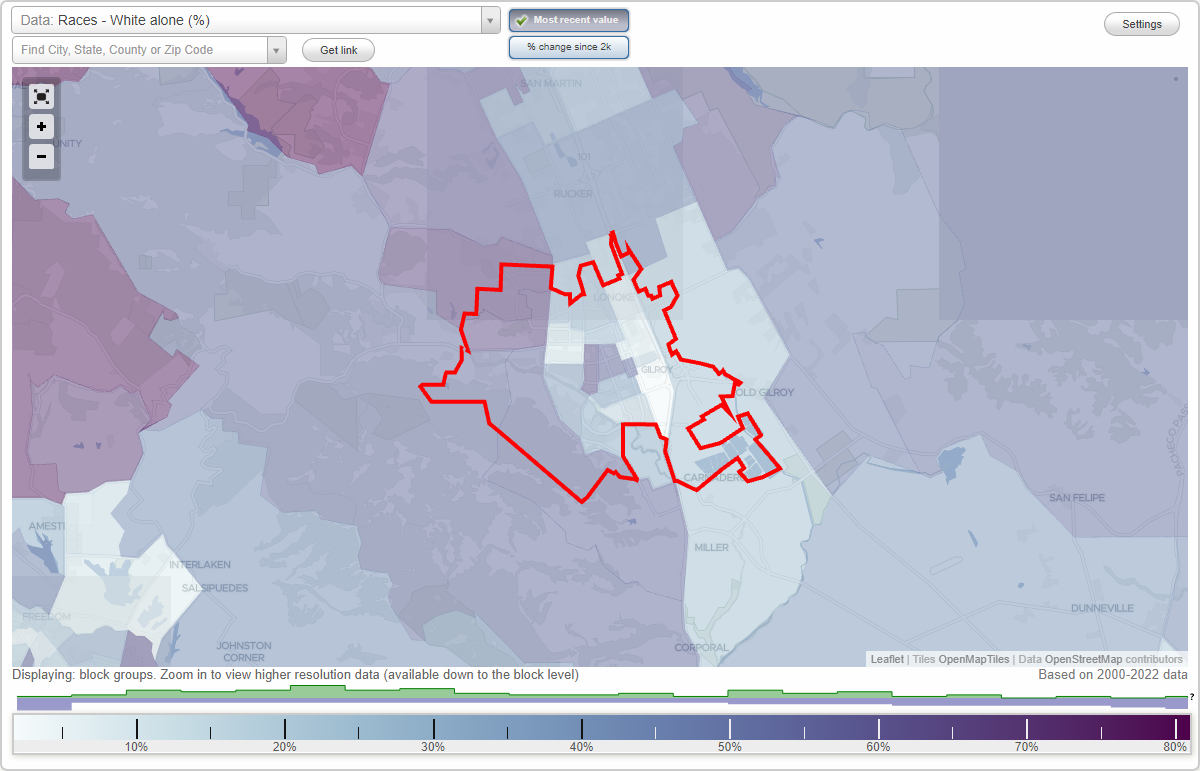
Races - White alone (%)
Races - White alone (% change since 2000)
Races - Black alone (%)
Races - Black alone (% change since 2000)
Races - American Indian alone (%)
Races - American Indian alone (% change since 2000)
Races - Asian alone (%)
Races - Asian alone (% change since 2000)
Races - Hispanic (%)
Races - Hispanic (% change since 2000)
Races - Native Hawaiian and Other Pacific Islander alone (%)
Races - Native Hawaiian and Other Pacific Islander alone (% change since 2000)
Races - Two or more races(%)
Races - Two or more races(% change since 2000)
Races - Other race alone (%)
Races - Other race alone (% change since 2000)
Racial diversity
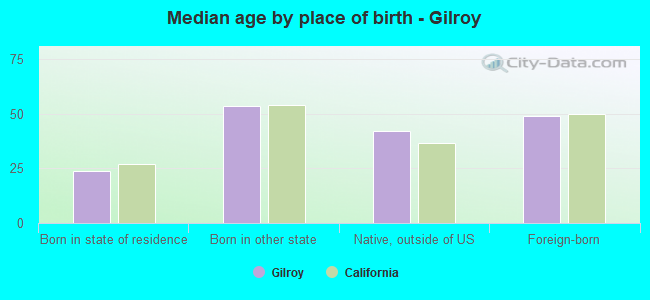
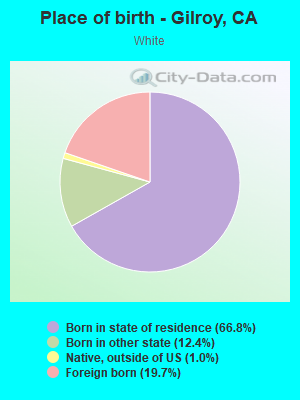
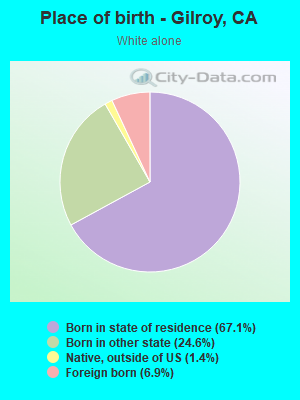
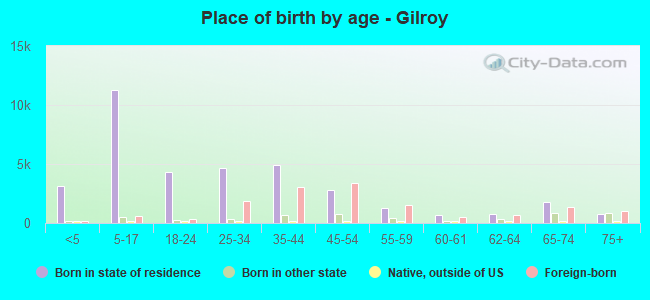
Place of birth - Born in state of residence (%)
Place of birth - Born in state of residence (%) - White
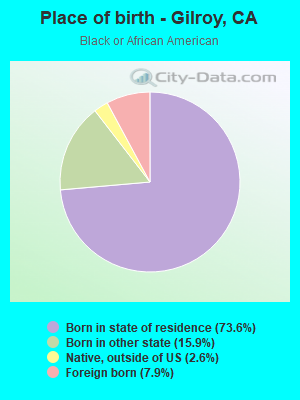
Place of birth - Born in state of residence (%) - Black or African American
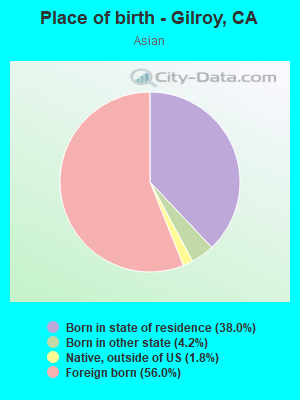
Place of birth - Born in state of residence (%) - Asian
Place of birth - Born in state of residence (%) - Hispanic or Latino
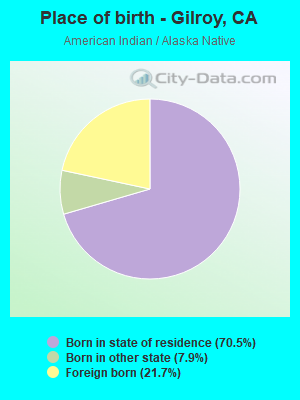
Place of birth - Born in state of residence (%) - American Indian and Alaska Native
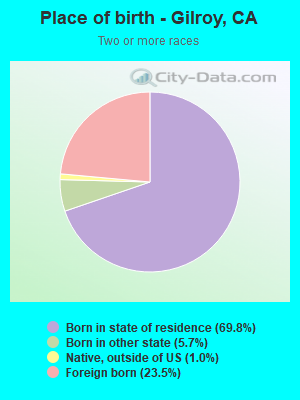
Place of birth - Born in state of residence (%) - Multirace
Place of birth - Born in state of residence (%) - Other Race
Place of birth - Born in other state (%)
Place of birth - Born in other state (%) - White
Place of birth - Born in other state (%) - Black or African American
Place of birth - Born in other state (%) - Asian
Place of birth - Born in other state (%) - Hispanic or Latino
Place of birth - Born in other state (%) - American Indian and Alaska Native
Place of birth - Born in other state (%) - Multirace
Place of birth - Born in other state (%) - Other Race
Place of birth - Native, outside of US (%)
Place of birth - Native, outside of US (%) - White
Place of birth - Native, outside of US (%) - Black or African American
Place of birth - Native, outside of US (%) - Asian
Place of birth - Native, outside of US (%) - Hispanic or Latino
Place of birth - Native, outside of US (%) - American Indian and Alaska Native
Place of birth - Native, outside of US (%) - Multirace
Place of birth - Native, outside of US (%) - Other Race
Place of birth - Foreign born (%)
Place of birth - Foreign born (%) - White
Place of birth - Foreign born (%) - Black or African American
Place of birth - Foreign born (%) - Asian
Place of birth - Foreign born (%) - Hispanic or Latino
Place of birth - Foreign born (%) - American Indian and Alaska Native
Place of birth - Foreign born (%) - Multirace
Place of birth - Foreign born (%) - Other Race
Residents speaking English at home (%)
Residents speaking English at home - Born in the United States (%)
Residents speaking English at home - Native, born elsewhere (%)
Residents speaking English at home - Foreign born (%)
Residents speaking Spanish at home (%)
Residents speaking Spanish at home - Born in the United States (%)
Residents speaking Spanish at home - Native, born elsewhere (%)
Residents speaking Spanish at home - Foreign born (%)
Residents speaking other language at home (%)
Residents speaking other language at home - Born in the United States (%)
Residents speaking other language at home - Native, born elsewhere (%)
Residents speaking other language at home - Foreign born (%)
Marital status - Never married (%)
Marital status - Now married (%)
Marital status - Separated (%)
Marital status - Widowed (%)
Marital status - Divorced (%)
Ancestries Reported - Arab (%)
Ancestries Reported - Czech (%)
Ancestries Reported - Danish (%)
Ancestries Reported - Dutch (%)
Ancestries Reported - English (%)
Ancestries Reported - French (%)
Ancestries Reported - French Canadian (%)
Ancestries Reported - German (%)
Ancestries Reported - Greek (%)
Ancestries Reported - Hungarian (%)
Ancestries Reported - Irish (%)
Ancestries Reported - Italian (%)
Ancestries Reported - Lithuanian (%)
Ancestries Reported - Norwegian (%)
Ancestries Reported - Polish (%)
Ancestries Reported - Portuguese (%)
Ancestries Reported - Russian (%)
Ancestries Reported - Scotch-Irish (%)
Ancestries Reported - Scottish (%)
Ancestries Reported - Slovak (%)
Ancestries Reported - Subsaharan African (%)
Ancestries Reported - Swedish (%)
Ancestries Reported - Swiss (%)
Ancestries Reported - Ukrainian (%)
Ancestries Reported - United States (%)
Ancestries Reported - Welsh (%)
Ancestries Reported - West Indian (%)
Ancestries Reported - Other (%)
Geographical mobility - Same house 1 year ago (%)
Geographical mobility - Same house 1 year ago (%) - White
Geographical mobility - Same house 1 year ago (%) - Black or African American
Geographical mobility - Same house 1 year ago (%) - Asian
Geographical mobility - Same house 1 year ago (%) - Hispanic or Latino
Geographical mobility - Same house 1 year ago (%) - American Indian and Alaska Native
Geographical mobility - Same house 1 year ago (%) - Multirace
Geographical mobility - Same house 1 year ago (%) - Other Race
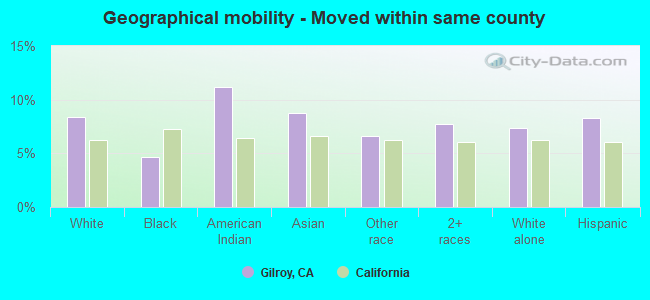
Geographical mobility - Moved within same county (%)
Geographical mobility - Moved within same county (%) - White
Geographical mobility - Moved within same county (%) - Black or African American
Geographical mobility - Moved within same county (%) - Asian
Geographical mobility - Moved within same county (%) - Hispanic or Latino
Geographical mobility - Moved within same county (%) - American Indian and Alaska Native
Geographical mobility - Moved within same county (%) - Multirace
Geographical mobility - Moved within same county (%) - Other Race
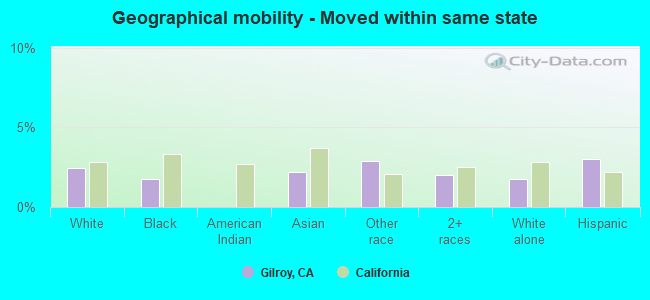
Geographical mobility - Moved from different county within same state (%)
Geographical mobility - Moved from different county within same state (%) - White
Geographical mobility - Moved from different county within same state (%) - Black or African American
Geographical mobility - Moved from different county within same state (%) - Asian
Geographical mobility - Moved from different county within same state (%) - Hispanic or Latino
Geographical mobility - Moved from different county within same state (%) - American Indian and Alaska Native
Geographical mobility - Moved from different county within same state (%) - Multirace
Geographical mobility - Moved from different county within same state (%) - Other Race
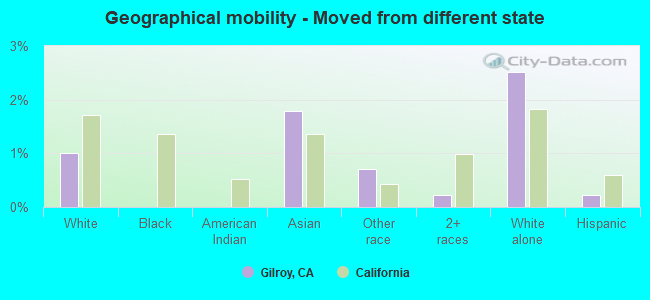
Geographical mobility - Moved from different state (%)
Geographical mobility - Moved from different state (%) - White
Geographical mobility - Moved from different state (%) - Black or African American
Geographical mobility - Moved from different state (%) - Asian
Geographical mobility - Moved from different state (%) - Hispanic or Latino
Geographical mobility - Moved from different state (%) - American Indian and Alaska Native
Geographical mobility - Moved from different state (%) - Multirace
Geographical mobility - Moved from different state (%) - Other Race
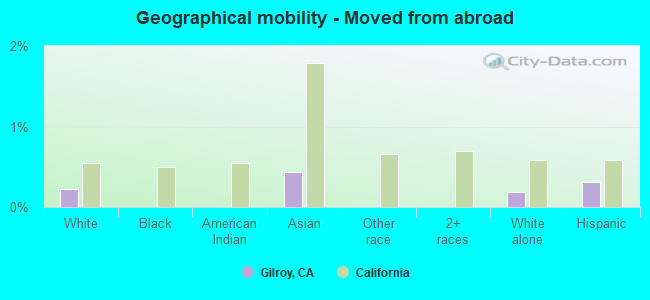
Geographical mobility - Moved from abroad (%)
Geographical mobility - Moved from abroad (%) - White
Geographical mobility - Moved from abroad (%) - Black or African American
Geographical mobility - Moved from abroad (%) - Asian
Geographical mobility - Moved from abroad (%) - Hispanic or Latino
Geographical mobility - Moved from abroad (%) - American Indian and Alaska Native
Geographical mobility - Moved from abroad (%) - Multirace
Geographical mobility - Moved from abroad (%) - Other Race
Place of birth for the foreign-born population - Ireland (%)
Place of birth for the foreign-born population - Denmark (%)
Place of birth for the foreign-born population - Norway (%)
Place of birth for the foreign-born population - Sweden (%)
Place of birth for the foreign-born population - United Kingdom (%)
Place of birth for the foreign-born population - England (%)
Place of birth for the foreign-born population - Scotland (%)
Place of birth for the foreign-born population - Other Northern Europe (%)
Place of birth for the foreign-born population - Austria (%)
Place of birth for the foreign-born population - Belgium (%)
Place of birth for the foreign-born population - France (%)
Place of birth for the foreign-born population - Germany (%)
Place of birth for the foreign-born population - Netherlands (%)
Place of birth for the foreign-born population - Switzerland (%)
Place of birth for the foreign-born population - Other Western Europe (%)
Place of birth for the foreign-born population - Greece (%)
Place of birth for the foreign-born population - Italy (%)
Place of birth for the foreign-born population - Portugal (%)
Place of birth for the foreign-born population - Spain (%)
Place of birth for the foreign-born population - Other Southern Europe (%)
Place of birth for the foreign-born population - Albania (%)
Place of birth for the foreign-born population - Belarus (%)
Place of birth for the foreign-born population - Bosnia and Herzegovina (%)
Place of birth for the foreign-born population - Bulgaria (%)
Place of birth for the foreign-born population - Croatia (%)
Place of birth for the foreign-born population - Czechoslovakia (%)
Place of birth for the foreign-born population - Hungary (%)
Place of birth for the foreign-born population - Latvia (%)
Place of birth for the foreign-born population - Lithuania (%)
Place of birth for the foreign-born population - North Macedonia (Macedonia) (%)
Place of birth for the foreign-born population - Moldova (%)
Place of birth for the foreign-born population - Poland (%)
Place of birth for the foreign-born population - Romania (%)
Place of birth for the foreign-born population - Russia (%)
Place of birth for the foreign-born population - Serbia (%)
Place of birth for the foreign-born population - Ukraine (%)
Place of birth for the foreign-born population - Other Eastern Europe (%)
Place of birth for the foreign-born population - China (%)
Place of birth for the foreign-born population - Hong Kong (%)
Place of birth for the foreign-born population - Taiwan (%)
Place of birth for the foreign-born population - Japan (%)
Place of birth for the foreign-born population - Korea (%)
Place of birth for the foreign-born population - Other Eastern Asia (%)
Place of birth for the foreign-born population - Afghanistan (%)
Place of birth for the foreign-born population - Bangladesh (%)
Place of birth for the foreign-born population - India (%)
Place of birth for the foreign-born population - Iran (%)
Place of birth for the foreign-born population - Kazakhstan (%)
Place of birth for the foreign-born population - Nepal (%)
Place of birth for the foreign-born population - Pakistan (%)
Place of birth for the foreign-born population - Sri Lanka (%)
Place of birth for the foreign-born population - Uzbekistan (%)
Place of birth for the foreign-born population - Other South Central Asia (%)
Place of birth for the foreign-born population - Burma (%)
Place of birth for the foreign-born population - Cambodia (%)
Place of birth for the foreign-born population - Indonesia (%)
Place of birth for the foreign-born population - Laos (%)
Place of birth for the foreign-born population - Malaysia (%)
Place of birth for the foreign-born population - Philippines (%)
Place of birth for the foreign-born population - Singapore (%)
Place of birth for the foreign-born population - Thailand (%)
Place of birth for the foreign-born population - Vietnam (%)
Place of birth for the foreign-born population - Other South Eastern Asia (%)
Place of birth for the foreign-born population - Armenia (%)
Place of birth for the foreign-born population - Iraq (%)
Place of birth for the foreign-born population - Israel (%)
Place of birth for the foreign-born population - Jordan (%)
Place of birth for the foreign-born population - Kuwait (%)
Place of birth for the foreign-born population - Lebanon (%)
Place of birth for the foreign-born population - Saudi Arabia (%)
Place of birth for the foreign-born population - Syria (%)
Place of birth for the foreign-born population - Turkey (%)
Place of birth for the foreign-born population - Yemen (%)
Place of birth for the foreign-born population - Other Western Asia (%)
Place of birth for the foreign-born population - Eritrea (%)
Place of birth for the foreign-born population - Ethiopia (%)
Place of birth for the foreign-born population - Kenya (%)
Place of birth for the foreign-born population - Somalia (%)
Place of birth for the foreign-born population - Uganda (%)
Place of birth for the foreign-born population - Zimbabwe (%)
Place of birth for the foreign-born population - Other Eastern Africa (%)
Place of birth for the foreign-born population - Cameroon (%)
Place of birth for the foreign-born population - Congo (%)
Place of birth for the foreign-born population - Democratic Republic of Congo (Zaire) (%)
Place of birth for the foreign-born population - Other Middle Africa (%)
Place of birth for the foreign-born population - Egypt (%)
Place of birth for the foreign-born population - Morocco (%)
Place of birth for the foreign-born population - Sudan (%)
Place of birth for the foreign-born population - Other Northern Africa (%)
Place of birth for the foreign-born population - South Africa (%)
Place of birth for the foreign-born population - Other Southern Africa (%)
Place of birth for the foreign-born population - Cabo Verde (%)
Place of birth for the foreign-born population - Ghana (%)
Place of birth for the foreign-born population - Liberia (%)
Place of birth for the foreign-born population - Nigeria (%)
Place of birth for the foreign-born population - Senegal (%)
Place of birth for the foreign-born population - Sierra Leone (%)
Place of birth for the foreign-born population - Other Western Africa (%)
Place of birth for the foreign-born population - Australia (%)
Place of birth for the foreign-born population - New Zealand (%)
Place of birth for the foreign-born population - Fiji (%)
Place of birth for the foreign-born population - Micronesia (%)
Place of birth for the foreign-born population - Bahamas (%)
Place of birth for the foreign-born population - Barbados (%)
Place of birth for the foreign-born population - Cuba (%)
Place of birth for the foreign-born population - Dominica (%)
Place of birth for the foreign-born population - Dominican Republic (%)
Place of birth for the foreign-born population - Grenada (%)
Place of birth for the foreign-born population - Haiti (%)
Place of birth for the foreign-born population - Jamaica (%)
Place of birth for the foreign-born population - St. Vincent and the Grenadines (%)
Place of birth for the foreign-born population - Trinidad and Tobago (%)
Place of birth for the foreign-born population - West Indies (%)
Place of birth for the foreign-born population - Other Caribbean (%)
Place of birth for the foreign-born population - Belize (%)
Place of birth for the foreign-born population - Costa Rica (%)
Place of birth for the foreign-born population - El Salvador (%)
Place of birth for the foreign-born population - Guatemala (%)
Place of birth for the foreign-born population - Honduras (%)
Place of birth for the foreign-born population - Mexico (%)
Place of birth for the foreign-born population - Nicaragua (%)
Place of birth for the foreign-born population - Panama (%)
Place of birth for the foreign-born population - Other Central America (%)
Place of birth for the foreign-born population - Argentina (%)
Place of birth for the foreign-born population - Bolivia (%)
Place of birth for the foreign-born population - Brazil (%)
Place of birth for the foreign-born population - Chile (%)
Place of birth for the foreign-born population - Colombia (%)
Place of birth for the foreign-born population - Ecuador (%)
Place of birth for the foreign-born population - Guyana (%)
Place of birth for the foreign-born population - Peru (%)
Place of birth for the foreign-born population - Uruguay (%)
Place of birth for the foreign-born population - Venezuela (%)
Place of birth for the foreign-born population - Other South America (%)
Place of birth for the foreign-born population - Canada (%)
Place of birth for the foreign-born population - Other Northern America (%)
Place of birth for the foreign-born population - Other (%)
Latest news about races in Gilroy, CA collected exclusively by city-data.com from local newspapers, TV, and radio stations
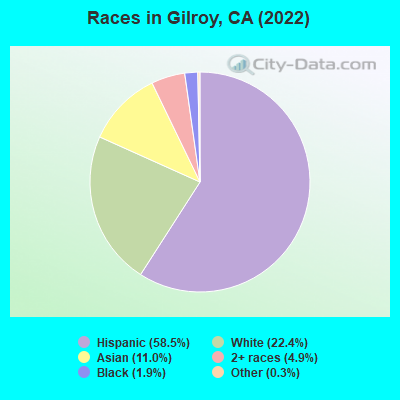
According to 2022 data, the most numerous races in Gilroy, CA are Hispanic (33,576 residents), White alone (14,523 residents), and Asian alone (5,582 residents). 54.4% of Gilroy residents speak English at home. 25.0% of Gilroy, CA residents are foreign-born (16.9% born in Latin America, 6.1% born in Asia), which is 3.9% less than the foreign-born rate of 26.0% across the entire state of California.
Race distribution in Gilroy
2000 2022
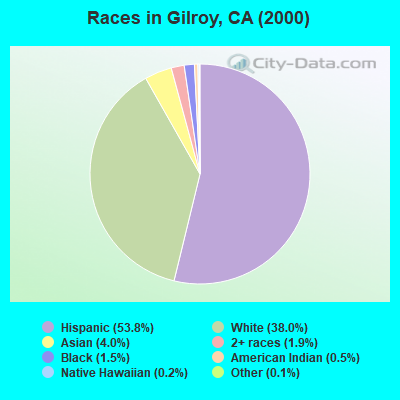
15,816,790 46.7% White alone 10,966,556 32.4% Hispanic 3,648,860 10.8% Asian alone 2,181,926 6.4% Black alone 903,115 2.7% Two or more races 178,984 0.5% American Indian alone 103,736 0.3% Native Hawaiian and Other 71,681 0.2% Other race alone
15,732,184 40.3% Hispanic 13,160,426 33.7% White alone 5,957,867 15.3% Asian alone 2,025,218 5.2% Black alone 1,663,222 4.3% Two or more races 251,618 0.6% Other race alone 135,777 0.3% Native Hawaiian and Other 103,030 0.3% American Indian alone
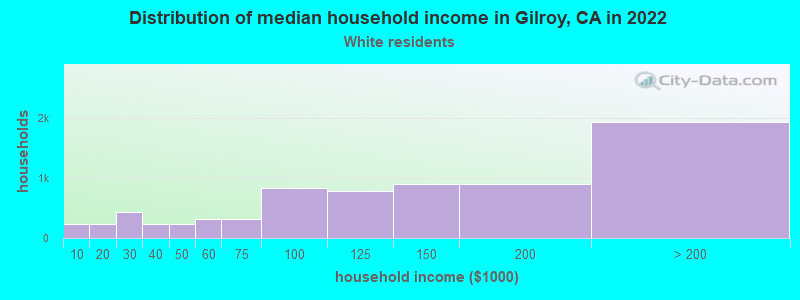
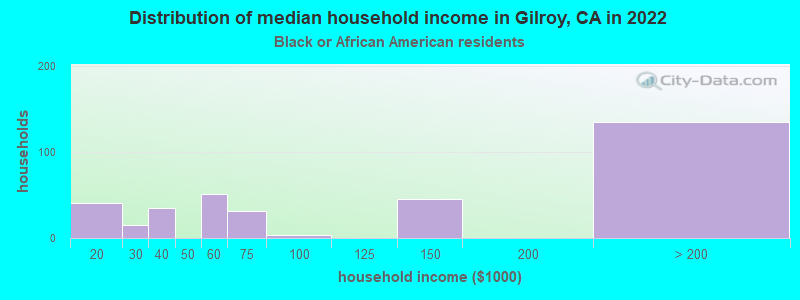
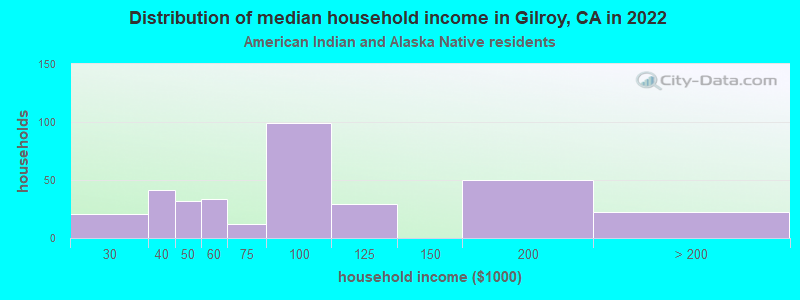
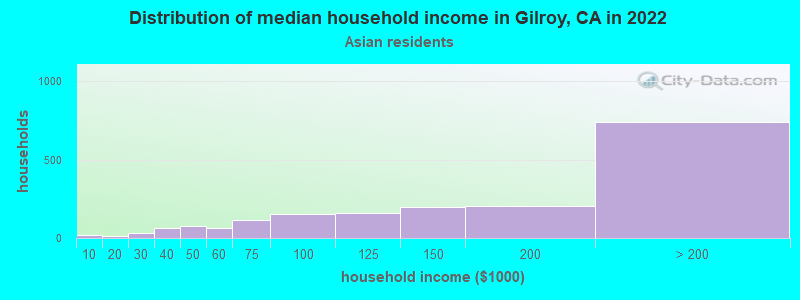
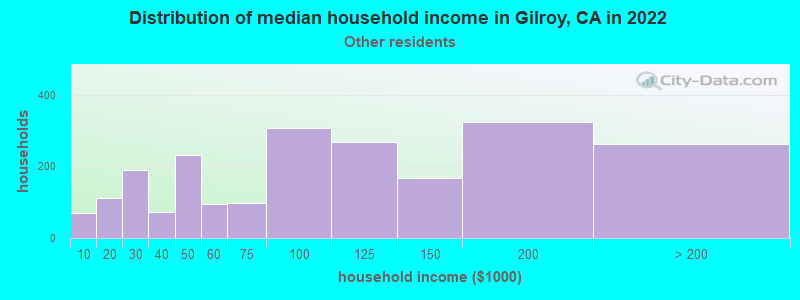
Income and house value in Gilroy Median household income in 2022 $157,697 White non-Hispanic householders$143,683 Black householders$92,522 American Indian and Alaska Native householders$172,647 Asian householders$197,915 Native Hawaiian and other Pacific Islander householders$120,613 Some other race householdersover $200,000 Two or more races householders$102,579 Hispanic or Latino race householdersMedian 2022 house value over $1,000,000 White Non-Hispanic householdersover $1,000,000 Black or African American householdersover $1,000,000 American Indian or Alaska Native householders over $1,000,000 Asian householdersover $1,000,000 Some other race householdersover $1,000,000 Two or more races householdersover $1,000,000 Hispanic or Latino householders
Median age by race in Gilroy
36.2 Median age for White residents35.1 37.5 31.1 Median age for Black or African American residents29.9 32.4 40.5 Median age for American Indian / Alaska Native residents30.7 41.5 41.4 Median age for Asian residents42.4 40.9 37.9 Median age for Native Hawaiian / Pacific Islander residents33.0 Median age for Other race residents34.6 32.4 29.9 Median age for Two or more races residents27.8 36.7 47.5 Median age for White alone residents44.6 49.5 29.9 Median age for Hispanic or Latino residents27.9 31.2
Owner/renter occupied households by race in Gilroy
House owners and renters - White residents 6,190 58.7% Owner occupied4,360 41.3% Renter occupiedHouse owners and renters - Black or African American residents 157 51.8% Owner occupied146 48.2% Renter occupiedHouse owners and renters - American Indian / Alaska Native residents 51 32.5% Owner occupied105 67.5% Renter occupiedHouse owners and renters - Asian residents 1,526 83.4% Owner occupied304 16.6% Renter occupiedHouse owners and renters - Other race residents 531 47.9% Owner occupied578 52.1% Renter occupiedHouse owners and renters - Two or more races residents 1,951 73.8% Owner occupied692 26.2% Renter occupiedHouse owners and renters - White alone residents 4,224 75.1% Owner occupied1,398 24.9% Renter occupiedHouse owners and renters - Hispanic or Latino residents 3,439 43.2% Owner occupied4,526 56.8% Renter occupied
Language usage in Gilroy
English speakers - Total 54.4% of residents of Gilroy speak English at home.
36.8% of residents speak Spanish at home 11,351 57.8% Speak English very well8,286 42.2% Speak English less than very well8.5% of residents speak other language at home 2,811 61.8% Speak English very well1,734 38.2% Speak English less than very well
English speakers - Born in the United States 84.0% of residents of Gilroy speak English at home.
13.4% of residents speak Spanish at home 584 78.5% Speak English very well160 21.5% Speak English less than very well2.4% of residents speak other language at home 131 100.0% Speak English very well
English speakers - Native, born elsewhere 62.4% of residents of Gilroy speak English at home.
35.8% of residents speak Spanish at home 166 60.1% Speak English very well110 39.9% Speak English less than very well2.7% of residents speak other language at home 20 95.2% Speak English very well1 4.8% Speak English less than very well
English speakers - Foreign-born 10.6% of residents of Gilroy speak English at home.
62.6% of residents speak Spanish at home 2,076 23.8% Speak English very well6,635 76.2% Speak English less than very well25.5% of residents speak other language at home 1,940 54.7% Speak English very well1,608 45.3% Speak English less than very well
White (Caucasian) - Speak only English Native:
72.8% (18,659)Foreign-born:
10.5% (718)
White (Caucasian) - Speak another language Native:
25.6% (6,573)Foreign-born:
88.9% (6,074)
Black or African American - Speak only English Native:
93.6% (705)Foreign-born:
27.4% (19)
Black or African American - Speak another language Native:
6.0% (45)Foreign-born:
72.4% (50)
American Indian / Alaska Native - Speak only English Native:
45.8% (131)Foreign-born:
57.6% (47)
American Indian / Alaska Native - Speak another language Native:
69.6% (200)Foreign-born:
46.7% (38)
Asian - Speak only English Native:
75.4% (1,664)Foreign-born:
10.5% (342)
Asian - Speak another language Native:
26.5% (585)Foreign-born:
89.4% (2,912)
Other race - Speak only English Native:
49.5% (1,632)Foreign-born:
14.7% (152)
Other race - Speak another language Native:
53.3% (1,757)Foreign-born:
89.0% (919)
Two or more races - Speak only English Native:
68.7% (4,057)Foreign-born:
16.1% (355)
Two or more races - Speak another language Native:
23.1% (1,363)Foreign-born:
79.3% (1,751)
White alone - Speak only English Native:
94.8% (11,898)Foreign-born:
50.6% (567)
White alone - Speak another language Native:
5.2% (652)Foreign-born:
45.8% (512)
Hispanic or Latino - Speak only English Native:
52.7% (11,961)Foreign-born:
4.5% (404)
Hispanic or Latino - Speak another language Native:
47.9% (10,868)Foreign-born:
95.3% (8,597)
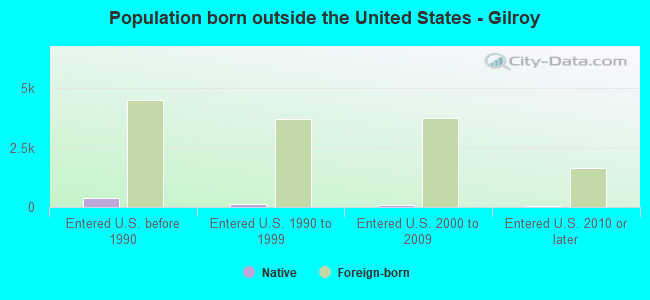
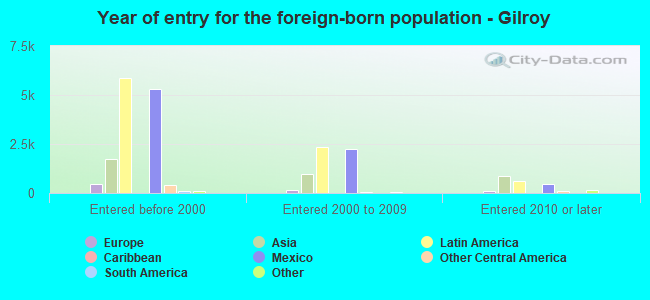
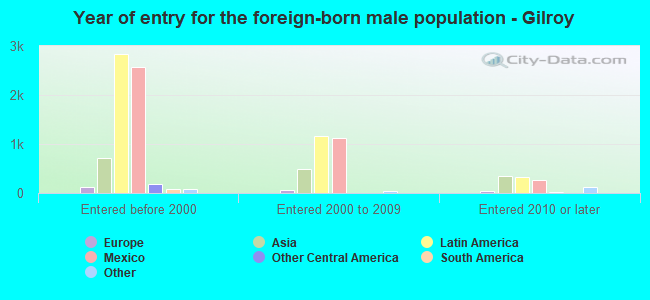
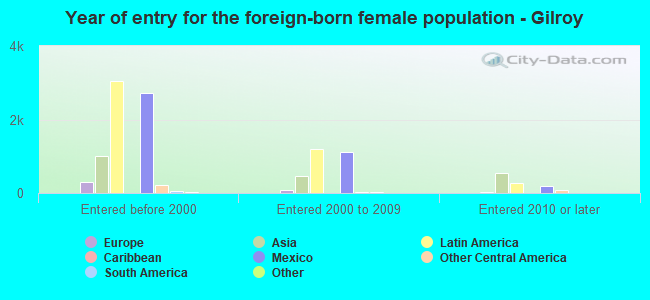
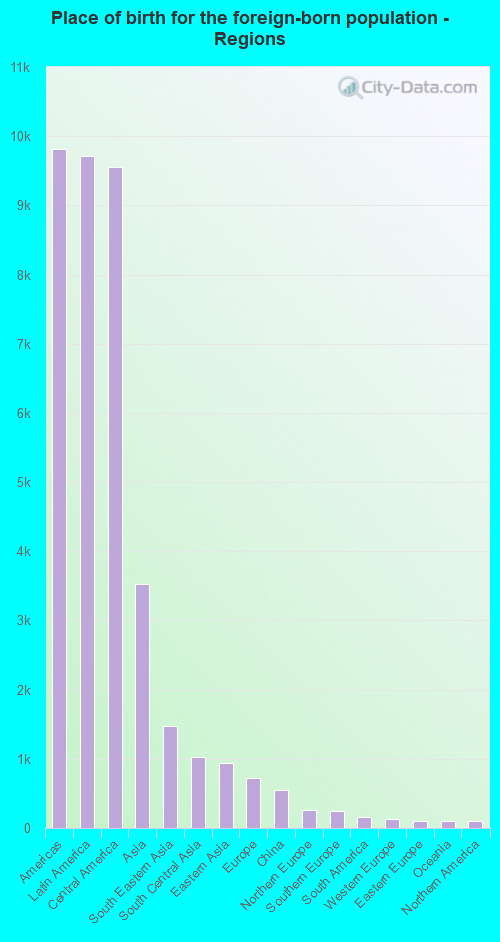
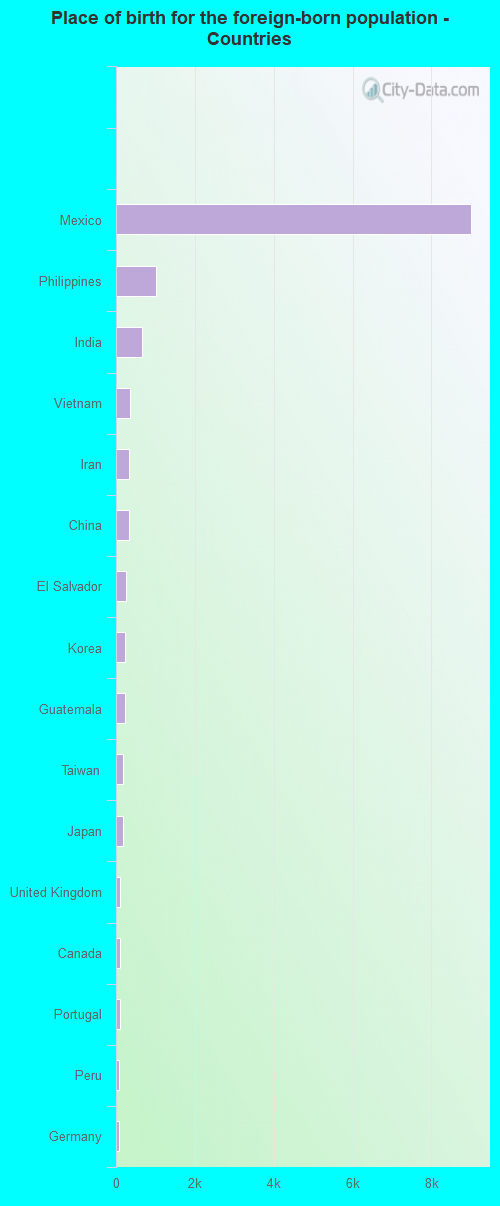
Foreign-born residents in Gilroy 14,236 residents are foreign born (16.9% Latin America , 6.1% Asia ).
This city:
25.0%California:
100.0%
Marital status for residents in Gilroy Marital status - White (Caucasian) population 15 years and over
Males 38.3% Never married51.1% Now married2.7% Separated1.1% Widowed6.8% DivorcedFemales 32.0% Never married46.1% Now married3.3% Separated5.7% Widowed12.9% DivorcedWomen who gave birth in the past 12 months Now married:
82.3% (355)Unmarried:
17.7% (76)
Women who did not give birth in the past 12 months Now married:
42.3% (3,238)Unmarried:
57.7% (4,422)
Marital status - Black or African American population 15 years and over
Males 35.8% Never married64.2% Now married0.0% Separated0.0% Widowed0.0% DivorcedFemales 38.8% Never married39.1% Now married2.7% Separated3.8% Widowed15.7% DivorcedWomen who did not give birth in the past 12 months Now married:
28.1% (57)Unmarried:
71.9% (146)
Marital status - American Indian / Alaska Native population 15 years and over
Males 50.4% Never married45.5% Now married0.0% Separated0.0% Widowed4.1% DivorcedFemales 16.3% Never married48.9% Now married0.0% Separated0.0% Widowed34.8% DivorcedWomen who did not give birth in the past 12 months Now married:
72.2% (83)Unmarried:
27.8% (32)
Marital status - Asian population 15 years and over
Males 29.3% Never married65.3% Now married0.0% Separated2.5% Widowed2.9% DivorcedFemales 21.5% Never married62.3% Now married0.0% Separated10.2% Widowed5.9% DivorcedWomen who gave birth in the past 12 months Now married:
89.4% (104)Unmarried:
10.6% (12)
Women who did not give birth in the past 12 months Now married:
56.5% (655)Unmarried:
43.5% (505)
Marital status - Other race population 15 years and over
Males 49.1% Never married41.7% Now married0.0% Separated1.5% Widowed7.8% DivorcedFemales 45.5% Never married37.1% Now married1.6% Separated2.9% Widowed13.0% DivorcedWomen who gave birth in the past 12 months Now married:
33.1% (38)Unmarried:
66.9% (77)
Women who did not give birth in the past 12 months Now married:
34.6% (455)Unmarried:
65.4% (862)
Marital status - Two or more races population 15 years and over
Males 41.8% Never married55.9% Now married0.0% Separated0.0% Widowed2.2% DivorcedFemales 34.0% Never married35.3% Now married6.0% Separated5.9% Widowed18.6% DivorcedWomen who gave birth in the past 12 months Now married:
100.0% (102)Unmarried:
0.0% (0)
Women who did not give birth in the past 12 months Now married:
32.2% (564)Unmarried:
67.8% (1,190)
Marital status - White alone, not Hispanic / Latino population 15 years and over
Males 26.9% Never married61.0% Now married1.3% Separated1.7% Widowed9.1% DivorcedFemales 19.4% Never married53.2% Now married1.5% Separated8.6% Widowed17.4% DivorcedWomen who gave birth in the past 12 months Now married:
92.2% (208)Unmarried:
7.8% (18)
Women who did not give birth in the past 12 months Now married:
49.3% (1,276)Unmarried:
50.7% (1,315)
Marital status - Hispanic or Latino population 15 years and over
Males 47.5% Never married43.2% Now married3.0% Separated0.8% Widowed5.5% DivorcedFemales 42.0% Never married39.9% Now married4.3% Separated3.7% Widowed10.0% DivorcedWomen who gave birth in the past 12 months Now married:
64.7% (286)Unmarried:
35.3% (156)
Women who did not give birth in the past 12 months Now married:
37.8% (3,241)Unmarried:
62.2% (5,340)
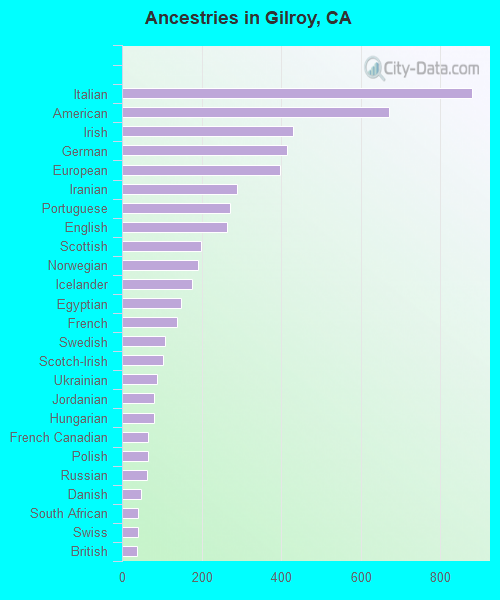
Ancestries in Gilroy
1,039 3.1% European527 1.6% American514 1.5% English508 1.5% Portuguese472 1.4% Italian464 1.4% German451 1.4% Irish258 0.8% Iranian149 0.4% Norwegian137 0.4% Scotch-Irish126 0.4% Polish104 0.3% British94 0.3% Swedish88 0.3% Greek77 0.2% Northern European62 0.2% Scottish48 0.1% French Canadian43 0.1% Dutch40 0.1% Ukrainian39 0.1% Russian27 0.08% Danish25 0.08% Belizean23 0.07% Czech22 0.07% German Russian22 0.07% Turkish18 0.05% Afghan16 0.05% Czechoslovakian16 0.05% Assyrian16 0.05% Lithuanian15 0.05% Canadian14 0.04% French13 0.04% Brazilian13 0.04% Finnish13 0.04% Swiss12 0.04% Austrian12 0.04% Israeli11 0.03% Eastern European9 0.03% Scandinavian8 0.02% Slovak8 0.02% African8 0.02% Haitian6 0.02% Belgian
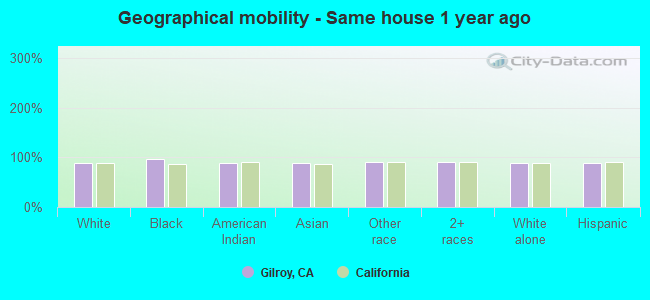
Geographical mobility in Gilroy Same house 1 year ago 30,373 88.0% White (Caucasian)812 96.1% Black or African American400 88.5% American Indian / Alaska Native4,965 87.6% Asian3,919 89.6% Other race7,232 90.7% Two or more races13,105 88.2% White alone, not Hispanic / Latino29,612 87.7% Hispanic or LatinoMoved within same county 2,899 8.4% White / Caucasian39 4.6% Black or African American50 11.2% American Indian / Alaska Native498 8.8% Asian291 6.6% Other race613 7.7% Two or more races1,095 7.4% White alone, not Hispanic / Latino2,815 8.3% Hispanic or LatinoMoved within same state 851 2.5% White / Caucasian15 1.8% Black or African American124 2.2% Asian127 2.9% Other race162 2.0% Two or more races257 1.7% White alone, not Hispanic / Latino1,025 3.0% Hispanic or LatinoMoved from different state 347 1.0% White / Caucasian102 1.8% Asian31 0.7% Other race17 0.2% Two or more races375 2.5% White alone, not Hispanic / Latino76 0.2% Hispanic or LatinoMoved from abroad 78 0.2% White24 0.4% Asian27 0.2% White alone, not Hispanic / Latino107 0.3% Hispanic or Latino
Children Nativity (place of birth) in Gilroy
Children under 6 years - Living with two parents Both parents native 1,481 100.0% NativeBoth parents foreign-born 613 98.6% Native9 1.4% Foreign-bornOne native, one foreign-born parent 718 100.0% NativeChildren under 6 years - Living with one parent Native parent 957 100.0% Native0 0.0% Foreign-bornForeign-born parent 308 98.3% Native5 1.7% Foreign-bornChildren 6 to 17 years - Living with two parents Both parents native 3,640 100.0% NativeBoth parents foreign-born 1,991 84.1% Native376 15.9% Foreign-bornOne native, one foreign-born parent 1,189 99.6% Native5 0.4% Foreign-bornChildren 6 to 17 years - Living with one parent Native parent 2,087 100.0% NativeForeign-born parent 1,357 52.7% Native1,215 47.3% Foreign-born
Grandparents responsible for own grandchildren in Gilroy
Grandparents (30 to 59 years) White / Caucasian 256 39.2% Responsible for grandchildren397 60.8% Not responsible for grandchildrenAsian 17 28.1% Responsible for grandchildren42 71.9% Not responsible for grandchildrenOther race 21 64.9% Responsible for grandchildren11 35.1% Not responsible for grandchildrenTwo or more races 17 100.0% Not responsible for grandchildrenWhite alone, not Hispanic / Latino 37 25.3% Responsible for grandchildren108 74.7% Not responsible for grandchildrenHispanic or Latino 345 46.6% Responsible for grandchildren396 53.4% Not responsible for grandchildrenGrandparents (60 years and over) White / Caucasian 87 17.5% Responsible for grandchildren413 82.5% Not responsible for grandchildrenAsian 18 7.3% Responsible for grandchildren233 92.7% Not responsible for grandchildrenOther race 5 22.2% Responsible for grandchildren18 77.8% Not responsible for grandchildrenTwo or more races 218 100.0% Responsible for grandchildrenWhite alone, not Hispanic / Latino 53 33.4% Responsible for grandchildren106 66.6% Not responsible for grandchildrenHispanic or Latino 62 12.4% Responsible for grandchildren434 87.6% Not responsible for grandchildren