Races in Glasgow, Kentucky (KY) Detailed Stats
Data:
Races - White alone (%)
Races - White alone (% change since 2000)
Races - Black alone (%)
Races - Black alone (% change since 2000)
Races - American Indian alone (%)
Races - American Indian alone (% change since 2000)
Races - Asian alone (%)
Races - Asian alone (% change since 2000)
Races - Hispanic (%)
Races - Hispanic (% change since 2000)
Races - Native Hawaiian and Other Pacific Islander alone (%)
Races - Native Hawaiian and Other Pacific Islander alone (% change since 2000)
Races - Two or more races(%)
Races - Two or more races(% change since 2000)
Races - Other race alone (%)
Races - Other race alone (% change since 2000)
Racial diversity
Place of birth - Born in state of residence (%)
Place of birth - Born in state of residence (%) - White
Place of birth - Born in state of residence (%) - Black or African American
Place of birth - Born in state of residence (%) - Asian
Place of birth - Born in state of residence (%) - Hispanic or Latino
Place of birth - Born in state of residence (%) - American Indian and Alaska Native
Place of birth - Born in state of residence (%) - Multirace
Place of birth - Born in state of residence (%) - Other Race
Place of birth - Born in other state (%)
Place of birth - Born in other state (%) - White
Place of birth - Born in other state (%) - Black or African American
Place of birth - Born in other state (%) - Asian
Place of birth - Born in other state (%) - Hispanic or Latino
Place of birth - Born in other state (%) - American Indian and Alaska Native
Place of birth - Born in other state (%) - Multirace
Place of birth - Born in other state (%) - Other Race
Place of birth - Native, outside of US (%)
Place of birth - Native, outside of US (%) - White
Place of birth - Native, outside of US (%) - Black or African American
Place of birth - Native, outside of US (%) - Asian
Place of birth - Native, outside of US (%) - Hispanic or Latino
Place of birth - Native, outside of US (%) - American Indian and Alaska Native
Place of birth - Native, outside of US (%) - Multirace
Place of birth - Native, outside of US (%) - Other Race
Place of birth - Foreign born (%)
Place of birth - Foreign born (%) - White
Place of birth - Foreign born (%) - Black or African American
Place of birth - Foreign born (%) - Asian
Place of birth - Foreign born (%) - Hispanic or Latino
Place of birth - Foreign born (%) - American Indian and Alaska Native
Place of birth - Foreign born (%) - Multirace
Place of birth - Foreign born (%) - Other Race
Residents speaking English at home (%)
Residents speaking English at home - Born in the United States (%)
Residents speaking English at home - Native, born elsewhere (%)
Residents speaking English at home - Foreign born (%)
Residents speaking Spanish at home (%)
Residents speaking Spanish at home - Born in the United States (%)
Residents speaking Spanish at home - Native, born elsewhere (%)
Residents speaking Spanish at home - Foreign born (%)
Residents speaking other language at home (%)
Residents speaking other language at home - Born in the United States (%)
Residents speaking other language at home - Native, born elsewhere (%)
Residents speaking other language at home - Foreign born (%)
Marital status - Never married (%)
Marital status - Now married (%)
Marital status - Separated (%)
Marital status - Widowed (%)
Marital status - Divorced (%)
Ancestries Reported - Arab (%)
Ancestries Reported - Czech (%)
Ancestries Reported - Danish (%)
Ancestries Reported - Dutch (%)
Ancestries Reported - English (%)
Ancestries Reported - French (%)
Ancestries Reported - French Canadian (%)
Ancestries Reported - German (%)
Ancestries Reported - Greek (%)
Ancestries Reported - Hungarian (%)
Ancestries Reported - Irish (%)
Ancestries Reported - Italian (%)
Ancestries Reported - Lithuanian (%)
Ancestries Reported - Norwegian (%)
Ancestries Reported - Polish (%)
Ancestries Reported - Portuguese (%)
Ancestries Reported - Russian (%)
Ancestries Reported - Scotch-Irish (%)
Ancestries Reported - Scottish (%)
Ancestries Reported - Slovak (%)
Ancestries Reported - Subsaharan African (%)
Ancestries Reported - Swedish (%)
Ancestries Reported - Swiss (%)
Ancestries Reported - Ukrainian (%)
Ancestries Reported - United States (%)
Ancestries Reported - Welsh (%)
Ancestries Reported - West Indian (%)
Ancestries Reported - Other (%)
Geographical mobility - Same house 1 year ago (%)
Geographical mobility - Same house 1 year ago (%) - White
Geographical mobility - Same house 1 year ago (%) - Black or African American
Geographical mobility - Same house 1 year ago (%) - Asian
Geographical mobility - Same house 1 year ago (%) - Hispanic or Latino
Geographical mobility - Same house 1 year ago (%) - American Indian and Alaska Native
Geographical mobility - Same house 1 year ago (%) - Multirace
Geographical mobility - Same house 1 year ago (%) - Other Race
Geographical mobility - Moved within same county (%)
Geographical mobility - Moved within same county (%) - White
Geographical mobility - Moved within same county (%) - Black or African American
Geographical mobility - Moved within same county (%) - Asian
Geographical mobility - Moved within same county (%) - Hispanic or Latino
Geographical mobility - Moved within same county (%) - American Indian and Alaska Native
Geographical mobility - Moved within same county (%) - Multirace
Geographical mobility - Moved within same county (%) - Other Race
Geographical mobility - Moved from different county within same state (%)
Geographical mobility - Moved from different county within same state (%) - White
Geographical mobility - Moved from different county within same state (%) - Black or African American
Geographical mobility - Moved from different county within same state (%) - Asian
Geographical mobility - Moved from different county within same state (%) - Hispanic or Latino
Geographical mobility - Moved from different county within same state (%) - American Indian and Alaska Native
Geographical mobility - Moved from different county within same state (%) - Multirace
Geographical mobility - Moved from different county within same state (%) - Other Race
Geographical mobility - Moved from different state (%)
Geographical mobility - Moved from different state (%) - White
Geographical mobility - Moved from different state (%) - Black or African American
Geographical mobility - Moved from different state (%) - Asian
Geographical mobility - Moved from different state (%) - Hispanic or Latino
Geographical mobility - Moved from different state (%) - American Indian and Alaska Native
Geographical mobility - Moved from different state (%) - Multirace
Geographical mobility - Moved from different state (%) - Other Race
Geographical mobility - Moved from abroad (%)
Geographical mobility - Moved from abroad (%) - White
Geographical mobility - Moved from abroad (%) - Black or African American
Geographical mobility - Moved from abroad (%) - Asian
Geographical mobility - Moved from abroad (%) - Hispanic or Latino
Geographical mobility - Moved from abroad (%) - American Indian and Alaska Native
Geographical mobility - Moved from abroad (%) - Multirace
Geographical mobility - Moved from abroad (%) - Other Race
Place of birth for the foreign-born population - Ireland (%)
Place of birth for the foreign-born population - Denmark (%)
Place of birth for the foreign-born population - Norway (%)
Place of birth for the foreign-born population - Sweden (%)
Place of birth for the foreign-born population - United Kingdom (%)
Place of birth for the foreign-born population - England (%)
Place of birth for the foreign-born population - Scotland (%)
Place of birth for the foreign-born population - Other Northern Europe (%)
Place of birth for the foreign-born population - Austria (%)
Place of birth for the foreign-born population - Belgium (%)
Place of birth for the foreign-born population - France (%)
Place of birth for the foreign-born population - Germany (%)
Place of birth for the foreign-born population - Netherlands (%)
Place of birth for the foreign-born population - Switzerland (%)
Place of birth for the foreign-born population - Other Western Europe (%)
Place of birth for the foreign-born population - Greece (%)
Place of birth for the foreign-born population - Italy (%)
Place of birth for the foreign-born population - Portugal (%)
Place of birth for the foreign-born population - Spain (%)
Place of birth for the foreign-born population - Other Southern Europe (%)
Place of birth for the foreign-born population - Albania (%)
Place of birth for the foreign-born population - Belarus (%)
Place of birth for the foreign-born population - Bosnia and Herzegovina (%)
Place of birth for the foreign-born population - Bulgaria (%)
Place of birth for the foreign-born population - Croatia (%)
Place of birth for the foreign-born population - Czechoslovakia (%)
Place of birth for the foreign-born population - Hungary (%)
Place of birth for the foreign-born population - Latvia (%)
Place of birth for the foreign-born population - Lithuania (%)
Place of birth for the foreign-born population - North Macedonia (Macedonia) (%)
Place of birth for the foreign-born population - Moldova (%)
Place of birth for the foreign-born population - Poland (%)
Place of birth for the foreign-born population - Romania (%)
Place of birth for the foreign-born population - Russia (%)
Place of birth for the foreign-born population - Serbia (%)
Place of birth for the foreign-born population - Ukraine (%)
Place of birth for the foreign-born population - Other Eastern Europe (%)
Place of birth for the foreign-born population - China (%)
Place of birth for the foreign-born population - Hong Kong (%)
Place of birth for the foreign-born population - Taiwan (%)
Place of birth for the foreign-born population - Japan (%)
Place of birth for the foreign-born population - Korea (%)
Place of birth for the foreign-born population - Other Eastern Asia (%)
Place of birth for the foreign-born population - Afghanistan (%)
Place of birth for the foreign-born population - Bangladesh (%)
Place of birth for the foreign-born population - India (%)
Place of birth for the foreign-born population - Iran (%)
Place of birth for the foreign-born population - Kazakhstan (%)
Place of birth for the foreign-born population - Nepal (%)
Place of birth for the foreign-born population - Pakistan (%)
Place of birth for the foreign-born population - Sri Lanka (%)
Place of birth for the foreign-born population - Uzbekistan (%)
Place of birth for the foreign-born population - Other South Central Asia (%)
Place of birth for the foreign-born population - Burma (%)
Place of birth for the foreign-born population - Cambodia (%)
Place of birth for the foreign-born population - Indonesia (%)
Place of birth for the foreign-born population - Laos (%)
Place of birth for the foreign-born population - Malaysia (%)
Place of birth for the foreign-born population - Philippines (%)
Place of birth for the foreign-born population - Singapore (%)
Place of birth for the foreign-born population - Thailand (%)
Place of birth for the foreign-born population - Vietnam (%)
Place of birth for the foreign-born population - Other South Eastern Asia (%)
Place of birth for the foreign-born population - Armenia (%)
Place of birth for the foreign-born population - Iraq (%)
Place of birth for the foreign-born population - Israel (%)
Place of birth for the foreign-born population - Jordan (%)
Place of birth for the foreign-born population - Kuwait (%)
Place of birth for the foreign-born population - Lebanon (%)
Place of birth for the foreign-born population - Saudi Arabia (%)
Place of birth for the foreign-born population - Syria (%)
Place of birth for the foreign-born population - Turkey (%)
Place of birth for the foreign-born population - Yemen (%)
Place of birth for the foreign-born population - Other Western Asia (%)
Place of birth for the foreign-born population - Eritrea (%)
Place of birth for the foreign-born population - Ethiopia (%)
Place of birth for the foreign-born population - Kenya (%)
Place of birth for the foreign-born population - Somalia (%)
Place of birth for the foreign-born population - Uganda (%)
Place of birth for the foreign-born population - Zimbabwe (%)
Place of birth for the foreign-born population - Other Eastern Africa (%)
Place of birth for the foreign-born population - Cameroon (%)
Place of birth for the foreign-born population - Congo (%)
Place of birth for the foreign-born population - Democratic Republic of Congo (Zaire) (%)
Place of birth for the foreign-born population - Other Middle Africa (%)
Place of birth for the foreign-born population - Egypt (%)
Place of birth for the foreign-born population - Morocco (%)
Place of birth for the foreign-born population - Sudan (%)
Place of birth for the foreign-born population - Other Northern Africa (%)
Place of birth for the foreign-born population - South Africa (%)
Place of birth for the foreign-born population - Other Southern Africa (%)
Place of birth for the foreign-born population - Cabo Verde (%)
Place of birth for the foreign-born population - Ghana (%)
Place of birth for the foreign-born population - Liberia (%)
Place of birth for the foreign-born population - Nigeria (%)
Place of birth for the foreign-born population - Senegal (%)
Place of birth for the foreign-born population - Sierra Leone (%)
Place of birth for the foreign-born population - Other Western Africa (%)
Place of birth for the foreign-born population - Australia (%)
Place of birth for the foreign-born population - New Zealand (%)
Place of birth for the foreign-born population - Fiji (%)
Place of birth for the foreign-born population - Micronesia (%)
Place of birth for the foreign-born population - Bahamas (%)
Place of birth for the foreign-born population - Barbados (%)
Place of birth for the foreign-born population - Cuba (%)
Place of birth for the foreign-born population - Dominica (%)
Place of birth for the foreign-born population - Dominican Republic (%)
Place of birth for the foreign-born population - Grenada (%)
Place of birth for the foreign-born population - Haiti (%)
Place of birth for the foreign-born population - Jamaica (%)
Place of birth for the foreign-born population - St. Vincent and the Grenadines (%)
Place of birth for the foreign-born population - Trinidad and Tobago (%)
Place of birth for the foreign-born population - West Indies (%)
Place of birth for the foreign-born population - Other Caribbean (%)
Place of birth for the foreign-born population - Belize (%)
Place of birth for the foreign-born population - Costa Rica (%)
Place of birth for the foreign-born population - El Salvador (%)
Place of birth for the foreign-born population - Guatemala (%)
Place of birth for the foreign-born population - Honduras (%)
Place of birth for the foreign-born population - Mexico (%)
Place of birth for the foreign-born population - Nicaragua (%)
Place of birth for the foreign-born population - Panama (%)
Place of birth for the foreign-born population - Other Central America (%)
Place of birth for the foreign-born population - Argentina (%)
Place of birth for the foreign-born population - Bolivia (%)
Place of birth for the foreign-born population - Brazil (%)
Place of birth for the foreign-born population - Chile (%)
Place of birth for the foreign-born population - Colombia (%)
Place of birth for the foreign-born population - Ecuador (%)
Place of birth for the foreign-born population - Guyana (%)
Place of birth for the foreign-born population - Peru (%)
Place of birth for the foreign-born population - Uruguay (%)
Place of birth for the foreign-born population - Venezuela (%)
Place of birth for the foreign-born population - Other South America (%)
Place of birth for the foreign-born population - Canada (%)
Place of birth for the foreign-born population - Other Northern America (%)
Place of birth for the foreign-born population - Other (%)
Latest news about races in Glasgow, KY collected exclusively by city-data.com from local newspapers, TV, and radio stations
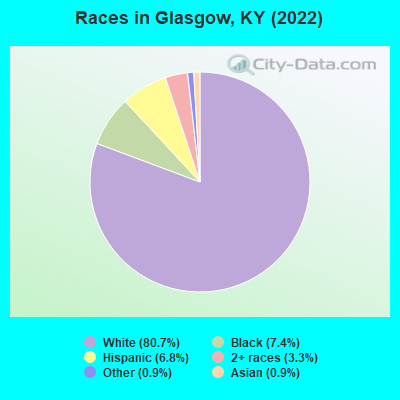
According to 2022 data, the most numerous races in Glasgow, KY are White alone (12,169 residents), Black alone (1,109 residents), and Hispanic (1,026 residents). 92.4% of Glasgow residents speak English at home. 5.0% of Glasgow, KY residents are foreign-born (2.8% born in Latin America, 1.0% born in Europe, 0.9% born in Asia), which is 20.6% greater than the foreign-born rate of 4.0% across the entire state of Kentucky.
Race distribution in Glasgow
2000 2022
3,608,013 89.3% White alone 293,639 7.3% Black alone 59,939 1.5% Hispanic 37,750 0.9% Two or more races 29,368 0.7% Asian alone 7,939 0.2% American Indian alone 3,846 0.10% Other race alone 1,275 0.03% Native Hawaiian and Other
3,710,998 82.2% White alone 343,194 7.6% Black alone 187,483 4.2% Hispanic 187,394 4.2% Two or more races 62,240 1.4% Asian alone 13,529 0.3% Other race alone 4,302 0.10% American Indian alone 3,170 0.07% Native Hawaiian and Other
Income and house value in Glasgow Median household income in 2022 $45,277 White non-Hispanic householders$39,482 Black householders$39,144 American Indian and Alaska Native householders$34,160 Some other race householders$35,104 Hispanic or Latino race householdersMedian 2022 house value $160,614 White Non-Hispanic householders$133,845 Black or African American householders $189,780 Asian householders$224,740 Hispanic or Latino householders
Median age by race in Glasgow
46.7 Median age for White residents43.0 50.6 38.7 Median age for Black or African American residents33.4 50.4 24.5 Median age for American Indian / Alaska Native residents28.5 -630,065,358.8 46.8 Median age for Asian residents65.9 47.6 -755,186,721.2 Median age for Native Hawaiian / Pacific Islander residents-724,043,715.1 -853,801,168.7 19.6 Median age for Other race residents19.8 20.2 30.9 Median age for Two or more races residents15.2 31.7 46.6 Median age for White alone residents43.1 50.6 26.8 Median age for Hispanic or Latino residents27.1 26.3
Owner/renter occupied households by race in Glasgow
House owners and renters - White residents 3,011 57.3% Owner occupied2,246 42.7% Renter occupiedHouse owners and renters - Black or African American residents 151 28.7% Owner occupied374 71.3% Renter occupiedHouse owners and renters - American Indian / Alaska Native residents 197 100.0% Renter occupiedHouse owners and renters - Asian residents 35 100.0% Owner occupiedHouse owners and renters - Other race residents 31 40.4% Owner occupied46 59.6% Renter occupiedHouse owners and renters - Two or more races residents 118 30.1% Owner occupied275 69.9% Renter occupiedHouse owners and renters - White alone residents 2,999 56.9% Owner occupied2,275 43.1% Renter occupiedHouse owners and renters - Hispanic or Latino residents 56 16.6% Owner occupied284 83.4% Renter occupied
Language usage in Glasgow
English speakers - Total 92.4% of residents of Glasgow speak English at home.
4.5% of residents speak Spanish at home 168 26.2% Speak English very well472 73.8% Speak English less than very well3.1% of residents speak other language at home 354 79.4% Speak English very well92 20.6% Speak English less than very well
English speakers - Born in the United States 96.4% of residents of Glasgow speak English at home.
2.7% of residents speak Spanish at home 12 12.1% Speak English very well87 87.9% Speak English less than very well0.8% of residents speak other language at home 28 100.0% Speak English less than very well
English speakers - Native, born elsewhere 96.0% of residents of Glasgow speak English at home.
English speakers - Foreign-born 17.5% of residents of Glasgow speak English at home.
54.6% of residents speak Spanish at home 65 16.3% Speak English very well334 83.7% Speak English less than very well28.9% of residents speak other language at home 145 68.7% Speak English very well66 31.3% Speak English less than very well
White (Caucasian) - Speak only English Native:
99.7% (11,337)Foreign-born:
58.8% (78)
White (Caucasian) - Speak another language Native:
0.4% (45)Foreign-born:
48.3% (64)
American Indian / Alaska Native - Speak another language Native:
100.0% (11)Foreign-born:
77.9% (96)
Asian - Speak another language Native:
100.0% (13)Foreign-born:
93.1% (110)
Other race - Speak another language Native:
88.5% (166)Foreign-born:
98.6% (150)
Two or more races - Speak another language Native:
28.4% (265)Foreign-born:
98.8% (241)
White alone - Speak only English Native:
99.5% (11,294)Foreign-born:
50.1% (83)
White alone - Speak another language Native:
0.4% (50)Foreign-born:
50.9% (84)
Hispanic or Latino - Speak only English Native:
53.3% (259)Foreign-born:
6.6% (28)
Hispanic or Latino - Speak another language Native:
46.4% (225)Foreign-born:
93.5% (393)
Foreign-born residents in Glasgow 759 residents are foreign born (2.8% Latin America , 1.0% Europe , 0.9% Asia ).
This city:
5.0%Kentucky:
4.1%
Marital status for residents in Glasgow Marital status - White (Caucasian) population 15 years and over
Males 29.4% Never married48.8% Now married1.6% Separated3.5% Widowed16.8% DivorcedFemales 19.1% Never married42.4% Now married1.7% Separated17.2% Widowed19.6% DivorcedWomen who gave birth in the past 12 months Now married:
25.6% (56)Unmarried:
74.4% (162)
Women who did not give birth in the past 12 months Now married:
54.2% (1,084)Unmarried:
45.8% (914)
Marital status - Black or African American population 15 years and over
Males 58.6% Never married35.0% Now married6.4% Separated0.0% Widowed0.0% DivorcedFemales 34.1% Never married28.1% Now married3.0% Separated5.3% Widowed29.4% DivorcedWomen who did not give birth in the past 12 months Now married:
22.8% (54)Unmarried:
77.2% (181)
Marital status - Asian population 15 years and over
Males 30.4% Never married43.5% Now married0.0% Separated26.1% Widowed0.0% DivorcedFemales 0.0% Never married100.0% Now married0.0% Separated0.0% Widowed0.0% DivorcedWomen who did not give birth in the past 12 months Now married:
100.0% (71)Unmarried:
0.0% (0)
Marital status - Other race population 15 years and over
Males 91.4% Never married8.6% Now married0.0% Separated0.0% Widowed0.0% DivorcedFemales 90.2% Never married0.0% Now married9.1% Separated0.0% Widowed0.7% DivorcedWomen who did not give birth in the past 12 months Now married:
9.1% (17)Unmarried:
90.9% (171)
Marital status - Two or more races population 15 years and over
Males 5.9% Never married62.1% Now married0.0% Separated0.0% Widowed32.0% DivorcedFemales 22.3% Never married67.3% Now married0.0% Separated0.0% Widowed10.4% DivorcedWomen who did not give birth in the past 12 months Now married:
70.8% (276)Unmarried:
29.2% (113)
Marital status - White alone, not Hispanic / Latino population 15 years and over
Males 29.4% Never married48.8% Now married1.6% Separated3.5% Widowed16.8% DivorcedFemales 19.1% Never married42.2% Now married1.7% Separated17.3% Widowed19.7% DivorcedWomen who gave birth in the past 12 months Now married:
25.6% (56)Unmarried:
74.4% (163)
Women who did not give birth in the past 12 months Now married:
53.8% (1,075)Unmarried:
46.2% (922)
Marital status - Hispanic or Latino population 15 years and over
Males 36.9% Never married52.6% Now married0.0% Separated0.0% Widowed10.5% DivorcedFemales 31.9% Never married63.5% Now married4.6% Separated0.0% Widowed0.0% DivorcedWomen who did not give birth in the past 12 months Now married:
68.1% (208)Unmarried:
31.9% (98)
Ancestries in Glasgow
2,306 31.1% American1,557 21.0% English364 4.9% Irish344 4.6% German152 2.1% Yugoslavian100 1.4% European96 1.3% Brazilian83 1.1% Italian74 1.0% Scottish51 0.7% French36 0.5% British30 0.4% Scotch-Irish21 0.3% Russian19 0.3% African18 0.2% Welsh15 0.2% Portuguese15 0.2% Swedish12 0.2% Danish9 0.1% Dutch7 0.09% Norwegian6 0.08% Ukrainian
Geographical mobility in Glasgow Same house 1 year ago 10,074 84.0% White (Caucasian)1,017 91.8% Black or African American144 86.0% American Indian / Alaska Native130 97.9% Asian338 99.8% Other race1,145 85.8% Two or more races10,069 84.1% White alone, not Hispanic / Latino963 94.2% Hispanic or LatinoMoved within same county 1,124 9.4% White / Caucasian71 6.4% Black or African American15 9.0% American Indian / Alaska Native39 2.9% Two or more races1,115 9.3% White alone, not Hispanic / Latino26 2.5% Hispanic or LatinoMoved within same state 524 4.4% White / Caucasian37 3.4% Black or African American10 2.9% Other race119 8.9% Two or more races529 4.4% White alone, not Hispanic / Latino35 3.4% Hispanic or LatinoMoved from different state 192 1.6% White / Caucasian196 1.6% White alone, not Hispanic / Latino
Children Nativity (place of birth) in Glasgow
Children under 6 years - Living with two parents Both parents native 291 100.0% NativeBoth parents foreign-born 8 100.0% NativeOne native, one foreign-born parent 100 100.0% NativeChildren under 6 years - Living with one parent Native parent 529 100.0% NativeForeign-born parent 25 100.0% NativeChildren 6 to 17 years - Living with two parents Both parents native 1,053 100.0% NativeBoth parents foreign-born 39 100.0% NativeOne native, one foreign-born parent 130 100.0% NativeChildren 6 to 17 years - Living with one parent Native parent 1,062 100.0% NativeForeign-born parent 131 49.5% Native133 50.5% Foreign-born
Grandparents responsible for own grandchildren in Glasgow
Grandparents (30 to 59 years) White / Caucasian 80 68.1% Responsible for grandchildren37 31.9% Not responsible for grandchildrenBlack or African American 45 100.0% Not responsible for grandchildrenWhite alone, not Hispanic / Latino 80 67.8% Responsible for grandchildren38 32.2% Not responsible for grandchildrenGrandparents (60 years and over) White / Caucasian 39 32.0% Responsible for grandchildren84 68.0% Not responsible for grandchildrenBlack or African American 66 83.7% Responsible for grandchildren13 16.3% Not responsible for grandchildrenWhite alone, not Hispanic / Latino 39 31.8% Responsible for grandchildren84 68.2% Not responsible for grandchildren