Races in Glen Avon, California (CA) Detailed Stats
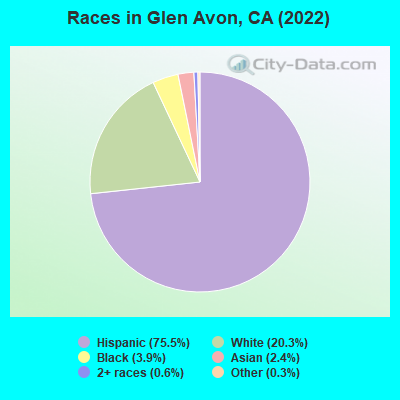
According to 2022 data, the most numerous races in Glen Avon, CA are Hispanic (17,027 residents), White alone (4,571 residents), and Asian alone (534 residents). 42.9% of Glen Avon residents speak English at home. 26.4% of Glen Avon, CA residents are foreign-born (25.2% born in Latin America), which is about the same as the foreign-born rate of 26.0% across the entire state of California.
Race distribution in Glen Avon
2000 2022
15,816,790 46.7% White alone 10,966,556 32.4% Hispanic 3,648,860 10.8% Asian alone 2,181,926 6.4% Black alone 903,115 2.7% Two or more races 178,984 0.5% American Indian alone 103,736 0.3% Native Hawaiian and Other 71,681 0.2% Other race alone
15,732,184 40.3% Hispanic 13,160,426 33.7% White alone 5,957,867 15.3% Asian alone 2,025,218 5.2% Black alone 1,663,222 4.3% Two or more races 251,618 0.6% Other race alone 135,777 0.3% Native Hawaiian and Other 103,030 0.3% American Indian alone
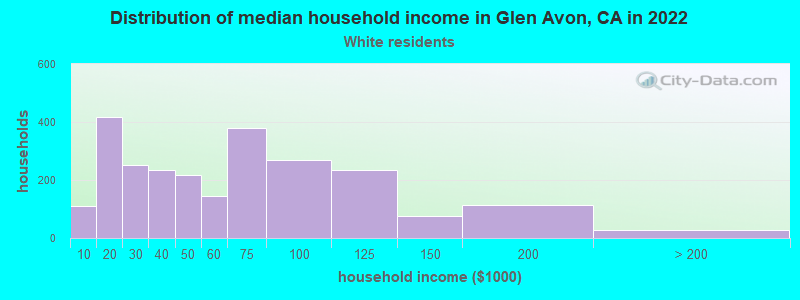
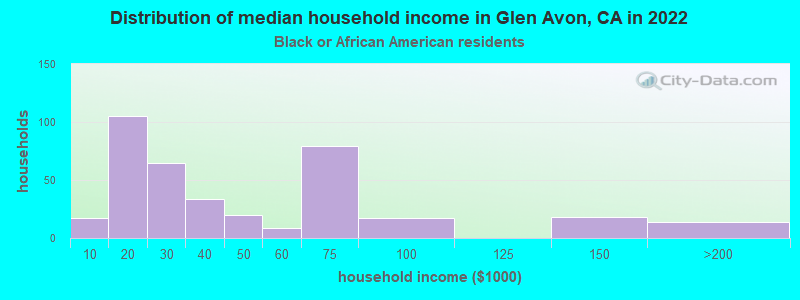
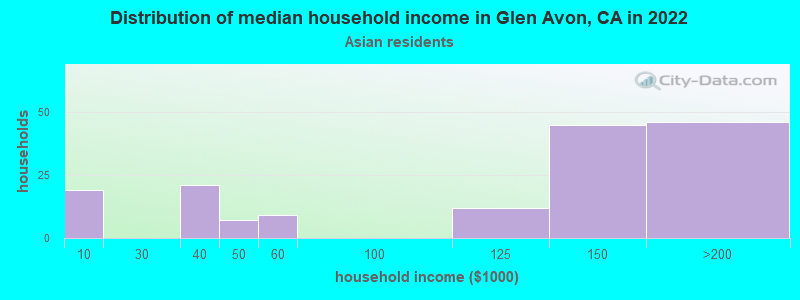
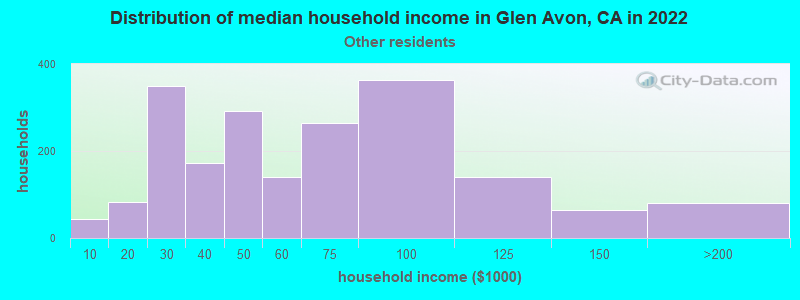
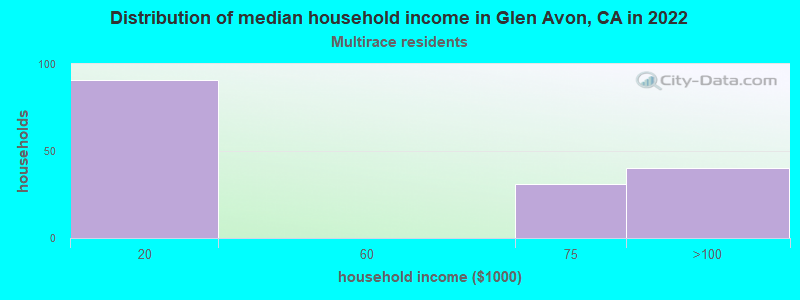
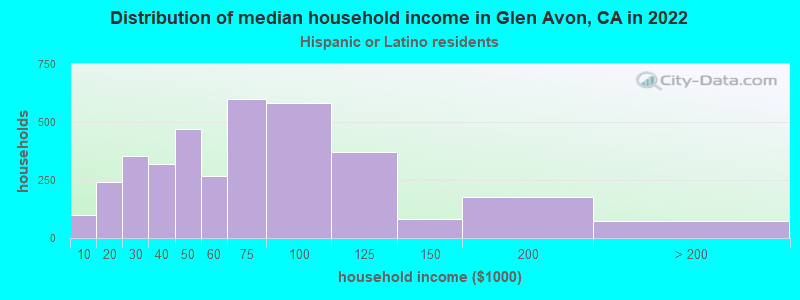
Income and house value in Glen Avon Median household income in 2022 $47,756 White non-Hispanic householders$38,803 Black householders$87,204 American Indian and Alaska Native householders$152,355 Asian householders$24,769 Native Hawaiian and other Pacific Islander householders$65,628 Some other race householders$111,015 Two or more races householders$72,075 Hispanic or Latino race householdersMedian 2022 house value $469,348 White Non-Hispanic householders$483,745 Black or African American householders$526,577 American Indian or Alaska Native householders $394,842 Asian householders$459,270 Some other race householders$534,855 Two or more races householders$459,630 Hispanic or Latino householders
Median age by race in Glen Avon
34.5 Median age for White residents33.0 39.0 47.0 Median age for Black or African American residents41.6 47.8 56.4 Median age for American Indian / Alaska Native residents19.3 Median age for Asian residents14.0 26.1 43.8 Median age for Native Hawaiian / Pacific Islander residents29.8 Median age for Other race residents33.5 28.4 21.9 Median age for Two or more races residents14.7 29.5 55.8 Median age for White alone residents54.0 56.7 28.3 Median age for Hispanic or Latino residents26.0 29.2
Owner/renter occupied households by race in Glen Avon
House owners and renters - White residents 1,879 58.1% Owner occupied1,355 41.9% Renter occupiedHouse owners and renters - Black or African American residents 49 9.5% Owner occupied467 90.5% Renter occupiedHouse owners and renters - American Indian / Alaska Native residents 61 100.0% Renter occupiedHouse owners and renters - Asian residents 143 85.2% Owner occupied25 14.8% Renter occupiedHouse owners and renters - Native Hawaiian / Pacific Islander residents 22 100.0% Renter occupiedHouse owners and renters - Other race residents 1,313 55.9% Owner occupied1,035 44.1% Renter occupiedHouse owners and renters - Two or more races residents 152 61.0% Owner occupied97 39.0% Renter occupiedHouse owners and renters - White alone residents 842 42.6% Owner occupied1,132 57.4% Renter occupiedHouse owners and renters - Hispanic or Latino residents 2,712 66.0% Owner occupied1,399 34.0% Renter occupied
Language usage in Glen Avon
English speakers - Total 42.9% of residents of Glen Avon speak English at home.
53.3% of residents speak Spanish at home 7,116 63.1% Speak English very well4,159 36.9% Speak English less than very well2.3% of residents speak other language at home 252 52.6% Speak English very well227 47.4% Speak English less than very well
English speakers - Born in the United States 88.6% of residents of Glen Avon speak English at home.
9.7% of residents speak Spanish at home 181 79.4% Speak English very well47 20.6% Speak English less than very well0.9% of residents speak other language at home 20 100.0% Speak English very well
English speakers - Native, born elsewhere 18.6% of residents of Glen Avon speak English at home.
75.9% of residents speak Spanish at home 98 58.7% Speak English very well69 41.3% Speak English less than very well
English speakers - Foreign-born 2.2% of residents of Glen Avon speak English at home.
79.6% of residents speak Spanish at home 1,556 31.7% Speak English very well3,359 68.3% Speak English less than very well6.0% of residents speak other language at home 165 44.6% Speak English very well205 55.4% Speak English less than very well
White (Caucasian) - Speak only English Native:
68.8% (5,483)Foreign-born:
3.1% (62)
White (Caucasian) - Speak another language Native:
28.1% (2,235)Foreign-born:
91.4% (1,815)
American Indian / Alaska Native - Speak another language Native:
21.1% (19)Foreign-born:
98.1% (45)
Asian - Speak another language Native:
29.3% (90)Foreign-born:
99.1% (294)
Other race - Speak only English Native:
23.9% (1,190)Foreign-born:
2.4% (88)
Other race - Speak another language Native:
75.2% (3,750)Foreign-born:
96.3% (3,591)
Two or more races - Speak another language Native:
84.1% (1,162)Foreign-born:
97.9% (118)
White alone - Speak only English Native:
98.5% (4,281)Foreign-born:
50.8% (53)
White alone - Speak another language Native:
1.6% (68)Foreign-born:
46.4% (49)
Hispanic or Latino - Speak only English Native:
37.6% (4,424)Foreign-born:
1.3% (77)
Hispanic or Latino - Speak another language Native:
61.4% (7,233)Foreign-born:
96.4% (5,697)
Foreign-born residents in Glen Avon 5,949 residents are foreign born (25.2% Latin America ).
This city:
26.4%California:
100.0%
Marital status for residents in Glen Avon Marital status - White (Caucasian) population 15 years and over
Males 39.2% Never married44.2% Now married0.6% Separated3.3% Widowed12.7% DivorcedFemales 30.8% Never married42.3% Now married4.9% Separated9.2% Widowed12.7% DivorcedWomen who gave birth in the past 12 months Now married:
100.0% (118)Unmarried:
0.0% (0)
Women who did not give birth in the past 12 months Now married:
43.2% (956)Unmarried:
56.8% (1,258)
Marital status - Black or African American population 15 years and over
Males 31.5% Never married41.7% Now married0.0% Separated14.5% Widowed12.3% DivorcedFemales 53.5% Never married20.5% Now married1.3% Separated10.5% Widowed14.2% DivorcedWomen who did not give birth in the past 12 months Now married:
36.8% (112)Unmarried:
63.2% (192)
Marital status - American Indian / Alaska Native population 15 years and over
Males 10.4% Never married32.5% Now married11.7% Separated0.0% Widowed45.5% DivorcedFemales 100.0% Never married0.0% Now married0.0% Separated0.0% Widowed0.0% DivorcedWomen who did not give birth in the past 12 months Now married:
0.0% (0)Unmarried:
100.0% (16)
Marital status - Asian population 15 years and over
Males 34.0% Never married58.7% Now married7.3% Separated0.0% Widowed0.0% DivorcedFemales 26.7% Never married57.5% Now married0.0% Separated6.2% Widowed9.6% DivorcedWomen who gave birth in the past 12 months Now married:
100.0% (13)Unmarried:
0.0% (0)
Women who did not give birth in the past 12 months Now married:
48.0% (41)Unmarried:
52.0% (45)
Marital status - Native Hawaiian / Pacific Islander population 15 years and over
Males 100.0% Never married0.0% Now married0.0% Separated0.0% Widowed0.0% DivorcedFemales 100.0% Never married0.0% Now married0.0% Separated0.0% Widowed0.0% DivorcedWomen who did not give birth in the past 12 months Now married:
0.0% (0)Unmarried:
100.0% (16)
Marital status - Other race population 15 years and over
Males 37.0% Never married51.4% Now married6.5% Separated0.7% Widowed4.3% DivorcedFemales 38.3% Never married48.5% Now married5.4% Separated2.0% Widowed5.8% DivorcedWomen who gave birth in the past 12 months Now married:
80.0% (195)Unmarried:
20.0% (49)
Women who did not give birth in the past 12 months Now married:
48.6% (1,149)Unmarried:
51.4% (1,215)
Marital status - Two or more races population 15 years and over
Males 48.3% Never married31.4% Now married7.6% Separated9.3% Widowed3.4% DivorcedFemales 51.7% Never married36.4% Now married0.0% Separated0.0% Widowed11.9% DivorcedWomen who did not give birth in the past 12 months Now married:
25.3% (88)Unmarried:
74.7% (260)
Marital status - White alone, not Hispanic / Latino population 15 years and over
Males 26.0% Never married44.4% Now married0.8% Separated5.6% Widowed23.2% DivorcedFemales 19.4% Never married40.8% Now married2.3% Separated17.3% Widowed20.2% DivorcedWomen who gave birth in the past 12 months Now married:
100.0% (27)Unmarried:
0.0% (0)
Women who did not give birth in the past 12 months Now married:
37.9% (217)Unmarried:
62.1% (356)
Marital status - Hispanic or Latino population 15 years and over
Males 43.9% Never married46.7% Now married3.1% Separated1.3% Widowed5.1% DivorcedFemales 39.9% Never married44.0% Now married5.7% Separated3.1% Widowed7.4% DivorcedWomen who gave birth in the past 12 months Now married:
86.6% (286)Unmarried:
13.4% (45)
Women who did not give birth in the past 12 months Now married:
45.1% (2,184)Unmarried:
54.9% (2,660)
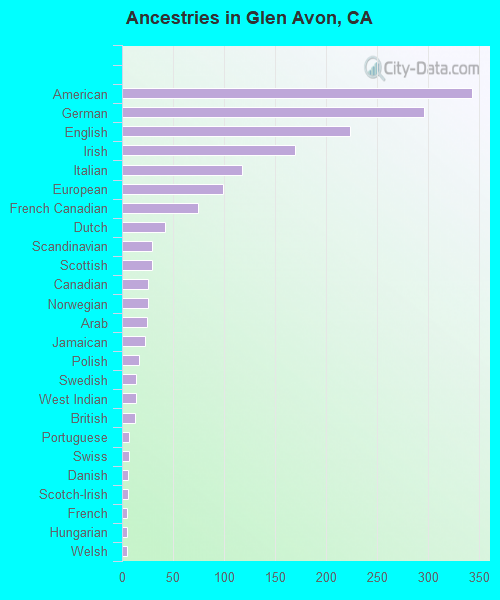
Ancestries in Glen Avon
343 2.4% American296 2.1% German224 1.6% English170 1.2% Irish118 0.8% Italian99 0.7% European75 0.5% French Canadian42 0.3% Dutch29 0.2% Scandinavian29 0.2% Scottish26 0.2% Canadian26 0.2% Norwegian25 0.2% Arab23 0.2% Jamaican17 0.1% Polish14 0.10% Swedish14 0.10% West Indian13 0.09% British7 0.05% Portuguese7 0.05% Swiss6 0.04% Danish6 0.04% Scotch-Irish5 0.04% French5 0.04% Hungarian5 0.04% Welsh4 0.03% Slovak
Geographical mobility in Glen Avon Same house 1 year ago 8,994 84.6% White (Caucasian)885 94.2% Black or African American108 77.7% American Indian / Alaska Native490 83.2% Asian56 100.0% Native Hawaiian / Pacific Islander7,282 89.2% Other race2,086 92.6% Two or more races3,470 88.8% White alone, not Hispanic / Latino16,495 86.8% Hispanic or LatinoMoved within same county 353 3.3% White / Caucasian6 0.6% Black or African American19 13.8% American Indian / Alaska Native49 8.4% Asian430 5.3% Other race160 7.1% Two or more races167 4.3% White alone, not Hispanic / Latino893 4.7% Hispanic or LatinoMoved within same state 1,238 11.6% White / Caucasian79 8.4% Black or African American33 5.6% Asian391 4.8% Other race26 1.2% Two or more races227 5.8% White alone, not Hispanic / Latino1,564 8.2% Hispanic or LatinoMoved from different state 138 1.3% White / Caucasian4 0.5% Black or African American58 1.5% White alone, not Hispanic / Latino98 0.5% Hispanic or LatinoMoved from abroad 2 0.0% Other race
Children Nativity (place of birth) in Glen Avon
Children under 6 years - Living with two parents Both parents native 730 100.0% NativeBoth parents foreign-born 473 100.0% NativeOne native, one foreign-born parent 88 100.0% NativeChildren under 6 years - Living with one parent Native parent 506 100.0% NativeForeign-born parent 131 100.0% NativeChildren 6 to 17 years - Living with two parents Both parents native 1,021 99.7% Native3 0.3% Foreign-bornBoth parents foreign-born 1,602 92.8% Native124 7.2% Foreign-bornOne native, one foreign-born parent 162 100.0% NativeChildren 6 to 17 years - Living with one parent Native parent 572 100.0% NativeForeign-born parent 649 50.9% Native625 49.1% Foreign-born
Grandparents responsible for own grandchildren in Glen Avon
Grandparents (30 to 59 years) White / Caucasian 55 13.0% Responsible for grandchildren372 87.0% Not responsible for grandchildrenAmerican Indian / Alaska Native 15 100.0% Responsible for grandchildrenOther race 150 31.8% Responsible for grandchildren323 68.2% Not responsible for grandchildrenTwo or more races 100 100.0% Not responsible for grandchildrenWhite alone, not Hispanic / Latino 19 16.3% Responsible for grandchildren99 83.7% Not responsible for grandchildrenHispanic or Latino 143 15.8% Responsible for grandchildren761 84.2% Not responsible for grandchildrenGrandparents (60 years and over) White / Caucasian 92 30.8% Responsible for grandchildren206 69.2% Not responsible for grandchildrenOther race 130 55.3% Responsible for grandchildren105 44.7% Not responsible for grandchildrenWhite alone, not Hispanic / Latino 40 35.4% Responsible for grandchildren72 64.6% Not responsible for grandchildrenHispanic or Latino 166 30.6% Responsible for grandchildren375 69.4% Not responsible for grandchildren