Races in Glendale, Colorado (CO) Detailed Stats
Ancestries, Foreign-born residents, place of birth
Settings
X


Recent posts about races in Glendale, Colorado on our local forum with over 2,400,000 registered users:
 | Best Denver suburb for young mixed race family (17 replies) |
| Russians and Georgians in Aurora? (36 replies) |
| Denver vs. Phoenix (34 replies) |
| Thoughts about downtown (86 replies) |
| Aloha Beach Community (62 replies) |
| Denver - is it worth the COL? (316 replies) |
Latest news about races in Glendale, CO collected exclusively by city-data.com from local newspapers, TV, and radio stations
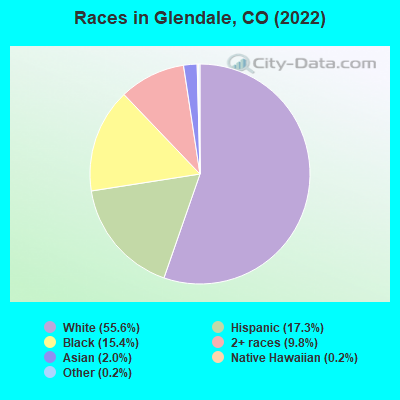
According to 2022 data, the most numerous races in Glendale, CO are White alone (3,315 residents), Hispanic (1,100 residents), and Two or more races (284 residents). 73.6% of Glendale residents speak English at home. 14.3% of Glendale, CO residents are foreign-born (5.7% born in Latin America, 4.5% born in Asia, 2.7% born in Europe), which is 37.3% greater than the foreign-born rate of 9.0% across the entire state of Colorado.
Race distribution in Glendale
2000
2022

- 2,38352.4%White alone
- 1,24527.4%Hispanic
- 4319.5%Black alone
- 2816.2%Asian alone
- 1683.7%Two or more races
- 210.5%American Indian alone
- 120.3%Other race alone
- 60.1%Native Hawaiian and Other
Pacific Islander alone

-
- 3,31561.1%White alone
- 1,10020.3%Hispanic
- 3807.0%Black alone
- 2845.2%Two or more races
- 2715.0%Asian alone
- 631.2%Native Hawaiian and Other
Pacific Islander alone - 120.2%American Indian alone
2000
2022
-
- 3,202,88074.5%White alone
- 735,60117.1%Hispanic
- 158,4433.7%Black alone
- 93,2772.2%Asian alone
- 72,7211.7%Two or more races
- 28,9820.7%American Indian alone
- 5,5120.1%Other race alone
- 3,8450.09%Native Hawaiian and Other
Pacific Islander alone

-
- 3,793,27065.0%White alone
- 1,314,96222.5%Hispanic
- 268,7544.6%Two or more races
- 220,7563.8%Black alone
- 182,6583.1%Asian alone
- 29,7980.5%Other race alone
- 23,3890.4%American Indian alone
- 6,3390.1%Native Hawaiian and Other
Pacific Islander alone

Income and house value in Glendale
- Median household income in 2022
- $71,288White non-Hispanic householders
- $68,446Black householders
- over $200,000American Indian and Alaska Native householders
- $92,738Asian householders
- $53,626Native Hawaiian and other Pacific Islander householders
- $66,524Some other race householders
- $105,178Two or more races householders
- $86,213Hispanic or Latino race householders
- Median 2022 house value
- over $1,000,000White Non-Hispanic householders
- $281,970Some other race householders
- $373,196Two or more races householders
- $281,970Hispanic or Latino householders
Household income for White non-Hispanic householders

Household income for Black householders

Household income for Asian householders

Household income for Some other race householders

Household income for Two or more races householders

Household income for Hispanic or Latino race householders

Median age by race in Glendale
- 31.6Median age for White residents
- 31.7Males
- 31.5Females
- 36.4Median age for Black or African American residents
- 35.2Males
- 38.9Females
- 29.9Median age for Asian residents
- 33.0Males
- 28.7Females
- 38.7Median age for Native Hawaiian / Pacific Islander residents
- 34.5Median age for Other race residents
- 35.7Males
- 35.8Females
- 29.6Median age for Two or more races residents
- 30.0Males
- 34.6Females
- 31.0Median age for White alone residents
- 30.9Males
- 31.1Females
- 33.2Median age for Hispanic or Latino residents
- 33.3Males
- 34.2Females
Owner/renter occupied households by race in Glendale
- House owners and renters - White residents
- 28613.0%Owner occupied
- 1,90987.0%Renter occupied
- House owners and renters - Black or African American residents
- 177.6%Owner occupied
- 20692.4%Renter occupied
- House owners and renters - Asian residents
- 168.4%Owner occupied
- 17691.6%Renter occupied
- House owners and renters - Native Hawaiian / Pacific Islander residents
- 3100.0%Renter occupied
- House owners and renters - Other race residents
- 172100.0%Renter occupied
- House owners and renters - Two or more races residents
- 6014.1%Owner occupied
- 36585.9%Renter occupied
- House owners and renters - White alone residents
- 29313.7%Owner occupied
- 1,84486.3%Renter occupied
- House owners and renters - Hispanic or Latino residents
- 214.9%Owner occupied
- 39995.1%Renter occupied
Language usage in Glendale
- English speakers - Total
- 73.6% of residents of Glendale speak English at home.
- 16.5% of residents speak Spanish at home
- 70781.3%Speak English very well
- 16318.7%Speak English less than very well
- 9.6% of residents speak other language at home
- 47593.7%Speak English very well
- 326.3%Speak English less than very well
- English speakers - Born in the United States
- 84.5% of residents of Glendale speak English at home.
- 11.6% of residents speak Spanish at home
- 383100.0%Speak English very well
- 3.8% of residents speak other language at home
- 9575.4%Speak English very well
- 3124.6%Speak English less than very well
- English speakers - Native, born elsewhere
- 24.5% of residents of Glendale speak English at home.
- 78.2% of residents speak Spanish at home
- 9078.3%Speak English very well
- 2521.7%Speak English less than very well
- English speakers - Foreign-born
- 13.2% of residents of Glendale speak English at home.
- 41.0% of residents speak Spanish at home
- 18056.6%Speak English very well
- 13843.4%Speak English less than very well
- 47.0% of residents speak other language at home
- 364100.0%Speak English very well
White (Caucasian) - Speak only English
| Native: | 89.2% (3,018) |
| Foreign-born: | 16.9% (33) |
White (Caucasian) - Speak another language
| Native: | 9.4% (319) |
| Foreign-born: | 79.5% (154) |
Black or African American - Speak only English
| Native: | 91.1% (302) |
| Foreign-born: | 95.7% (43) |
Asian - Speak only English
| Native: | 100.0% (127) |
| Foreign-born: | 14.7% (26) |
Asian - Speak another language
| Native: | 10.7% (14) |
| Foreign-born: | 84.6% (147) |
Other race - Speak another language
| Native: | 84.6% (280) |
| Foreign-born: | 95.1% (207) |
Two or more races - Speak another language
| Native: | 65.3% (279) |
| Foreign-born: | 100.0% (724) |
White alone - Speak only English
| Native: | 92.2% (2,921) |
| Foreign-born: | 22.3% (34) |
White alone - Speak another language
| Native: | 7.9% (251) |
| Foreign-born: | 78.9% (119) |
Hispanic or Latino - Speak another language
| Native: | 59.1% (459) |
| Foreign-born: | 95.3% (308) |
Foreign-born residents in Glendale
778 residents are foreign born (5.7% Latin America, 4.5% Asia, 2.7% Europe).
| This city: | 14.3% |
| Colorado: | 100.0% |


Marital status for residents in Glendale
Marital status - White (Caucasian) population 15 years and over
- Males
- 65.6%Never married
- 24.1%Now married
- 1.5%Separated
- 0.4%Widowed
- 8.3%Divorced
- Females
- 57.1%Never married
- 30.4%Now married
- 0.0%Separated
- 0.0%Widowed
- 12.5%Divorced
Women who gave birth in the past 12 months
| Now married: | 0.0% (0) |
| Unmarried: | 100.0% (22) |
Women who did not give birth in the past 12 months
| Now married: | 26.3% (305) |
| Unmarried: | 73.7% (855) |
Marital status - Black or African American population 15 years and over
- Males
- 73.0%Never married
- 27.0%Now married
- 0.0%Separated
- 0.0%Widowed
- 0.0%Divorced
- Females
- 54.1%Never married
- 32.4%Now married
- 0.0%Separated
- 0.0%Widowed
- 13.5%Divorced
Women who did not give birth in the past 12 months
| Now married: | 26.8% (23) |
| Unmarried: | 73.2% (64) |
Marital status - Asian population 15 years and over
- Males
- 50.4%Never married
- 13.9%Now married
- 0.0%Separated
- 0.0%Widowed
- 35.8%Divorced
- Females
- 76.6%Never married
- 5.5%Now married
- 0.0%Separated
- 0.0%Widowed
- 18.0%Divorced
Women who did not give birth in the past 12 months
| Now married: | 6.0% (8) |
| Unmarried: | 94.0% (129) |
Marital status - Native Hawaiian / Pacific Islander population 15 years and over
- Males
- 100.0%Never married
- 0.0%Now married
- 0.0%Separated
- 0.0%Widowed
- 0.0%Divorced
- Females
- 11.8%Never married
- 88.2%Now married
- 0.0%Separated
- 0.0%Widowed
- 0.0%Divorced
Women who did not give birth in the past 12 months
| Now married: | 88.2% (23) |
| Unmarried: | 11.8% (3) |
Marital status - Other race population 15 years and over
- Males
- 62.7%Never married
- 25.7%Now married
- 0.0%Separated
- 0.0%Widowed
- 11.6%Divorced
- Females
- 32.4%Never married
- 30.3%Now married
- 10.8%Separated
- 0.0%Widowed
- 26.5%Divorced
Women who did not give birth in the past 12 months
| Now married: | 41.1% (92) |
| Unmarried: | 58.9% (133) |
Marital status - Two or more races population 15 years and over
- Males
- 81.0%Never married
- 0.0%Now married
- 19.0%Separated
- 0.0%Widowed
- 0.0%Divorced
- Females
- 44.5%Never married
- 17.3%Now married
- 0.0%Separated
- 0.0%Widowed
- 38.2%Divorced
Women who did not give birth in the past 12 months
| Now married: | 27.9% (57) |
| Unmarried: | 72.1% (146) |
Marital status - White alone, not Hispanic / Latino population 15 years and over
- Males
- 66.2%Never married
- 23.1%Now married
- 1.7%Separated
- 0.5%Widowed
- 8.6%Divorced
- Females
- 59.3%Never married
- 26.4%Now married
- 0.0%Separated
- 0.0%Widowed
- 14.3%Divorced
Women who gave birth in the past 12 months
| Now married: | 0.0% (0) |
| Unmarried: | 100.0% (23) |
Women who did not give birth in the past 12 months
| Now married: | 23.9% (245) |
| Unmarried: | 76.1% (781) |
Marital status - Hispanic or Latino population 15 years and over
- Males
- 59.5%Never married
- 27.2%Now married
- 4.9%Separated
- 0.0%Widowed
- 8.4%Divorced
- Females
- 44.2%Never married
- 39.7%Now married
- 4.1%Separated
- 0.0%Widowed
- 12.0%Divorced
Women who did not give birth in the past 12 months
| Now married: | 37.3% (181) |
| Unmarried: | 62.7% (304) |
Ancestries in Glendale

- 29911.4%Irish
- 1576.0%English
- 1475.6%German
- 1154.4%European
- 793.0%Scottish
- 622.4%Polish
- 602.3%Italian
- 411.6%Arab
- 341.3%French Canadian
- 331.3%American
- 261.0%French
- 230.9%African
- 220.8%Swedish
- 200.8%Russian
- 200.8%Yugoslavian
- 190.7%Croatian
- 160.6%Northern European
- 150.6%Greek
- 130.5%Dutch
- 120.5%Danish
- 80.3%Scandinavian
- 70.3%Norwegian

Geographical mobility in Glendale

- Same house 1 year ago
- 2,29964.0%White (Caucasian)
- 32686.7%Black or African American
- 17158.1%Asian
- 2846.3%Native Hawaiian / Pacific Islander
- 32058.3%Other race
- 35953.0%Two or more races
- 2,12364.0%White alone, not Hispanic / Latino
- 64761.4%Hispanic or Latino

-
- Moved within same county
- 1644.6%White / Caucasian
- 82.8%Asian
- 417.5%Other race
- 1655.0%White alone, not Hispanic / Latino
- 625.9%Hispanic or Latino

-
- Moved within same state
- 63217.6%White / Caucasian
- 5920.0%Asian
- 3762.1%Native Hawaiian / Pacific Islander
- 6712.1%Other race
- 24936.8%Two or more races
- 56617.1%White alone, not Hispanic / Latino
- 12411.8%Hispanic or Latino

-
- Moved from different state
- 52514.6%White / Caucasian
- 5615.0%Black or African American
- 15100.0%American Indian / Alaska Native
- 299.9%Asian
- 610.1%Native Hawaiian / Pacific Islander
- 9316.8%Other race
- 669.7%Two or more races
- 45513.7%White alone, not Hispanic / Latino
- 18717.7%Hispanic or Latino

-
- Moved from abroad
- 6411.7%Other race
- 504.7%Hispanic or Latino

Children Nativity (place of birth) in Glendale
Place of birth for residents in Glendale
![Place of birth for the foreign-born population - Regions]()
- 341Americas
- 302Latin America
- 238Asia
- 166Central America
- 143Europe
- 122South America
- 99Eastern Asia
- 78South Eastern Asia
- 69Eastern Europe
- 57Western Europe
- 49Western Asia
- 42China
- 39Northern America
- 30Oceania
- 24Africa
- 24Western Africa
- 16Southern Europe
- 13Caribbean
- 11South Central Asia

![Place of birth for the foreign-born population - Countries]()
- 135Mexico
- 79Peru
- 57France
- 43Venezuela
- 42China
- 39Canada
- 36Thailand
- 33Korea
- 31El Salvador
- 30Micronesia
- 24Singapore
- 24Liberia
- 23Bosnia and Herzegovina
- 23Croatia
- 23Russia
- 16Greece
- 13Barbados
- 11India
- 11Philippines
- 7Vietnam

Zip codes: 80246.