Races in Gold River, California (CA) Detailed Stats
Ancestries, Foreign-born residents, place of birth
Settings
X


Recent posts about races in Gold River, California on our local forum with over 2,400,000 registered users:
 | Japanese presense at all in Sacramento? Or good Asian presense? (84 replies) |
| Suggestions for getting our first house (89 replies) |
| American River Canyon (Folsom) vs Folsom, Gold River, Carmichael (16 replies) |
| Lennar new home in Rancho Cordova (53 replies) |
| Why older homes so small? (43 replies) |
| Sacramento Relocation and Commutes, looking for help! (16 replies) |
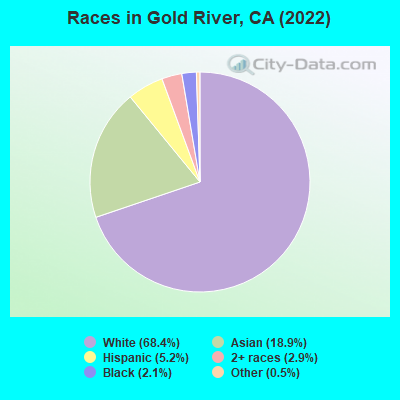
According to 2022 data, the most numerous races in Gold River, CA are Hispanic (371 residents), White alone (4,797 residents), and Asian alone (1,745 residents). 78.2% of Gold River residents speak English at home. 18.1% of Gold River, CA residents are foreign-born (15.7% born in Asia), which is 43.7% less than the foreign-born rate of 26.0% across the entire state of California.
Race distribution in Gold River
2000
2022

- 6,14776.6%White alone
- 1,21115.1%Asian alone
- 3274.1%Hispanic
- 1982.5%Two or more races
- 981.2%Black alone
- 130.2%Other race alone
- 180.2%American Indian alone
- 110.1%Native Hawaiian and Other
Pacific Islander alone

-
- 4,79762.4%White alone
- 1,74522.7%Asian alone
- 4485.8%Two or more races
- 3714.8%Hispanic
- 1491.9%Black alone
- 120.2%Native Hawaiian and Other
Pacific Islander alone - 110.1%American Indian alone
2000
2022
-
- 15,816,79046.7%White alone
- 10,966,55632.4%Hispanic
- 3,648,86010.8%Asian alone
- 2,181,9266.4%Black alone
- 903,1152.7%Two or more races
- 178,9840.5%American Indian alone
- 103,7360.3%Native Hawaiian and Other
Pacific Islander alone - 71,6810.2%Other race alone

-
- 15,732,18440.3%Hispanic
- 13,160,42633.7%White alone
- 5,957,86715.3%Asian alone
- 2,025,2185.2%Black alone
- 1,663,2224.3%Two or more races
- 251,6180.6%Other race alone
- 135,7770.3%Native Hawaiian and Other
Pacific Islander alone - 103,0300.3%American Indian alone

Income and house value in Gold River
- Median household income in 2022
- $156,951White non-Hispanic householders
- $155,265Black householders
- over $200,000American Indian and Alaska Native householders
- $142,192Asian householders
- $115,750Some other race householders
- $98,574Two or more races householders
- $108,700Hispanic or Latino race householders
- Median 2022 house value
- $920,340White Non-Hispanic householders
- $939,056Black or African American householders
- $764,850American Indian or Alaska Native householders
- $851,233Asian householders
- $809,841Some other race householders
- $877,508Two or more races householders
- $935,457Hispanic or Latino householders
Household income for White non-Hispanic householders

Household income for Black householders

Household income for Asian householders

Household income for Two or more races householders

Household income for Hispanic or Latino race householders

Median age by race in Gold River
- 63.2Median age for White residents
- 62.7Males
- 63.5Females
- 63.6Median age for Black or African American residents
- 47.9Males
- 63.7Females
- 42.3Median age for Asian residents
- 37.1Males
- 47.8Females
- 29.3Median age for Other race residents
- 30.7Males
- 25.6Females
- 27.8Median age for Two or more races residents
- 27.8Males
- 28.5Females
- 59.3Median age for White alone residents
- 58.6Males
- 59.8Females
- 67.0Median age for Hispanic or Latino residents
- 30.2Males
- 66.7Females
Owner/renter occupied households by race in Gold River
- House owners and renters - White residents
- 2,05690.1%Owner occupied
- 2279.9%Renter occupied
- House owners and renters - Black or African American residents
- 7757.1%Owner occupied
- 5842.9%Renter occupied
- House owners and renters - American Indian / Alaska Native residents
- 28100.0%Renter occupied
- House owners and renters - Asian residents
- 51489.9%Owner occupied
- 5810.1%Renter occupied
- House owners and renters - Other race residents
- 20100.0%Renter occupied
- House owners and renters - Two or more races residents
- 30684.8%Owner occupied
- 5515.2%Renter occupied
- House owners and renters - White alone residents
- 2,14789.8%Owner occupied
- 24510.2%Renter occupied
- House owners and renters - Hispanic or Latino residents
- 9272.2%Owner occupied
- 3627.8%Renter occupied
Language usage in Gold River
- English speakers - Total
- 78.2% of residents of Gold River speak English at home.
- 1.9% of residents speak Spanish at home
- 13795.1%Speak English very well
- 74.9%Speak English less than very well
- 20.6% of residents speak other language at home
- 1,17076.7%Speak English very well
- 35523.3%Speak English less than very well
- English speakers - Born in the United States
- 93.0% of residents of Gold River speak English at home.
- 1.4% of residents speak Spanish at home
- 2376.7%Speak English very well
- 723.3%Speak English less than very well
- 5.5% of residents speak other language at home
- 10186.3%Speak English very well
- 1613.7%Speak English less than very well
- English speakers - Native, born elsewhere
- 53.4% of residents of Gold River speak English at home.
- 44.3% of residents speak other language at home
- 6685.7%Speak English very well
- 1114.3%Speak English less than very well
- English speakers - Foreign-born
- 18.2% of residents of Gold River speak English at home.
- 2.9% of residents speak Spanish at home
- 40100.0%Speak English very well
- 82.4% of residents speak other language at home
- 79771.0%Speak English very well
- 32529.0%Speak English less than very well
White (Caucasian) - Speak only English
| Native: | 100.0% (4,195) |
| Foreign-born: | 63.2% (91) |
White (Caucasian) - Speak another language
| Native: | 3.6% (152) |
| Foreign-born: | 53.2% (77) |
Asian - Speak only English
| Native: | 67.8% (374) |
| Foreign-born: | 12.9% (151) |
Asian - Speak another language
| Native: | 31.5% (174) |
| Foreign-born: | 87.4% (1,023) |
Two or more races - Speak only English
| Native: | 62.8% (524) |
| Foreign-born: | 25.2% (22) |
White alone - Speak only English
| Native: | 95.6% (4,331) |
| Foreign-born: | 47.1% (93) |
White alone - Speak another language
| Native: | 4.3% (197) |
| Foreign-born: | 53.5% (105) |
Hispanic or Latino - Speak only English
| Native: | 85.1% (280) |
| Foreign-born: | 27.6% (9) |
Hispanic or Latino - Speak another language
| Native: | 20.1% (66) |
| Foreign-born: | 76.4% (25) |
Foreign-born residents in Gold River
1,391 residents are foreign born (15.7% Asia).
| This city: | 18.1% |
| California: | 100.0% |


Marital status for residents in Gold River
Marital status - White (Caucasian) population 15 years and over
- Males
- 16.8%Never married
- 67.6%Now married
- 0.9%Separated
- 7.6%Widowed
- 7.1%Divorced
- Females
- 12.3%Never married
- 61.7%Now married
- 1.5%Separated
- 8.0%Widowed
- 16.5%Divorced
Women who did not give birth in the past 12 months
| Now married: | 46.2% (253) |
| Unmarried: | 53.8% (295) |
Marital status - Black or African American population 15 years and over
- Males
- 14.4%Never married
- 35.6%Now married
- 0.0%Separated
- 0.0%Widowed
- 50.0%Divorced
- Females
- 27.1%Never married
- 43.8%Now married
- 0.0%Separated
- 29.2%Widowed
- 0.0%Divorced
Marital status - Asian population 15 years and over
- Males
- 34.4%Never married
- 63.6%Now married
- 1.0%Separated
- 0.0%Widowed
- 1.0%Divorced
- Females
- 15.9%Never married
- 69.1%Now married
- 1.9%Separated
- 2.4%Widowed
- 10.7%Divorced
Women who gave birth in the past 12 months
| Now married: | 100.0% (33) |
| Unmarried: | 0.0% (0) |
Women who did not give birth in the past 12 months
| Now married: | 67.9% (290) |
| Unmarried: | 32.1% (137) |
Marital status - Two or more races population 15 years and over
- Males
- 33.1%Never married
- 44.9%Now married
- 0.0%Separated
- 9.4%Widowed
- 12.6%Divorced
- Females
- 50.0%Never married
- 22.9%Now married
- 0.0%Separated
- 11.0%Widowed
- 16.1%Divorced
Women who gave birth in the past 12 months
| Now married: | 100.0% (56) |
| Unmarried: | 0.0% (0) |
Women who did not give birth in the past 12 months
| Now married: | 11.4% (33) |
| Unmarried: | 88.6% (256) |
Marital status - White alone, not Hispanic / Latino population 15 years and over
- Males
- 16.7%Never married
- 67.2%Now married
- 1.0%Separated
- 7.9%Widowed
- 7.3%Divorced
- Females
- 11.9%Never married
- 62.2%Now married
- 0.7%Separated
- 8.4%Widowed
- 16.9%Divorced
Women who did not give birth in the past 12 months
| Now married: | 47.6% (308) |
| Unmarried: | 52.4% (339) |
Marital status - Hispanic or Latino population 15 years and over
- Males
- 37.7%Never married
- 62.3%Now married
- 0.0%Separated
- 0.0%Widowed
- 0.0%Divorced
- Females
- 18.5%Never married
- 57.1%Now married
- 17.6%Separated
- 0.0%Widowed
- 6.7%Divorced
Women who gave birth in the past 12 months
| Now married: | 100.0% (18) |
| Unmarried: | 0.0% (0) |
Women who did not give birth in the past 12 months
| Now married: | 0.0% (0) |
| Unmarried: | 100.0% (23) |
Ancestries in Gold River

- 37910.0%American
- 2626.9%German
- 2366.2%English
- 2316.1%European
- 1524.0%Irish
- 962.5%Italian
- 922.4%Russian
- 651.7%Northern European
- 441.2%Norwegian
- 411.1%Scottish
- 360.9%British
- 340.9%Eastern European
- 340.9%Iranian
- 290.8%Swedish
- 230.6%Greek
- 230.6%Welsh
- 180.5%Czech
- 180.5%French
- 170.4%Brazilian
- 160.4%Finnish
- 150.4%Polish
- 150.4%Scotch-Irish
- 150.4%Serbian
- 140.4%French Canadian
- 110.3%Australian
- 90.2%Austrian
- 90.2%Dutch
- 70.2%Basque
- 70.2%Portuguese
- 60.2%Slavic

Geographical mobility in Gold River

- Same house 1 year ago
- 3,85291.7%White (Caucasian)
- 17399.5%Black or African American
- 1,76899.4%Asian
- 12100.0%Native Hawaiian / Pacific Islander
- 2857.5%Other race
- 1,023100.0%Two or more races
- 4,45492.3%White alone, not Hispanic / Latino
- 28181.6%Hispanic or Latino

-
- Moved within same county
- 2044.9%White / Caucasian
- 25100.0%American Indian / Alaska Native
- 422.4%Asian
- 1938.8%Other race
- 232.3%Two or more races
- 2525.2%White alone, not Hispanic / Latino
- 236.7%Hispanic or Latino

-
- Moved within same state
- 1212.9%White / Caucasian
- 70.4%Asian
- 861.8%White alone, not Hispanic / Latino
- 3911.4%Hispanic or Latino

-
- Moved from different state
- 280.7%White / Caucasian
- 50.3%Asian
- 350.7%White alone, not Hispanic / Latino

-
- Moved from abroad
- 120.3%White
- 200.4%White alone, not Hispanic / Latino

Children Nativity (place of birth) in Gold River
Place of birth for residents in Gold River
![Place of birth for the foreign-born population - Regions]()
- 1,196Asia
- 583Eastern Asia
- 347South Central Asia
- 251South Eastern Asia
- 235China
- 104Europe
- 65Americas
- 41Eastern Europe
- 41Latin America
- 27Central America
- 25Oceania
- 24Northern Europe
- 24Northern America
- 21Western Europe
- 17Southern Europe
- 14South America
- 13Australia and New Zealand Subregion

![Place of birth for the foreign-born population - Countries]()
- 334Korea
- 283India
- 185Philippines
- 145China
- 60Taiwan
- 44Cambodia
- 34Russia
- 29Hong Kong
- 29Pakistan
- 27Iran
- 27Mexico
- 24Canada
- 21Germany
- 21Thailand
- 16England
- 14Brazil
- 13Japan
- 13Australia
- 12Micronesia
- 9Italy
- 8United Kingdom
- 8Spain
- 7Sri Lanka

Zip codes: 95670.