Races in Goodlettsville, Tennessee (TN) Detailed Stats
Data:
Races - White alone (%)
Races - White alone (% change since 2000)
Races - Black alone (%)
Races - Black alone (% change since 2000)
Races - American Indian alone (%)
Races - American Indian alone (% change since 2000)
Races - Asian alone (%)
Races - Asian alone (% change since 2000)
Races - Hispanic (%)
Races - Hispanic (% change since 2000)
Races - Native Hawaiian and Other Pacific Islander alone (%)
Races - Native Hawaiian and Other Pacific Islander alone (% change since 2000)
Races - Two or more races(%)
Races - Two or more races(% change since 2000)
Races - Other race alone (%)
Races - Other race alone (% change since 2000)
Racial diversity
Place of birth - Born in state of residence (%)
Place of birth - Born in state of residence (%) - White
Place of birth - Born in state of residence (%) - Black or African American
Place of birth - Born in state of residence (%) - Asian
Place of birth - Born in state of residence (%) - Hispanic or Latino
Place of birth - Born in state of residence (%) - American Indian and Alaska Native
Place of birth - Born in state of residence (%) - Multirace
Place of birth - Born in state of residence (%) - Other Race
Place of birth - Born in other state (%)
Place of birth - Born in other state (%) - White
Place of birth - Born in other state (%) - Black or African American
Place of birth - Born in other state (%) - Asian
Place of birth - Born in other state (%) - Hispanic or Latino
Place of birth - Born in other state (%) - American Indian and Alaska Native
Place of birth - Born in other state (%) - Multirace
Place of birth - Born in other state (%) - Other Race
Place of birth - Native, outside of US (%)
Place of birth - Native, outside of US (%) - White
Place of birth - Native, outside of US (%) - Black or African American
Place of birth - Native, outside of US (%) - Asian
Place of birth - Native, outside of US (%) - Hispanic or Latino
Place of birth - Native, outside of US (%) - American Indian and Alaska Native
Place of birth - Native, outside of US (%) - Multirace
Place of birth - Native, outside of US (%) - Other Race
Place of birth - Foreign born (%)
Place of birth - Foreign born (%) - White
Place of birth - Foreign born (%) - Black or African American
Place of birth - Foreign born (%) - Asian
Place of birth - Foreign born (%) - Hispanic or Latino
Place of birth - Foreign born (%) - American Indian and Alaska Native
Place of birth - Foreign born (%) - Multirace
Place of birth - Foreign born (%) - Other Race
Residents speaking English at home (%)
Residents speaking English at home - Born in the United States (%)
Residents speaking English at home - Native, born elsewhere (%)
Residents speaking English at home - Foreign born (%)
Residents speaking Spanish at home (%)
Residents speaking Spanish at home - Born in the United States (%)
Residents speaking Spanish at home - Native, born elsewhere (%)
Residents speaking Spanish at home - Foreign born (%)
Residents speaking other language at home (%)
Residents speaking other language at home - Born in the United States (%)
Residents speaking other language at home - Native, born elsewhere (%)
Residents speaking other language at home - Foreign born (%)
Marital status - Never married (%)
Marital status - Now married (%)
Marital status - Separated (%)
Marital status - Widowed (%)
Marital status - Divorced (%)
Ancestries Reported - Arab (%)
Ancestries Reported - Czech (%)
Ancestries Reported - Danish (%)
Ancestries Reported - Dutch (%)
Ancestries Reported - English (%)
Ancestries Reported - French (%)
Ancestries Reported - French Canadian (%)
Ancestries Reported - German (%)
Ancestries Reported - Greek (%)
Ancestries Reported - Hungarian (%)
Ancestries Reported - Irish (%)
Ancestries Reported - Italian (%)
Ancestries Reported - Lithuanian (%)
Ancestries Reported - Norwegian (%)
Ancestries Reported - Polish (%)
Ancestries Reported - Portuguese (%)
Ancestries Reported - Russian (%)
Ancestries Reported - Scotch-Irish (%)
Ancestries Reported - Scottish (%)
Ancestries Reported - Slovak (%)
Ancestries Reported - Subsaharan African (%)
Ancestries Reported - Swedish (%)
Ancestries Reported - Swiss (%)
Ancestries Reported - Ukrainian (%)
Ancestries Reported - United States (%)
Ancestries Reported - Welsh (%)
Ancestries Reported - West Indian (%)
Ancestries Reported - Other (%)
Geographical mobility - Same house 1 year ago (%)
Geographical mobility - Same house 1 year ago (%) - White
Geographical mobility - Same house 1 year ago (%) - Black or African American
Geographical mobility - Same house 1 year ago (%) - Asian
Geographical mobility - Same house 1 year ago (%) - Hispanic or Latino
Geographical mobility - Same house 1 year ago (%) - American Indian and Alaska Native
Geographical mobility - Same house 1 year ago (%) - Multirace
Geographical mobility - Same house 1 year ago (%) - Other Race
Geographical mobility - Moved within same county (%)
Geographical mobility - Moved within same county (%) - White
Geographical mobility - Moved within same county (%) - Black or African American
Geographical mobility - Moved within same county (%) - Asian
Geographical mobility - Moved within same county (%) - Hispanic or Latino
Geographical mobility - Moved within same county (%) - American Indian and Alaska Native
Geographical mobility - Moved within same county (%) - Multirace
Geographical mobility - Moved within same county (%) - Other Race
Geographical mobility - Moved from different county within same state (%)
Geographical mobility - Moved from different county within same state (%) - White
Geographical mobility - Moved from different county within same state (%) - Black or African American
Geographical mobility - Moved from different county within same state (%) - Asian
Geographical mobility - Moved from different county within same state (%) - Hispanic or Latino
Geographical mobility - Moved from different county within same state (%) - American Indian and Alaska Native
Geographical mobility - Moved from different county within same state (%) - Multirace
Geographical mobility - Moved from different county within same state (%) - Other Race
Geographical mobility - Moved from different state (%)
Geographical mobility - Moved from different state (%) - White
Geographical mobility - Moved from different state (%) - Black or African American
Geographical mobility - Moved from different state (%) - Asian
Geographical mobility - Moved from different state (%) - Hispanic or Latino
Geographical mobility - Moved from different state (%) - American Indian and Alaska Native
Geographical mobility - Moved from different state (%) - Multirace
Geographical mobility - Moved from different state (%) - Other Race
Geographical mobility - Moved from abroad (%)
Geographical mobility - Moved from abroad (%) - White
Geographical mobility - Moved from abroad (%) - Black or African American
Geographical mobility - Moved from abroad (%) - Asian
Geographical mobility - Moved from abroad (%) - Hispanic or Latino
Geographical mobility - Moved from abroad (%) - American Indian and Alaska Native
Geographical mobility - Moved from abroad (%) - Multirace
Geographical mobility - Moved from abroad (%) - Other Race
Place of birth for the foreign-born population - Ireland (%)
Place of birth for the foreign-born population - Denmark (%)
Place of birth for the foreign-born population - Norway (%)
Place of birth for the foreign-born population - Sweden (%)
Place of birth for the foreign-born population - United Kingdom (%)
Place of birth for the foreign-born population - England (%)
Place of birth for the foreign-born population - Scotland (%)
Place of birth for the foreign-born population - Other Northern Europe (%)
Place of birth for the foreign-born population - Austria (%)
Place of birth for the foreign-born population - Belgium (%)
Place of birth for the foreign-born population - France (%)
Place of birth for the foreign-born population - Germany (%)
Place of birth for the foreign-born population - Netherlands (%)
Place of birth for the foreign-born population - Switzerland (%)
Place of birth for the foreign-born population - Other Western Europe (%)
Place of birth for the foreign-born population - Greece (%)
Place of birth for the foreign-born population - Italy (%)
Place of birth for the foreign-born population - Portugal (%)
Place of birth for the foreign-born population - Spain (%)
Place of birth for the foreign-born population - Other Southern Europe (%)
Place of birth for the foreign-born population - Albania (%)
Place of birth for the foreign-born population - Belarus (%)
Place of birth for the foreign-born population - Bosnia and Herzegovina (%)
Place of birth for the foreign-born population - Bulgaria (%)
Place of birth for the foreign-born population - Croatia (%)
Place of birth for the foreign-born population - Czechoslovakia (%)
Place of birth for the foreign-born population - Hungary (%)
Place of birth for the foreign-born population - Latvia (%)
Place of birth for the foreign-born population - Lithuania (%)
Place of birth for the foreign-born population - North Macedonia (Macedonia) (%)
Place of birth for the foreign-born population - Moldova (%)
Place of birth for the foreign-born population - Poland (%)
Place of birth for the foreign-born population - Romania (%)
Place of birth for the foreign-born population - Russia (%)
Place of birth for the foreign-born population - Serbia (%)
Place of birth for the foreign-born population - Ukraine (%)
Place of birth for the foreign-born population - Other Eastern Europe (%)
Place of birth for the foreign-born population - China (%)
Place of birth for the foreign-born population - Hong Kong (%)
Place of birth for the foreign-born population - Taiwan (%)
Place of birth for the foreign-born population - Japan (%)
Place of birth for the foreign-born population - Korea (%)
Place of birth for the foreign-born population - Other Eastern Asia (%)
Place of birth for the foreign-born population - Afghanistan (%)
Place of birth for the foreign-born population - Bangladesh (%)
Place of birth for the foreign-born population - India (%)
Place of birth for the foreign-born population - Iran (%)
Place of birth for the foreign-born population - Kazakhstan (%)
Place of birth for the foreign-born population - Nepal (%)
Place of birth for the foreign-born population - Pakistan (%)
Place of birth for the foreign-born population - Sri Lanka (%)
Place of birth for the foreign-born population - Uzbekistan (%)
Place of birth for the foreign-born population - Other South Central Asia (%)
Place of birth for the foreign-born population - Burma (%)
Place of birth for the foreign-born population - Cambodia (%)
Place of birth for the foreign-born population - Indonesia (%)
Place of birth for the foreign-born population - Laos (%)
Place of birth for the foreign-born population - Malaysia (%)
Place of birth for the foreign-born population - Philippines (%)
Place of birth for the foreign-born population - Singapore (%)
Place of birth for the foreign-born population - Thailand (%)
Place of birth for the foreign-born population - Vietnam (%)
Place of birth for the foreign-born population - Other South Eastern Asia (%)
Place of birth for the foreign-born population - Armenia (%)
Place of birth for the foreign-born population - Iraq (%)
Place of birth for the foreign-born population - Israel (%)
Place of birth for the foreign-born population - Jordan (%)
Place of birth for the foreign-born population - Kuwait (%)
Place of birth for the foreign-born population - Lebanon (%)
Place of birth for the foreign-born population - Saudi Arabia (%)
Place of birth for the foreign-born population - Syria (%)
Place of birth for the foreign-born population - Turkey (%)
Place of birth for the foreign-born population - Yemen (%)
Place of birth for the foreign-born population - Other Western Asia (%)
Place of birth for the foreign-born population - Eritrea (%)
Place of birth for the foreign-born population - Ethiopia (%)
Place of birth for the foreign-born population - Kenya (%)
Place of birth for the foreign-born population - Somalia (%)
Place of birth for the foreign-born population - Uganda (%)
Place of birth for the foreign-born population - Zimbabwe (%)
Place of birth for the foreign-born population - Other Eastern Africa (%)
Place of birth for the foreign-born population - Cameroon (%)
Place of birth for the foreign-born population - Congo (%)
Place of birth for the foreign-born population - Democratic Republic of Congo (Zaire) (%)
Place of birth for the foreign-born population - Other Middle Africa (%)
Place of birth for the foreign-born population - Egypt (%)
Place of birth for the foreign-born population - Morocco (%)
Place of birth for the foreign-born population - Sudan (%)
Place of birth for the foreign-born population - Other Northern Africa (%)
Place of birth for the foreign-born population - South Africa (%)
Place of birth for the foreign-born population - Other Southern Africa (%)
Place of birth for the foreign-born population - Cabo Verde (%)
Place of birth for the foreign-born population - Ghana (%)
Place of birth for the foreign-born population - Liberia (%)
Place of birth for the foreign-born population - Nigeria (%)
Place of birth for the foreign-born population - Senegal (%)
Place of birth for the foreign-born population - Sierra Leone (%)
Place of birth for the foreign-born population - Other Western Africa (%)
Place of birth for the foreign-born population - Australia (%)
Place of birth for the foreign-born population - New Zealand (%)
Place of birth for the foreign-born population - Fiji (%)
Place of birth for the foreign-born population - Micronesia (%)
Place of birth for the foreign-born population - Bahamas (%)
Place of birth for the foreign-born population - Barbados (%)
Place of birth for the foreign-born population - Cuba (%)
Place of birth for the foreign-born population - Dominica (%)
Place of birth for the foreign-born population - Dominican Republic (%)
Place of birth for the foreign-born population - Grenada (%)
Place of birth for the foreign-born population - Haiti (%)
Place of birth for the foreign-born population - Jamaica (%)
Place of birth for the foreign-born population - St. Vincent and the Grenadines (%)
Place of birth for the foreign-born population - Trinidad and Tobago (%)
Place of birth for the foreign-born population - West Indies (%)
Place of birth for the foreign-born population - Other Caribbean (%)
Place of birth for the foreign-born population - Belize (%)
Place of birth for the foreign-born population - Costa Rica (%)
Place of birth for the foreign-born population - El Salvador (%)
Place of birth for the foreign-born population - Guatemala (%)
Place of birth for the foreign-born population - Honduras (%)
Place of birth for the foreign-born population - Mexico (%)
Place of birth for the foreign-born population - Nicaragua (%)
Place of birth for the foreign-born population - Panama (%)
Place of birth for the foreign-born population - Other Central America (%)
Place of birth for the foreign-born population - Argentina (%)
Place of birth for the foreign-born population - Bolivia (%)
Place of birth for the foreign-born population - Brazil (%)
Place of birth for the foreign-born population - Chile (%)
Place of birth for the foreign-born population - Colombia (%)
Place of birth for the foreign-born population - Ecuador (%)
Place of birth for the foreign-born population - Guyana (%)
Place of birth for the foreign-born population - Peru (%)
Place of birth for the foreign-born population - Uruguay (%)
Place of birth for the foreign-born population - Venezuela (%)
Place of birth for the foreign-born population - Other South America (%)
Place of birth for the foreign-born population - Canada (%)
Place of birth for the foreign-born population - Other Northern America (%)
Place of birth for the foreign-born population - Other (%)
Latest news about races in Goodlettsville, TN collected exclusively by city-data.com from local newspapers, TV, and radio stations
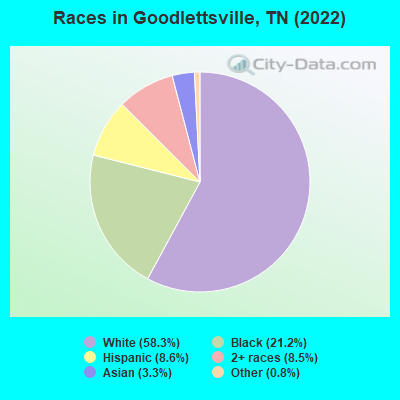
According to 2022 data, the most numerous races in Goodlettsville, TN are White alone (10,182 residents), Black alone (3,695 residents), and Hispanic (1,510 residents). 91.5% of Goodlettsville residents speak English at home. 6.2% of Goodlettsville, TN residents are foreign-born (3.1% born in Latin America, 2.1% born in Asia), which is 18.9% greater than the foreign-born rate of 5.0% across the entire state of Tennessee.
Race distribution in Goodlettsville
2000 2022
4,505,930 79.2% White alone 928,204 16.3% Black alone 123,838 2.2% Hispanic 54,824 1.0% Two or more races 56,077 1.0% Asian alone 13,820 0.2% American Indian alone 4,780 0.08% Other race alone 1,810 0.03% Native Hawaiian and Other
5,070,026 71.9% White alone 1,089,738 15.5% Black alone 442,629 6.3% Hispanic 279,381 4.0% Two or more races 131,817 1.9% Asian alone 26,972 0.4% Other race alone 6,387 0.09% American Indian alone 4,389 0.06% Native Hawaiian and Other
Income and house value in Goodlettsville Median household income in 2022 $68,116 White non-Hispanic householders$58,177 Black householders$45,510 Some other race householders$61,342 Two or more races householders$58,244 Hispanic or Latino race householdersMedian 2022 house value $379,593 White Non-Hispanic householders$357,016 Black or African American householders$204,396 American Indian or Alaska Native householders $502,411 Asian householders$413,910 Some other race householders$364,241 Two or more races householders$225,769 Hispanic or Latino householders
Median age by race in Goodlettsville
43.4 Median age for White residents38.8 49.0 41.2 Median age for Black or African American residents31.7 42.0 -1,114,106,018.7 Median age for American Indian / Alaska Native residents-819,407,007.3 -1,119,496,854.2 40.6 Median age for Asian residents40.6 42.9 -1,127,035,829.5 Median age for Native Hawaiian / Pacific Islander residents-1,023,709,901.3 -782,326,185.1 26.9 Median age for Other race residents22.3 38.6 30.5 Median age for Two or more races residents19.1 32.5 44.3 Median age for White alone residents38.7 50.8 26.9 Median age for Hispanic or Latino residents18.6 28.2
Owner/renter occupied households by race in Goodlettsville
House owners and renters - White residents 3,705 72.7% Owner occupied1,390 27.3% Renter occupiedHouse owners and renters - Black or African American residents 491 31.8% Owner occupied1,054 68.2% Renter occupiedHouse owners and renters - Asian residents 85 52.7% Owner occupied76 47.3% Renter occupiedHouse owners and renters - Other race residents 136 57.5% Owner occupied100 42.5% Renter occupiedHouse owners and renters - Two or more races residents 384 43.2% Owner occupied506 56.8% Renter occupiedHouse owners and renters - White alone residents 3,649 72.1% Owner occupied1,413 27.9% Renter occupiedHouse owners and renters - Hispanic or Latino residents 286 51.9% Owner occupied266 48.1% Renter occupied
Language usage in Goodlettsville
English speakers - Total 91.5% of residents of Goodlettsville speak English at home.
6.5% of residents speak Spanish at home 539 50.5% Speak English very well528 49.5% Speak English less than very well2.3% of residents speak other language at home 162 43.8% Speak English very well208 56.2% Speak English less than very well
English speakers - Born in the United States 95.0% of residents of Goodlettsville speak English at home.
5.2% of residents speak Spanish at home 242 70.1% Speak English very well103 29.9% Speak English less than very well0.3% of residents speak other language at home 20 100.0% Speak English very well
English speakers - Native, born elsewhere 33.5% of residents of Goodlettsville speak English at home.
56.5% of residents speak Spanish at home 96 100.0% Speak English less than very well
English speakers - Foreign-born 16.5% of residents of Goodlettsville speak English at home.
52.8% of residents speak Spanish at home 184 36.2% Speak English very well324 63.8% Speak English less than very well32.2% of residents speak other language at home 114 36.8% Speak English very well196 63.2% Speak English less than very well
White (Caucasian) - Speak only English Native:
99.7% (9,765)Foreign-born:
28.3% (49)
White (Caucasian) - Speak another language Native:
1.2% (115)Foreign-born:
73.0% (127)
Black or African American - Speak only English Native:
99.2% (3,410)Foreign-born:
21.2% (11)
Black or African American - Speak another language Native:
0.9% (32)Foreign-born:
78.7% (40)
Asian - Speak only English Native:
75.3% (155)Foreign-born:
21.0% (73)
Asian - Speak another language Native:
9.1% (19)Foreign-born:
79.6% (276)
Other race - Speak another language Native:
62.3% (291)Foreign-born:
97.4% (140)
Two or more races - Speak only English Native:
87.1% (1,630)Foreign-born:
14.1% (38)
Two or more races - Speak another language Native:
8.3% (155)Foreign-born:
80.2% (214)
White alone - Speak only English Native:
99.2% (9,704)Foreign-born:
72.1% (55)
White alone - Speak another language Native:
0.8% (79)Foreign-born:
15.4% (12)
Hispanic or Latino - Speak only English Native:
37.1% (315)Foreign-born:
4.7% (25)
Hispanic or Latino - Speak another language Native:
59.6% (505)Foreign-born:
95.3% (507)
Foreign-born residents in Goodlettsville 1,076 residents are foreign born (3.1% Latin America , 2.1% Asia ).
This city:
6.2%Tennessee:
5.4%
Marital status for residents in Goodlettsville Marital status - White (Caucasian) population 15 years and over
Males 27.7% Never married55.3% Now married0.8% Separated4.7% Widowed11.6% DivorcedFemales 23.3% Never married42.7% Now married1.7% Separated17.5% Widowed14.9% DivorcedWomen who gave birth in the past 12 months Now married:
88.4% (110)Unmarried:
11.6% (15)
Women who did not give birth in the past 12 months Now married:
39.8% (796)Unmarried:
60.2% (1,201)
Marital status - Black or African American population 15 years and over
Males 49.5% Never married45.6% Now married0.0% Separated0.0% Widowed4.9% DivorcedFemales 46.8% Never married21.3% Now married4.1% Separated8.2% Widowed19.5% DivorcedWomen who gave birth in the past 12 months Now married:
6.1% (6)Unmarried:
93.9% (86)
Women who did not give birth in the past 12 months Now married:
19.7% (192)Unmarried:
80.3% (780)
Marital status - American Indian / Alaska Native population 15 years and over
Males 100.0% Never married0.0% Now married0.0% Separated0.0% Widowed0.0% DivorcedFemales 0.0% Never married100.0% Now married0.0% Separated0.0% Widowed0.0% DivorcedWomen who did not give birth in the past 12 months Now married:
100.0% (6)Unmarried:
0.0% (0)
Marital status - Asian population 15 years and over
Males 5.4% Never married81.0% Now married0.0% Separated13.6% Widowed0.0% DivorcedFemales 25.1% Never married65.4% Now married0.0% Separated0.6% Widowed8.9% DivorcedWomen who gave birth in the past 12 months Now married:
100.0% (31)Unmarried:
0.0% (0)
Women who did not give birth in the past 12 months Now married:
50.9% (52)Unmarried:
49.1% (50)
Marital status - Other race population 15 years and over
Males 63.7% Never married36.3% Now married0.0% Separated0.0% Widowed0.0% DivorcedFemales 41.8% Never married21.2% Now married7.0% Separated16.9% Widowed13.1% DivorcedWomen who gave birth in the past 12 months Now married:
0.0% (0)Unmarried:
100.0% (20)
Women who did not give birth in the past 12 months Now married:
42.0% (70)Unmarried:
58.0% (97)
Marital status - Two or more races population 15 years and over
Males 32.5% Never married56.0% Now married0.0% Separated0.0% Widowed11.5% DivorcedFemales 43.1% Never married46.5% Now married0.0% Separated5.6% Widowed4.7% DivorcedWomen who did not give birth in the past 12 months Now married:
50.2% (521)Unmarried:
49.8% (517)
Marital status - White alone, not Hispanic / Latino population 15 years and over
Males 27.9% Never married54.8% Now married0.8% Separated4.7% Widowed11.7% DivorcedFemales 21.7% Never married43.8% Now married1.8% Separated17.0% Widowed15.7% DivorcedWomen who gave birth in the past 12 months Now married:
88.4% (116)Unmarried:
11.6% (15)
Women who did not give birth in the past 12 months Now married:
40.7% (771)Unmarried:
59.3% (1,121)
Marital status - Hispanic or Latino population 15 years and over
Males 55.3% Never married44.7% Now married0.0% Separated0.0% Widowed0.0% DivorcedFemales 44.4% Never married32.3% Now married3.4% Separated13.9% Widowed6.1% DivorcedWomen who did not give birth in the past 12 months Now married:
44.0% (286)Unmarried:
56.0% (364)
Ancestries in Goodlettsville
2,356 25.7% English778 8.5% American563 6.1% German410 4.5% European330 3.6% Irish272 3.0% African169 1.8% Dutch133 1.5% Scottish57 0.6% Scotch-Irish37 0.4% Polish30 0.3% Italian23 0.3% Greek22 0.2% Palestinian21 0.2% British20 0.2% Northern European20 0.2% Swedish19 0.2% Lebanese15 0.2% French12 0.1% Egyptian11 0.1% Canadian11 0.1% Swiss10 0.1% Czechoslovakian10 0.1% Norwegian10 0.1% Russian9 0.10% French Canadian9 0.10% British West Indian7 0.08% Iranian6 0.07% Nigerian
Geographical mobility in Goodlettsville Same house 1 year ago 8,596 85.9% White (Caucasian)3,158 87.7% Black or African American6 45.4% American Indian / Alaska Native383 71.1% Asian439 70.4% Other race2,260 83.4% Two or more races8,590 85.4% White alone, not Hispanic / Latino1,230 82.5% Hispanic or LatinoMoved within same county 323 3.2% White / Caucasian147 4.1% Black or African American32 6.0% Asian23 3.8% Other race384 14.2% Two or more races331 3.3% White alone, not Hispanic / Latino40 2.7% Hispanic or LatinoMoved within same state 568 5.7% White / Caucasian96 2.7% Black or African American14 100.0% American Indian / Alaska Native35 6.5% Asian65 10.4% Other race50 1.9% Two or more races559 5.6% White alone, not Hispanic / Latino110 7.4% Hispanic or LatinoMoved from different state 509 5.1% White / Caucasian161 4.5% Black or African American8 1.4% Asian19 3.1% Other race64 2.4% Two or more races535 5.3% White alone, not Hispanic / Latino12 0.8% Hispanic or LatinoMoved from abroad 104 1.0% White7 1.2% Other race56 0.6% White alone, not Hispanic / Latino14 1.0% Hispanic or Latino
Children Nativity (place of birth) in Goodlettsville
Children under 6 years - Living with two parents Both parents native 814 100.0% NativeBoth parents foreign-born 29 100.0% NativeOne native, one foreign-born parent 70 100.0% NativeChildren under 6 years - Living with one parent Native parent 510 100.0% NativeChildren 6 to 17 years - Living with two parents Both parents native 727 100.0% NativeBoth parents foreign-born 85 100.0% NativeOne native, one foreign-born parent 108 100.0% NativeChildren 6 to 17 years - Living with one parent Native parent 639 100.0% NativeForeign-born parent 26 55.1% Native21 44.9% Foreign-born
Grandparents responsible for own grandchildren in Goodlettsville
Grandparents (30 to 59 years) White / Caucasian 129 96.6% Responsible for grandchildren4 3.4% Not responsible for grandchildrenBlack or African American 4 100.0% Not responsible for grandchildrenWhite alone, not Hispanic / Latino 139 100.0% Responsible for grandchildrenHispanic or Latino 11 100.0% Not responsible for grandchildrenGrandparents (60 years and over) White / Caucasian 51 43.4% Responsible for grandchildren66 56.6% Not responsible for grandchildrenBlack or African American 21 23.6% Responsible for grandchildren67 76.4% Not responsible for grandchildrenWhite alone, not Hispanic / Latino 57 43.7% Responsible for grandchildren73 56.3% Not responsible for grandchildren