Races in Greenwood, Indiana (IN) Detailed Stats
Data:
Races - White alone (%)
Races - White alone (% change since 2000)
Races - Black alone (%)
Races - Black alone (% change since 2000)
Races - American Indian alone (%)
Races - American Indian alone (% change since 2000)
Races - Asian alone (%)
Races - Asian alone (% change since 2000)
Races - Hispanic (%)
Races - Hispanic (% change since 2000)
Races - Native Hawaiian and Other Pacific Islander alone (%)
Races - Native Hawaiian and Other Pacific Islander alone (% change since 2000)
Races - Two or more races(%)
Races - Two or more races(% change since 2000)
Races - Other race alone (%)
Races - Other race alone (% change since 2000)
Racial diversity
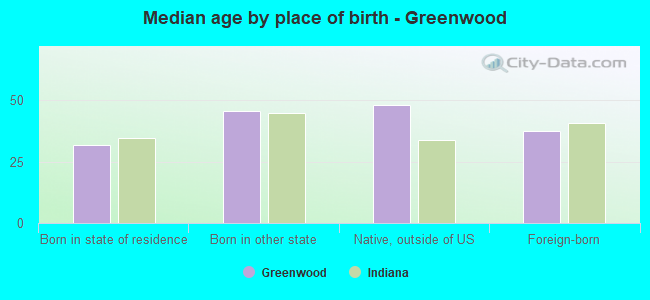
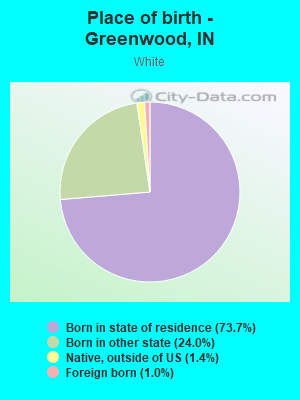
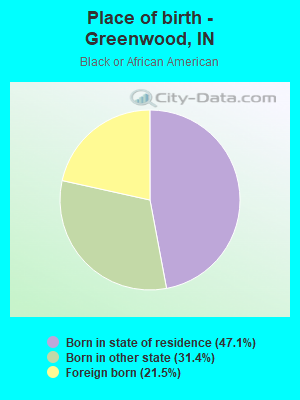
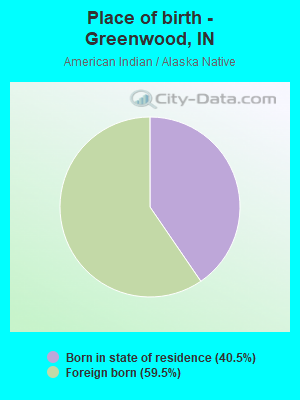
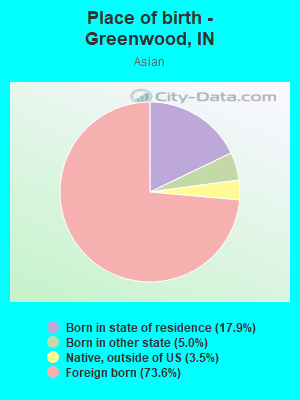
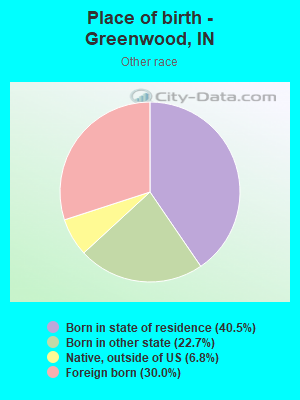
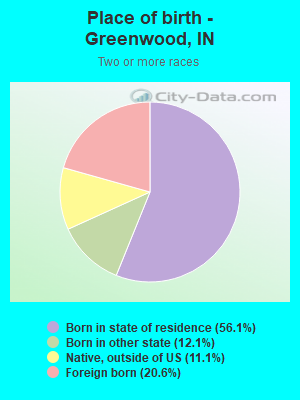
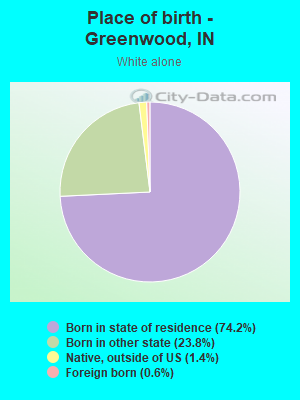
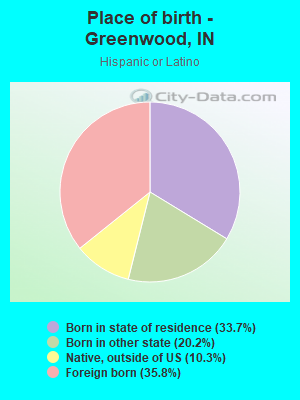
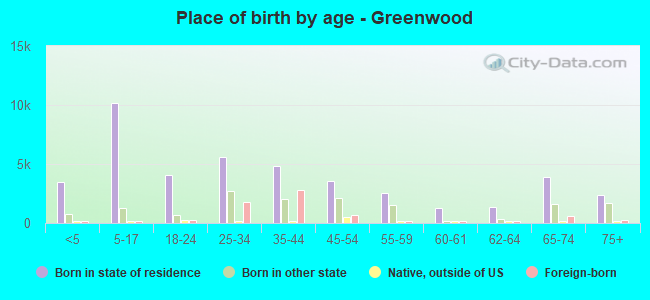
Place of birth - Born in state of residence (%)
Place of birth - Born in state of residence (%) - White
Place of birth - Born in state of residence (%) - Black or African American
Place of birth - Born in state of residence (%) - Asian
Place of birth - Born in state of residence (%) - Hispanic or Latino
Place of birth - Born in state of residence (%) - American Indian and Alaska Native
Place of birth - Born in state of residence (%) - Multirace
Place of birth - Born in state of residence (%) - Other Race
Place of birth - Born in other state (%)
Place of birth - Born in other state (%) - White
Place of birth - Born in other state (%) - Black or African American
Place of birth - Born in other state (%) - Asian
Place of birth - Born in other state (%) - Hispanic or Latino
Place of birth - Born in other state (%) - American Indian and Alaska Native
Place of birth - Born in other state (%) - Multirace
Place of birth - Born in other state (%) - Other Race
Place of birth - Native, outside of US (%)
Place of birth - Native, outside of US (%) - White
Place of birth - Native, outside of US (%) - Black or African American
Place of birth - Native, outside of US (%) - Asian
Place of birth - Native, outside of US (%) - Hispanic or Latino
Place of birth - Native, outside of US (%) - American Indian and Alaska Native
Place of birth - Native, outside of US (%) - Multirace
Place of birth - Native, outside of US (%) - Other Race
Place of birth - Foreign born (%)
Place of birth - Foreign born (%) - White
Place of birth - Foreign born (%) - Black or African American
Place of birth - Foreign born (%) - Asian
Place of birth - Foreign born (%) - Hispanic or Latino
Place of birth - Foreign born (%) - American Indian and Alaska Native
Place of birth - Foreign born (%) - Multirace
Place of birth - Foreign born (%) - Other Race
Residents speaking English at home (%)
Residents speaking English at home - Born in the United States (%)
Residents speaking English at home - Native, born elsewhere (%)
Residents speaking English at home - Foreign born (%)
Residents speaking Spanish at home (%)
Residents speaking Spanish at home - Born in the United States (%)
Residents speaking Spanish at home - Native, born elsewhere (%)
Residents speaking Spanish at home - Foreign born (%)
Residents speaking other language at home (%)
Residents speaking other language at home - Born in the United States (%)
Residents speaking other language at home - Native, born elsewhere (%)
Residents speaking other language at home - Foreign born (%)
Marital status - Never married (%)
Marital status - Now married (%)
Marital status - Separated (%)
Marital status - Widowed (%)
Marital status - Divorced (%)
Ancestries Reported - Arab (%)
Ancestries Reported - Czech (%)
Ancestries Reported - Danish (%)
Ancestries Reported - Dutch (%)
Ancestries Reported - English (%)
Ancestries Reported - French (%)
Ancestries Reported - French Canadian (%)
Ancestries Reported - German (%)
Ancestries Reported - Greek (%)
Ancestries Reported - Hungarian (%)
Ancestries Reported - Irish (%)
Ancestries Reported - Italian (%)
Ancestries Reported - Lithuanian (%)
Ancestries Reported - Norwegian (%)
Ancestries Reported - Polish (%)
Ancestries Reported - Portuguese (%)
Ancestries Reported - Russian (%)
Ancestries Reported - Scotch-Irish (%)
Ancestries Reported - Scottish (%)
Ancestries Reported - Slovak (%)
Ancestries Reported - Subsaharan African (%)
Ancestries Reported - Swedish (%)
Ancestries Reported - Swiss (%)
Ancestries Reported - Ukrainian (%)
Ancestries Reported - United States (%)
Ancestries Reported - Welsh (%)
Ancestries Reported - West Indian (%)
Ancestries Reported - Other (%)
Geographical mobility - Same house 1 year ago (%)
Geographical mobility - Same house 1 year ago (%) - White
Geographical mobility - Same house 1 year ago (%) - Black or African American
Geographical mobility - Same house 1 year ago (%) - Asian
Geographical mobility - Same house 1 year ago (%) - Hispanic or Latino
Geographical mobility - Same house 1 year ago (%) - American Indian and Alaska Native
Geographical mobility - Same house 1 year ago (%) - Multirace
Geographical mobility - Same house 1 year ago (%) - Other Race
Geographical mobility - Moved within same county (%)
Geographical mobility - Moved within same county (%) - White
Geographical mobility - Moved within same county (%) - Black or African American
Geographical mobility - Moved within same county (%) - Asian
Geographical mobility - Moved within same county (%) - Hispanic or Latino
Geographical mobility - Moved within same county (%) - American Indian and Alaska Native
Geographical mobility - Moved within same county (%) - Multirace
Geographical mobility - Moved within same county (%) - Other Race
Geographical mobility - Moved from different county within same state (%)
Geographical mobility - Moved from different county within same state (%) - White
Geographical mobility - Moved from different county within same state (%) - Black or African American
Geographical mobility - Moved from different county within same state (%) - Asian
Geographical mobility - Moved from different county within same state (%) - Hispanic or Latino
Geographical mobility - Moved from different county within same state (%) - American Indian and Alaska Native
Geographical mobility - Moved from different county within same state (%) - Multirace
Geographical mobility - Moved from different county within same state (%) - Other Race
Geographical mobility - Moved from different state (%)
Geographical mobility - Moved from different state (%) - White
Geographical mobility - Moved from different state (%) - Black or African American
Geographical mobility - Moved from different state (%) - Asian
Geographical mobility - Moved from different state (%) - Hispanic or Latino
Geographical mobility - Moved from different state (%) - American Indian and Alaska Native
Geographical mobility - Moved from different state (%) - Multirace
Geographical mobility - Moved from different state (%) - Other Race
Geographical mobility - Moved from abroad (%)
Geographical mobility - Moved from abroad (%) - White
Geographical mobility - Moved from abroad (%) - Black or African American
Geographical mobility - Moved from abroad (%) - Asian
Geographical mobility - Moved from abroad (%) - Hispanic or Latino
Geographical mobility - Moved from abroad (%) - American Indian and Alaska Native
Geographical mobility - Moved from abroad (%) - Multirace
Geographical mobility - Moved from abroad (%) - Other Race
Place of birth for the foreign-born population - Ireland (%)
Place of birth for the foreign-born population - Denmark (%)
Place of birth for the foreign-born population - Norway (%)
Place of birth for the foreign-born population - Sweden (%)
Place of birth for the foreign-born population - United Kingdom (%)
Place of birth for the foreign-born population - England (%)
Place of birth for the foreign-born population - Scotland (%)
Place of birth for the foreign-born population - Other Northern Europe (%)
Place of birth for the foreign-born population - Austria (%)
Place of birth for the foreign-born population - Belgium (%)
Place of birth for the foreign-born population - France (%)
Place of birth for the foreign-born population - Germany (%)
Place of birth for the foreign-born population - Netherlands (%)
Place of birth for the foreign-born population - Switzerland (%)
Place of birth for the foreign-born population - Other Western Europe (%)
Place of birth for the foreign-born population - Greece (%)
Place of birth for the foreign-born population - Italy (%)
Place of birth for the foreign-born population - Portugal (%)
Place of birth for the foreign-born population - Spain (%)
Place of birth for the foreign-born population - Other Southern Europe (%)
Place of birth for the foreign-born population - Albania (%)
Place of birth for the foreign-born population - Belarus (%)
Place of birth for the foreign-born population - Bosnia and Herzegovina (%)
Place of birth for the foreign-born population - Bulgaria (%)
Place of birth for the foreign-born population - Croatia (%)
Place of birth for the foreign-born population - Czechoslovakia (%)
Place of birth for the foreign-born population - Hungary (%)
Place of birth for the foreign-born population - Latvia (%)
Place of birth for the foreign-born population - Lithuania (%)
Place of birth for the foreign-born population - North Macedonia (Macedonia) (%)
Place of birth for the foreign-born population - Moldova (%)
Place of birth for the foreign-born population - Poland (%)
Place of birth for the foreign-born population - Romania (%)
Place of birth for the foreign-born population - Russia (%)
Place of birth for the foreign-born population - Serbia (%)
Place of birth for the foreign-born population - Ukraine (%)
Place of birth for the foreign-born population - Other Eastern Europe (%)
Place of birth for the foreign-born population - China (%)
Place of birth for the foreign-born population - Hong Kong (%)
Place of birth for the foreign-born population - Taiwan (%)
Place of birth for the foreign-born population - Japan (%)
Place of birth for the foreign-born population - Korea (%)
Place of birth for the foreign-born population - Other Eastern Asia (%)
Place of birth for the foreign-born population - Afghanistan (%)
Place of birth for the foreign-born population - Bangladesh (%)
Place of birth for the foreign-born population - India (%)
Place of birth for the foreign-born population - Iran (%)
Place of birth for the foreign-born population - Kazakhstan (%)
Place of birth for the foreign-born population - Nepal (%)
Place of birth for the foreign-born population - Pakistan (%)
Place of birth for the foreign-born population - Sri Lanka (%)
Place of birth for the foreign-born population - Uzbekistan (%)
Place of birth for the foreign-born population - Other South Central Asia (%)
Place of birth for the foreign-born population - Burma (%)
Place of birth for the foreign-born population - Cambodia (%)
Place of birth for the foreign-born population - Indonesia (%)
Place of birth for the foreign-born population - Laos (%)
Place of birth for the foreign-born population - Malaysia (%)
Place of birth for the foreign-born population - Philippines (%)
Place of birth for the foreign-born population - Singapore (%)
Place of birth for the foreign-born population - Thailand (%)
Place of birth for the foreign-born population - Vietnam (%)
Place of birth for the foreign-born population - Other South Eastern Asia (%)
Place of birth for the foreign-born population - Armenia (%)
Place of birth for the foreign-born population - Iraq (%)
Place of birth for the foreign-born population - Israel (%)
Place of birth for the foreign-born population - Jordan (%)
Place of birth for the foreign-born population - Kuwait (%)
Place of birth for the foreign-born population - Lebanon (%)
Place of birth for the foreign-born population - Saudi Arabia (%)
Place of birth for the foreign-born population - Syria (%)
Place of birth for the foreign-born population - Turkey (%)
Place of birth for the foreign-born population - Yemen (%)
Place of birth for the foreign-born population - Other Western Asia (%)
Place of birth for the foreign-born population - Eritrea (%)
Place of birth for the foreign-born population - Ethiopia (%)
Place of birth for the foreign-born population - Kenya (%)
Place of birth for the foreign-born population - Somalia (%)
Place of birth for the foreign-born population - Uganda (%)
Place of birth for the foreign-born population - Zimbabwe (%)
Place of birth for the foreign-born population - Other Eastern Africa (%)
Place of birth for the foreign-born population - Cameroon (%)
Place of birth for the foreign-born population - Congo (%)
Place of birth for the foreign-born population - Democratic Republic of Congo (Zaire) (%)
Place of birth for the foreign-born population - Other Middle Africa (%)
Place of birth for the foreign-born population - Egypt (%)
Place of birth for the foreign-born population - Morocco (%)
Place of birth for the foreign-born population - Sudan (%)
Place of birth for the foreign-born population - Other Northern Africa (%)
Place of birth for the foreign-born population - South Africa (%)
Place of birth for the foreign-born population - Other Southern Africa (%)
Place of birth for the foreign-born population - Cabo Verde (%)
Place of birth for the foreign-born population - Ghana (%)
Place of birth for the foreign-born population - Liberia (%)
Place of birth for the foreign-born population - Nigeria (%)
Place of birth for the foreign-born population - Senegal (%)
Place of birth for the foreign-born population - Sierra Leone (%)
Place of birth for the foreign-born population - Other Western Africa (%)
Place of birth for the foreign-born population - Australia (%)
Place of birth for the foreign-born population - New Zealand (%)
Place of birth for the foreign-born population - Fiji (%)
Place of birth for the foreign-born population - Micronesia (%)
Place of birth for the foreign-born population - Bahamas (%)
Place of birth for the foreign-born population - Barbados (%)
Place of birth for the foreign-born population - Cuba (%)
Place of birth for the foreign-born population - Dominica (%)
Place of birth for the foreign-born population - Dominican Republic (%)
Place of birth for the foreign-born population - Grenada (%)
Place of birth for the foreign-born population - Haiti (%)
Place of birth for the foreign-born population - Jamaica (%)
Place of birth for the foreign-born population - St. Vincent and the Grenadines (%)
Place of birth for the foreign-born population - Trinidad and Tobago (%)
Place of birth for the foreign-born population - West Indies (%)
Place of birth for the foreign-born population - Other Caribbean (%)
Place of birth for the foreign-born population - Belize (%)
Place of birth for the foreign-born population - Costa Rica (%)
Place of birth for the foreign-born population - El Salvador (%)
Place of birth for the foreign-born population - Guatemala (%)
Place of birth for the foreign-born population - Honduras (%)
Place of birth for the foreign-born population - Mexico (%)
Place of birth for the foreign-born population - Nicaragua (%)
Place of birth for the foreign-born population - Panama (%)
Place of birth for the foreign-born population - Other Central America (%)
Place of birth for the foreign-born population - Argentina (%)
Place of birth for the foreign-born population - Bolivia (%)
Place of birth for the foreign-born population - Brazil (%)
Place of birth for the foreign-born population - Chile (%)
Place of birth for the foreign-born population - Colombia (%)
Place of birth for the foreign-born population - Ecuador (%)
Place of birth for the foreign-born population - Guyana (%)
Place of birth for the foreign-born population - Peru (%)
Place of birth for the foreign-born population - Uruguay (%)
Place of birth for the foreign-born population - Venezuela (%)
Place of birth for the foreign-born population - Other South America (%)
Place of birth for the foreign-born population - Canada (%)
Place of birth for the foreign-born population - Other Northern America (%)
Place of birth for the foreign-born population - Other (%)
Latest news about races in Greenwood, IN collected exclusively by city-data.com from local newspapers, TV, and radio stations
According to 2022 data, the most numerous races in Greenwood, IN are White alone (50,041 residents), Black alone (3,126 residents), and Hispanic (4,692 residents). 86.9% of Greenwood residents speak English at home. 8.5% of Greenwood, IN residents are foreign-born (4.7% born in Asia, 2.2% born in Latin America), which is 29.7% greater than the foreign-born rate of 6.0% across the entire state of Indiana.
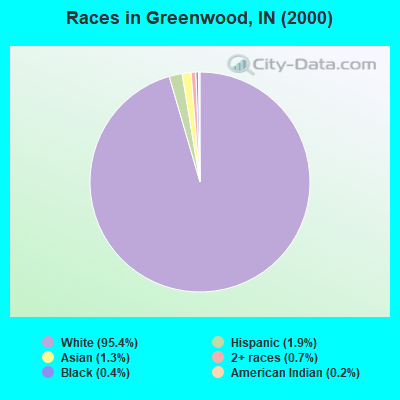
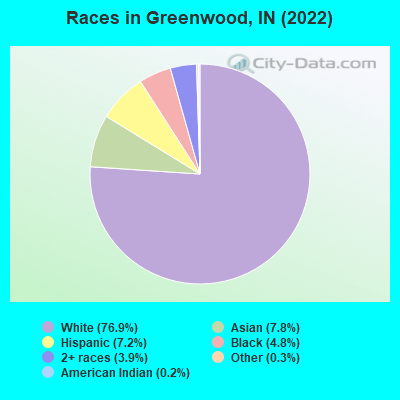
Race distribution in Greenwood
2000 2022
5,219,373 85.8% White alone 505,462 8.3% Black alone 214,536 3.5% Hispanic 61,115 1.0% Two or more races 58,424 1.0% Asian alone 13,654 0.2% American Indian alone 6,348 0.1% Other race alone 1,573 0.03% Native Hawaiian and Other
5,192,455 76.0% White alone 628,054 9.2% Black alone 534,528 7.8% Hispanic 263,242 3.9% Two or more races 172,880 2.5% Asian alone 33,467 0.5% Other race alone 5,866 0.09% American Indian alone 2,545 0.04% Native Hawaiian and Other
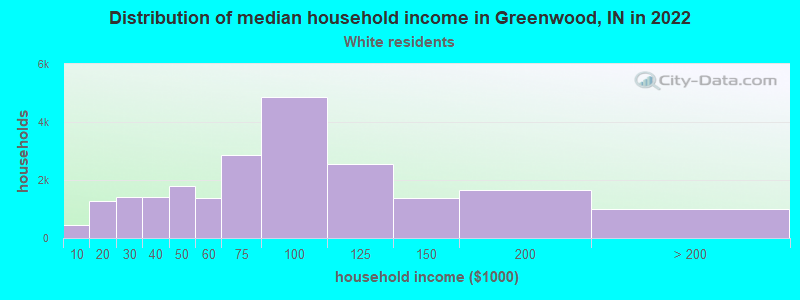
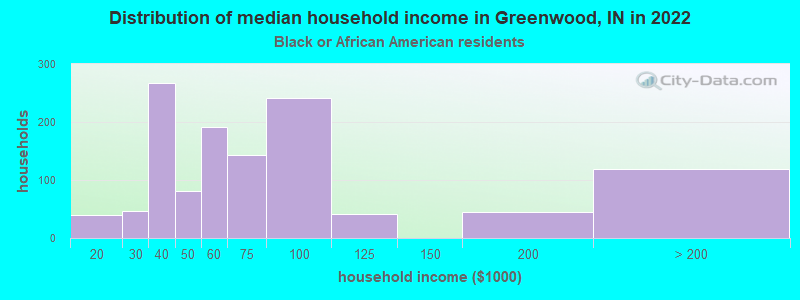
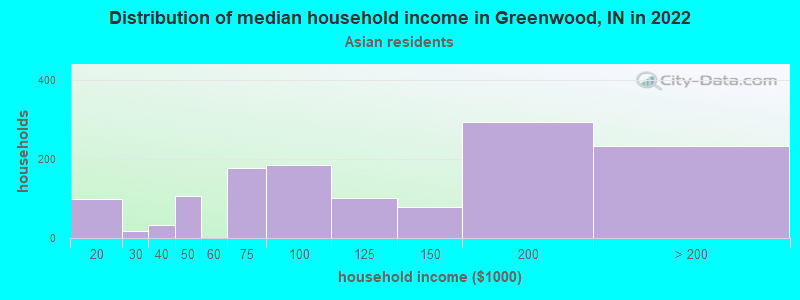
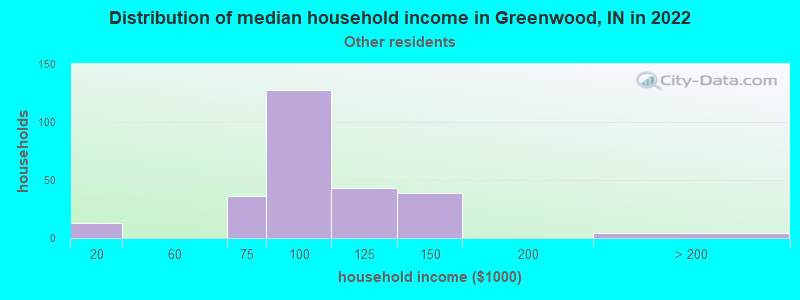
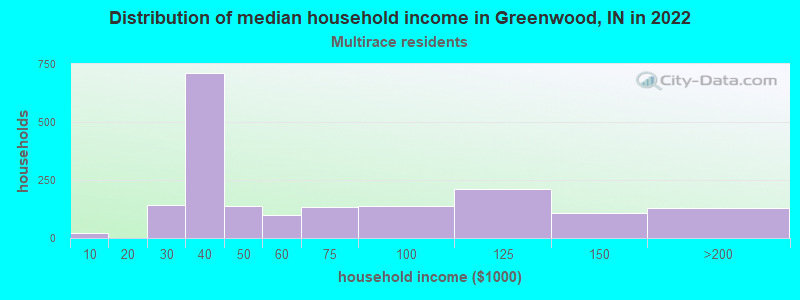
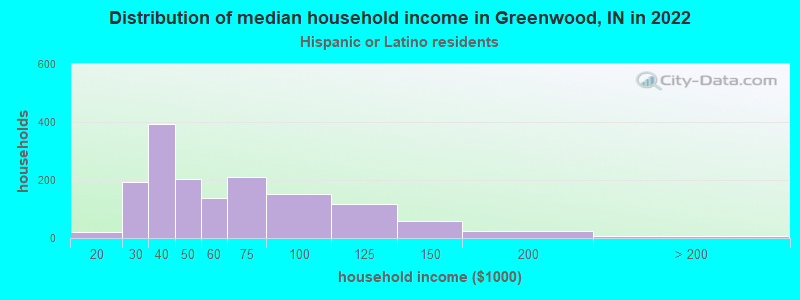
Income and house value in Greenwood Median household income in 2022 $76,698 White non-Hispanic householders$54,379 Black householders$88,349 Asian householders$99,940 Some other race householders$46,634 Two or more races householders$47,554 Hispanic or Latino race householdersMedian 2022 house value $274,634 White Non-Hispanic householders$304,676 Black or African American householders$266,118 American Indian or Alaska Native householders $344,890 Asian householders$325,256 Some other race householders$279,365 Two or more races householders$300,891 Hispanic or Latino householders
Median age by race in Greenwood
37.8 Median age for White residents36.3 38.5 42.4 Median age for Black or African American residents36.2 41.5 30.5 Median age for American Indian / Alaska Native residents-654,255,318.5 24.3 38.3 Median age for Asian residents37.3 39.9 -664,335,663.7 Median age for Native Hawaiian / Pacific Islander residents-644,025,156.6 -666,666,666.0 42.7 Median age for Other race residents49.3 32.1 29.9 Median age for Two or more races residents40.7 16.6 38.5 Median age for White alone residents37.0 39.3 29.8 Median age for Hispanic or Latino residents33.0 23.6
Owner/renter occupied households by race in Greenwood
House owners and renters - White residents 14,161 65.7% Owner occupied7,408 34.3% Renter occupiedHouse owners and renters - Black or African American residents 446 25.1% Owner occupied1,333 74.9% Renter occupiedHouse owners and renters - American Indian / Alaska Native residents 69 100.0% Renter occupiedHouse owners and renters - Asian residents 1,131 88.0% Owner occupied154 12.0% Renter occupiedHouse owners and renters - Other race residents 136 51.7% Owner occupied127 48.3% Renter occupiedHouse owners and renters - Two or more races residents 792 42.3% Owner occupied1,082 57.7% Renter occupiedHouse owners and renters - White alone residents 14,046 66.1% Owner occupied7,219 33.9% Renter occupiedHouse owners and renters - Hispanic or Latino residents 632 44.8% Owner occupied777 55.2% Renter occupied
Language usage in Greenwood
English speakers - Total 86.9% of residents of Greenwood speak English at home.
6.6% of residents speak Spanish at home 2,689 67.2% Speak English very well1,311 32.8% Speak English less than very well7.7% of residents speak other language at home 3,238 69.1% Speak English very well1,451 30.9% Speak English less than very well
English speakers - Born in the United States 91.2% of residents of Greenwood speak English at home.
7.3% of residents speak Spanish at home 866 83.1% Speak English very well176 16.9% Speak English less than very well2.5% of residents speak other language at home 308 85.1% Speak English very well54 14.9% Speak English less than very well
English speakers - Native, born elsewhere 58.4% of residents of Greenwood speak English at home.
32.9% of residents speak Spanish at home 397 88.2% Speak English very well53 11.8% Speak English less than very well12.0% of residents speak other language at home 164 100.0% Speak English very well
English speakers - Foreign-born 17.3% of residents of Greenwood speak English at home.
21.6% of residents speak Spanish at home 555 41.8% Speak English very well774 58.2% Speak English less than very well58.6% of residents speak other language at home 2,557 71.0% Speak English very well1,045 29.0% Speak English less than very well
White (Caucasian) - Speak only English Native:
97.2% (46,152)Foreign-born:
17.4% (86)
White (Caucasian) - Speak another language Native:
3.3% (1,566)Foreign-born:
82.2% (405)
Black or African American - Speak only English Native:
98.5% (2,003)Foreign-born:
20.8% (121)
Black or African American - Speak another language Native:
1.2% (25)Foreign-born:
79.2% (460)
Asian - Speak only English Native:
23.1% (215)Foreign-born:
13.8% (526)
Asian - Speak another language Native:
75.0% (697)Foreign-born:
85.9% (3,274)
Other race - Speak only English Native:
52.1% (357)Foreign-born:
21.0% (64)
Other race - Speak another language Native:
47.8% (328)Foreign-born:
80.9% (246)
Two or more races - Speak only English Native:
71.7% (2,603)Foreign-born:
10.2% (108)
Two or more races - Speak another language Native:
35.0% (1,269)Foreign-born:
72.7% (774)
White alone - Speak only English Native:
98.7% (45,752)Foreign-born:
29.1% (84)
White alone - Speak another language Native:
1.3% (598)Foreign-born:
73.5% (211)
Hispanic or Latino - Speak only English Native:
30.2% (856)Foreign-born:
3.2% (55)
Hispanic or Latino - Speak another language Native:
79.1% (2,239)Foreign-born:
78.4% (1,344)
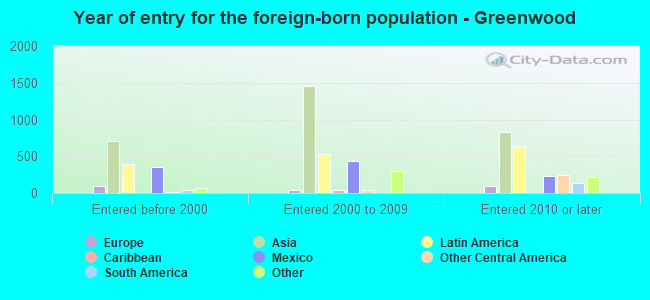
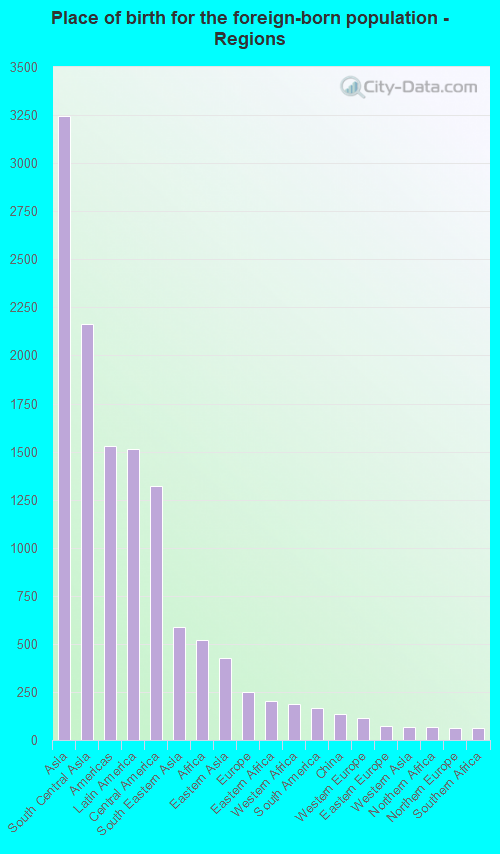
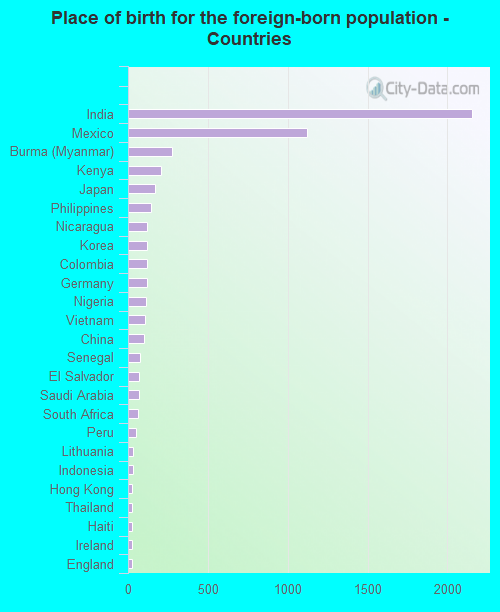
Foreign-born residents in Greenwood 5,551 residents are foreign born (4.7% Asia , 2.2% Latin America ).
This city:
8.5%Indiana:
5.6%
Marital status for residents in Greenwood Marital status - White (Caucasian) population 15 years and over
Males 27.2% Never married56.2% Now married1.0% Separated2.7% Widowed13.0% DivorcedFemales 24.2% Never married50.8% Now married0.2% Separated10.1% Widowed14.6% DivorcedWomen who gave birth in the past 12 months Now married:
56.1% (472)Unmarried:
43.9% (369)
Women who did not give birth in the past 12 months Now married:
46.9% (4,852)Unmarried:
53.1% (5,501)
Marital status - Black or African American population 15 years and over
Males 57.0% Never married19.7% Now married0.0% Separated0.0% Widowed23.2% DivorcedFemales 63.1% Never married4.2% Now married9.1% Separated0.0% Widowed23.6% DivorcedWomen who did not give birth in the past 12 months Now married:
4.6% (43)Unmarried:
95.4% (904)
Marital status - American Indian / Alaska Native population 15 years and over
Males 0.0% Never married41.4% Now married0.0% Separated0.0% Widowed58.6% DivorcedFemales 13.0% Never married49.6% Now married0.0% Separated0.0% Widowed37.4% DivorcedWomen who gave birth in the past 12 months Now married:
100.0% (134)Unmarried:
0.0% (0)
Women who did not give birth in the past 12 months Now married:
0.0% (0)Unmarried:
100.0% (137)
Marital status - Asian population 15 years and over
Males 30.1% Never married67.8% Now married0.6% Separated0.0% Widowed1.5% DivorcedFemales 18.7% Never married72.4% Now married0.0% Separated1.5% Widowed7.4% DivorcedWomen who gave birth in the past 12 months Now married:
100.0% (70)Unmarried:
0.0% (0)
Women who did not give birth in the past 12 months Now married:
70.1% (741)Unmarried:
29.9% (317)
Marital status - Other race population 15 years and over
Males 41.9% Never married58.1% Now married0.0% Separated0.0% Widowed0.0% DivorcedFemales 49.1% Never married48.7% Now married0.0% Separated1.7% Widowed0.6% DivorcedWomen who did not give birth in the past 12 months Now married:
33.1% (144)Unmarried:
66.9% (291)
Marital status - Two or more races population 15 years and over
Males 57.1% Never married33.3% Now married0.0% Separated0.0% Widowed9.6% DivorcedFemales 44.9% Never married41.5% Now married0.0% Separated6.2% Widowed7.4% DivorcedWomen who did not give birth in the past 12 months Now married:
48.6% (540)Unmarried:
51.4% (572)
Marital status - White alone, not Hispanic / Latino population 15 years and over
Males 27.4% Never married56.2% Now married1.0% Separated2.7% Widowed12.7% DivorcedFemales 23.9% Never married50.6% Now married0.2% Separated10.4% Widowed14.9% DivorcedWomen who gave birth in the past 12 months Now married:
56.1% (474)Unmarried:
43.9% (370)
Women who did not give birth in the past 12 months Now married:
46.0% (4,621)Unmarried:
54.0% (5,426)
Marital status - Hispanic or Latino population 15 years and over
Males 46.7% Never married43.7% Now married0.0% Separated0.0% Widowed9.7% DivorcedFemales 39.5% Never married52.9% Now married0.0% Separated0.7% Widowed7.0% DivorcedWomen who did not give birth in the past 12 months Now married:
51.8% (619)Unmarried:
48.2% (576)
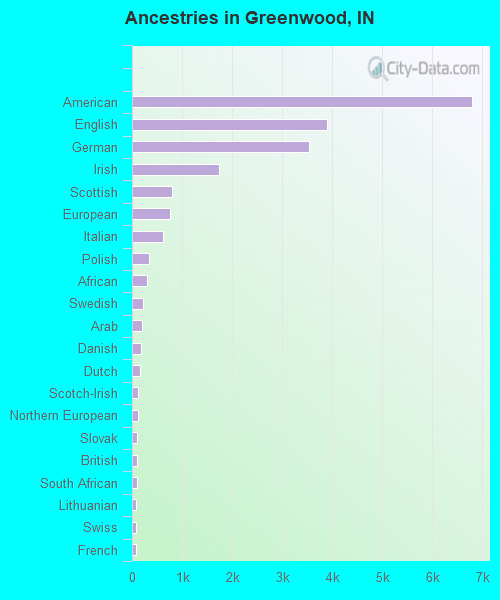
Ancestries in Greenwood
6,795 24.2% American3,902 13.9% English3,528 12.5% German1,740 6.2% Irish796 2.8% Scottish765 2.7% European617 2.2% Italian332 1.2% Polish293 1.0% African211 0.8% Swedish209 0.7% Arab184 0.7% Danish160 0.6% Dutch121 0.4% Scotch-Irish111 0.4% Northern European101 0.4% Slovak96 0.3% British91 0.3% South African86 0.3% Lithuanian78 0.3% Swiss70 0.2% French53 0.2% Welsh49 0.2% Ukrainian46 0.2% Haitian27 0.10% French Canadian26 0.09% Romanian22 0.08% Norwegian21 0.07% Croatian15 0.05% Belgian15 0.05% Hungarian12 0.04% Finnish10 0.04% Czechoslovakian8 0.03% Greek7 0.02% Eastern European6 0.02% Bulgarian
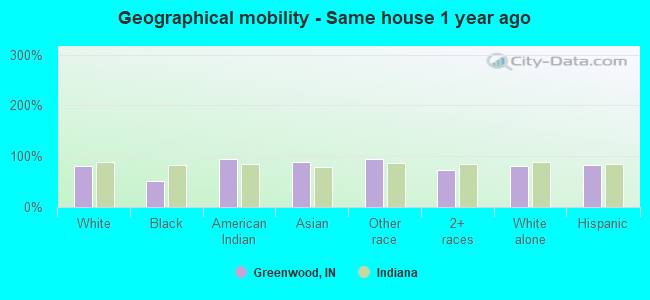
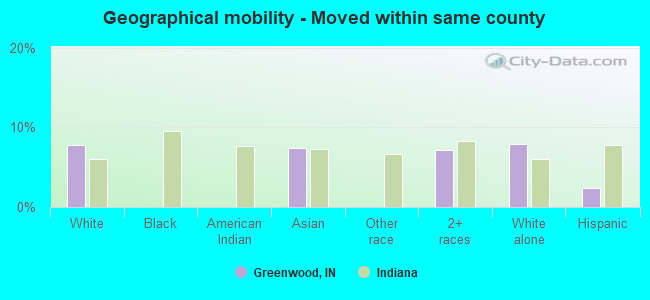
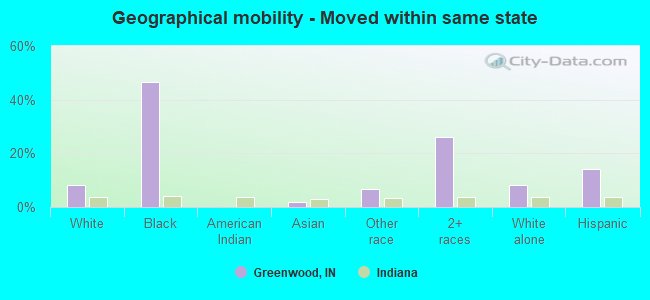
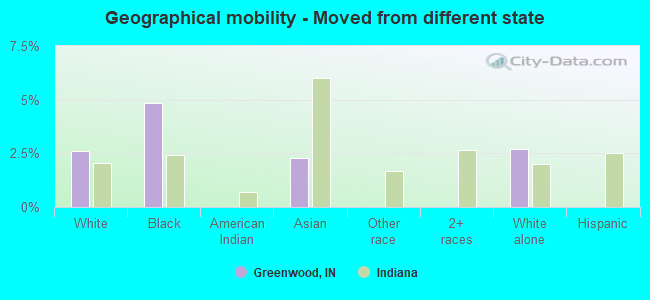
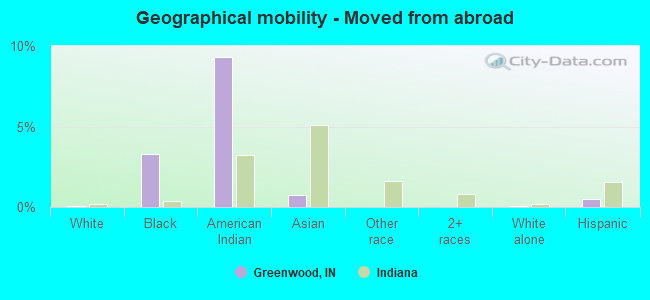
Geographical mobility in Greenwood Same house 1 year ago 41,301 81.3% White (Caucasian)1,331 51.9% Black or African American254 94.7% American Indian / Alaska Native4,478 88.4% Asian966 94.7% Other race3,554 72.2% Two or more races40,038 81.2% White alone, not Hispanic / Latino3,713 82.0% Hispanic or LatinoMoved within same county 3,932 7.7% White / Caucasian372 7.3% Asian350 7.1% Two or more races3,924 8.0% White alone, not Hispanic / Latino110 2.4% Hispanic or LatinoMoved within same state 4,198 8.3% White / Caucasian1,196 46.6% Black or African American94 1.8% Asian68 6.7% Other race1,292 26.2% Two or more races4,072 8.3% White alone, not Hispanic / Latino636 14.0% Hispanic or LatinoMoved from different state 1,329 2.6% White / Caucasian124 4.8% Black or African American115 2.3% Asian1,329 2.7% White alone, not Hispanic / LatinoMoved from abroad 41 0.1% White84 3.3% Black or African American25 9.3% American Indian / Alaska Native36 0.7% Asian41 0.1% White alone, not Hispanic / Latino23 0.5% Hispanic or Latino
Children Nativity (place of birth) in Greenwood
Children under 6 years - Living with two parents Both parents native 2,780 100.0% NativeBoth parents foreign-born 664 100.0% NativeOne native, one foreign-born parent 55 100.0% NativeChildren under 6 years - Living with one parent Native parent 1,044 100.0% NativeForeign-born parent 176 100.0% NativeChildren 6 to 17 years - Living with two parents Both parents native 6,411 99.7% Native19 0.3% Foreign-bornBoth parents foreign-born 1,464 87.6% Native208 12.4% Foreign-bornOne native, one foreign-born parent 238 97.2% Native7 2.8% Foreign-bornChildren 6 to 17 years - Living with one parent Native parent 1,357 100.0% NativeForeign-born parent 297 50.0% Native297 50.0% Foreign-born
Grandparents responsible for own grandchildren in Greenwood
Grandparents (30 to 59 years) White / Caucasian 119 16.9% Responsible for grandchildren585 83.1% Not responsible for grandchildrenAmerican Indian / Alaska Native 18 100.0% Not responsible for grandchildrenWhite alone, not Hispanic / Latino 119 16.9% Responsible for grandchildren585 83.1% Not responsible for grandchildrenHispanic or Latino 14 100.0% Not responsible for grandchildrenGrandparents (60 years and over) White / Caucasian 206 67.3% Responsible for grandchildren100 32.7% Not responsible for grandchildrenWhite alone, not Hispanic / Latino 206 67.3% Responsible for grandchildren100 32.7% Not responsible for grandchildrenHispanic or Latino 23 100.0% Responsible for grandchildren