Races in Hacienda Heights, California (CA) Detailed Stats
Data:
Races - White alone (%)
Races - White alone (% change since 2000)
Races - Black alone (%)
Races - Black alone (% change since 2000)
Races - American Indian alone (%)
Races - American Indian alone (% change since 2000)
Races - Asian alone (%)
Races - Asian alone (% change since 2000)
Races - Hispanic (%)
Races - Hispanic (% change since 2000)
Races - Native Hawaiian and Other Pacific Islander alone (%)
Races - Native Hawaiian and Other Pacific Islander alone (% change since 2000)
Races - Two or more races(%)
Races - Two or more races(% change since 2000)
Races - Other race alone (%)
Races - Other race alone (% change since 2000)
Racial diversity
Place of birth - Born in state of residence (%)
Place of birth - Born in state of residence (%) - White
Place of birth - Born in state of residence (%) - Black or African American
Place of birth - Born in state of residence (%) - Asian
Place of birth - Born in state of residence (%) - Hispanic or Latino
Place of birth - Born in state of residence (%) - American Indian and Alaska Native
Place of birth - Born in state of residence (%) - Multirace
Place of birth - Born in state of residence (%) - Other Race
Place of birth - Born in other state (%)
Place of birth - Born in other state (%) - White
Place of birth - Born in other state (%) - Black or African American
Place of birth - Born in other state (%) - Asian
Place of birth - Born in other state (%) - Hispanic or Latino
Place of birth - Born in other state (%) - American Indian and Alaska Native
Place of birth - Born in other state (%) - Multirace
Place of birth - Born in other state (%) - Other Race
Place of birth - Native, outside of US (%)
Place of birth - Native, outside of US (%) - White
Place of birth - Native, outside of US (%) - Black or African American
Place of birth - Native, outside of US (%) - Asian
Place of birth - Native, outside of US (%) - Hispanic or Latino
Place of birth - Native, outside of US (%) - American Indian and Alaska Native
Place of birth - Native, outside of US (%) - Multirace
Place of birth - Native, outside of US (%) - Other Race
Place of birth - Foreign born (%)
Place of birth - Foreign born (%) - White
Place of birth - Foreign born (%) - Black or African American
Place of birth - Foreign born (%) - Asian
Place of birth - Foreign born (%) - Hispanic or Latino
Place of birth - Foreign born (%) - American Indian and Alaska Native
Place of birth - Foreign born (%) - Multirace
Place of birth - Foreign born (%) - Other Race
Residents speaking English at home (%)
Residents speaking English at home - Born in the United States (%)
Residents speaking English at home - Native, born elsewhere (%)
Residents speaking English at home - Foreign born (%)
Residents speaking Spanish at home (%)
Residents speaking Spanish at home - Born in the United States (%)
Residents speaking Spanish at home - Native, born elsewhere (%)
Residents speaking Spanish at home - Foreign born (%)
Residents speaking other language at home (%)
Residents speaking other language at home - Born in the United States (%)
Residents speaking other language at home - Native, born elsewhere (%)
Residents speaking other language at home - Foreign born (%)
Marital status - Never married (%)
Marital status - Now married (%)
Marital status - Separated (%)
Marital status - Widowed (%)
Marital status - Divorced (%)
Ancestries Reported - Arab (%)
Ancestries Reported - Czech (%)
Ancestries Reported - Danish (%)
Ancestries Reported - Dutch (%)
Ancestries Reported - English (%)
Ancestries Reported - French (%)
Ancestries Reported - French Canadian (%)
Ancestries Reported - German (%)
Ancestries Reported - Greek (%)
Ancestries Reported - Hungarian (%)
Ancestries Reported - Irish (%)
Ancestries Reported - Italian (%)
Ancestries Reported - Lithuanian (%)
Ancestries Reported - Norwegian (%)
Ancestries Reported - Polish (%)
Ancestries Reported - Portuguese (%)
Ancestries Reported - Russian (%)
Ancestries Reported - Scotch-Irish (%)
Ancestries Reported - Scottish (%)
Ancestries Reported - Slovak (%)
Ancestries Reported - Subsaharan African (%)
Ancestries Reported - Swedish (%)
Ancestries Reported - Swiss (%)
Ancestries Reported - Ukrainian (%)
Ancestries Reported - United States (%)
Ancestries Reported - Welsh (%)
Ancestries Reported - West Indian (%)
Ancestries Reported - Other (%)
Geographical mobility - Same house 1 year ago (%)
Geographical mobility - Same house 1 year ago (%) - White
Geographical mobility - Same house 1 year ago (%) - Black or African American
Geographical mobility - Same house 1 year ago (%) - Asian
Geographical mobility - Same house 1 year ago (%) - Hispanic or Latino
Geographical mobility - Same house 1 year ago (%) - American Indian and Alaska Native
Geographical mobility - Same house 1 year ago (%) - Multirace
Geographical mobility - Same house 1 year ago (%) - Other Race
Geographical mobility - Moved within same county (%)
Geographical mobility - Moved within same county (%) - White
Geographical mobility - Moved within same county (%) - Black or African American
Geographical mobility - Moved within same county (%) - Asian
Geographical mobility - Moved within same county (%) - Hispanic or Latino
Geographical mobility - Moved within same county (%) - American Indian and Alaska Native
Geographical mobility - Moved within same county (%) - Multirace
Geographical mobility - Moved within same county (%) - Other Race
Geographical mobility - Moved from different county within same state (%)
Geographical mobility - Moved from different county within same state (%) - White
Geographical mobility - Moved from different county within same state (%) - Black or African American
Geographical mobility - Moved from different county within same state (%) - Asian
Geographical mobility - Moved from different county within same state (%) - Hispanic or Latino
Geographical mobility - Moved from different county within same state (%) - American Indian and Alaska Native
Geographical mobility - Moved from different county within same state (%) - Multirace
Geographical mobility - Moved from different county within same state (%) - Other Race
Geographical mobility - Moved from different state (%)
Geographical mobility - Moved from different state (%) - White
Geographical mobility - Moved from different state (%) - Black or African American
Geographical mobility - Moved from different state (%) - Asian
Geographical mobility - Moved from different state (%) - Hispanic or Latino
Geographical mobility - Moved from different state (%) - American Indian and Alaska Native
Geographical mobility - Moved from different state (%) - Multirace
Geographical mobility - Moved from different state (%) - Other Race
Geographical mobility - Moved from abroad (%)
Geographical mobility - Moved from abroad (%) - White
Geographical mobility - Moved from abroad (%) - Black or African American
Geographical mobility - Moved from abroad (%) - Asian
Geographical mobility - Moved from abroad (%) - Hispanic or Latino
Geographical mobility - Moved from abroad (%) - American Indian and Alaska Native
Geographical mobility - Moved from abroad (%) - Multirace
Geographical mobility - Moved from abroad (%) - Other Race
Place of birth for the foreign-born population - Ireland (%)
Place of birth for the foreign-born population - Denmark (%)
Place of birth for the foreign-born population - Norway (%)
Place of birth for the foreign-born population - Sweden (%)
Place of birth for the foreign-born population - United Kingdom (%)
Place of birth for the foreign-born population - England (%)
Place of birth for the foreign-born population - Scotland (%)
Place of birth for the foreign-born population - Other Northern Europe (%)
Place of birth for the foreign-born population - Austria (%)
Place of birth for the foreign-born population - Belgium (%)
Place of birth for the foreign-born population - France (%)
Place of birth for the foreign-born population - Germany (%)
Place of birth for the foreign-born population - Netherlands (%)
Place of birth for the foreign-born population - Switzerland (%)
Place of birth for the foreign-born population - Other Western Europe (%)
Place of birth for the foreign-born population - Greece (%)
Place of birth for the foreign-born population - Italy (%)
Place of birth for the foreign-born population - Portugal (%)
Place of birth for the foreign-born population - Spain (%)
Place of birth for the foreign-born population - Other Southern Europe (%)
Place of birth for the foreign-born population - Albania (%)
Place of birth for the foreign-born population - Belarus (%)
Place of birth for the foreign-born population - Bosnia and Herzegovina (%)
Place of birth for the foreign-born population - Bulgaria (%)
Place of birth for the foreign-born population - Croatia (%)
Place of birth for the foreign-born population - Czechoslovakia (%)
Place of birth for the foreign-born population - Hungary (%)
Place of birth for the foreign-born population - Latvia (%)
Place of birth for the foreign-born population - Lithuania (%)
Place of birth for the foreign-born population - North Macedonia (Macedonia) (%)
Place of birth for the foreign-born population - Moldova (%)
Place of birth for the foreign-born population - Poland (%)
Place of birth for the foreign-born population - Romania (%)
Place of birth for the foreign-born population - Russia (%)
Place of birth for the foreign-born population - Serbia (%)
Place of birth for the foreign-born population - Ukraine (%)
Place of birth for the foreign-born population - Other Eastern Europe (%)
Place of birth for the foreign-born population - China (%)
Place of birth for the foreign-born population - Hong Kong (%)
Place of birth for the foreign-born population - Taiwan (%)
Place of birth for the foreign-born population - Japan (%)
Place of birth for the foreign-born population - Korea (%)
Place of birth for the foreign-born population - Other Eastern Asia (%)
Place of birth for the foreign-born population - Afghanistan (%)
Place of birth for the foreign-born population - Bangladesh (%)
Place of birth for the foreign-born population - India (%)
Place of birth for the foreign-born population - Iran (%)
Place of birth for the foreign-born population - Kazakhstan (%)
Place of birth for the foreign-born population - Nepal (%)
Place of birth for the foreign-born population - Pakistan (%)
Place of birth for the foreign-born population - Sri Lanka (%)
Place of birth for the foreign-born population - Uzbekistan (%)
Place of birth for the foreign-born population - Other South Central Asia (%)
Place of birth for the foreign-born population - Burma (%)
Place of birth for the foreign-born population - Cambodia (%)
Place of birth for the foreign-born population - Indonesia (%)
Place of birth for the foreign-born population - Laos (%)
Place of birth for the foreign-born population - Malaysia (%)
Place of birth for the foreign-born population - Philippines (%)
Place of birth for the foreign-born population - Singapore (%)
Place of birth for the foreign-born population - Thailand (%)
Place of birth for the foreign-born population - Vietnam (%)
Place of birth for the foreign-born population - Other South Eastern Asia (%)
Place of birth for the foreign-born population - Armenia (%)
Place of birth for the foreign-born population - Iraq (%)
Place of birth for the foreign-born population - Israel (%)
Place of birth for the foreign-born population - Jordan (%)
Place of birth for the foreign-born population - Kuwait (%)
Place of birth for the foreign-born population - Lebanon (%)
Place of birth for the foreign-born population - Saudi Arabia (%)
Place of birth for the foreign-born population - Syria (%)
Place of birth for the foreign-born population - Turkey (%)
Place of birth for the foreign-born population - Yemen (%)
Place of birth for the foreign-born population - Other Western Asia (%)
Place of birth for the foreign-born population - Eritrea (%)
Place of birth for the foreign-born population - Ethiopia (%)
Place of birth for the foreign-born population - Kenya (%)
Place of birth for the foreign-born population - Somalia (%)
Place of birth for the foreign-born population - Uganda (%)
Place of birth for the foreign-born population - Zimbabwe (%)
Place of birth for the foreign-born population - Other Eastern Africa (%)
Place of birth for the foreign-born population - Cameroon (%)
Place of birth for the foreign-born population - Congo (%)
Place of birth for the foreign-born population - Democratic Republic of Congo (Zaire) (%)
Place of birth for the foreign-born population - Other Middle Africa (%)
Place of birth for the foreign-born population - Egypt (%)
Place of birth for the foreign-born population - Morocco (%)
Place of birth for the foreign-born population - Sudan (%)
Place of birth for the foreign-born population - Other Northern Africa (%)
Place of birth for the foreign-born population - South Africa (%)
Place of birth for the foreign-born population - Other Southern Africa (%)
Place of birth for the foreign-born population - Cabo Verde (%)
Place of birth for the foreign-born population - Ghana (%)
Place of birth for the foreign-born population - Liberia (%)
Place of birth for the foreign-born population - Nigeria (%)
Place of birth for the foreign-born population - Senegal (%)
Place of birth for the foreign-born population - Sierra Leone (%)
Place of birth for the foreign-born population - Other Western Africa (%)
Place of birth for the foreign-born population - Australia (%)
Place of birth for the foreign-born population - New Zealand (%)
Place of birth for the foreign-born population - Fiji (%)
Place of birth for the foreign-born population - Micronesia (%)
Place of birth for the foreign-born population - Bahamas (%)
Place of birth for the foreign-born population - Barbados (%)
Place of birth for the foreign-born population - Cuba (%)
Place of birth for the foreign-born population - Dominica (%)
Place of birth for the foreign-born population - Dominican Republic (%)
Place of birth for the foreign-born population - Grenada (%)
Place of birth for the foreign-born population - Haiti (%)
Place of birth for the foreign-born population - Jamaica (%)
Place of birth for the foreign-born population - St. Vincent and the Grenadines (%)
Place of birth for the foreign-born population - Trinidad and Tobago (%)
Place of birth for the foreign-born population - West Indies (%)
Place of birth for the foreign-born population - Other Caribbean (%)
Place of birth for the foreign-born population - Belize (%)
Place of birth for the foreign-born population - Costa Rica (%)
Place of birth for the foreign-born population - El Salvador (%)
Place of birth for the foreign-born population - Guatemala (%)
Place of birth for the foreign-born population - Honduras (%)
Place of birth for the foreign-born population - Mexico (%)
Place of birth for the foreign-born population - Nicaragua (%)
Place of birth for the foreign-born population - Panama (%)
Place of birth for the foreign-born population - Other Central America (%)
Place of birth for the foreign-born population - Argentina (%)
Place of birth for the foreign-born population - Bolivia (%)
Place of birth for the foreign-born population - Brazil (%)
Place of birth for the foreign-born population - Chile (%)
Place of birth for the foreign-born population - Colombia (%)
Place of birth for the foreign-born population - Ecuador (%)
Place of birth for the foreign-born population - Guyana (%)
Place of birth for the foreign-born population - Peru (%)
Place of birth for the foreign-born population - Uruguay (%)
Place of birth for the foreign-born population - Venezuela (%)
Place of birth for the foreign-born population - Other South America (%)
Place of birth for the foreign-born population - Canada (%)
Place of birth for the foreign-born population - Other Northern America (%)
Place of birth for the foreign-born population - Other (%)
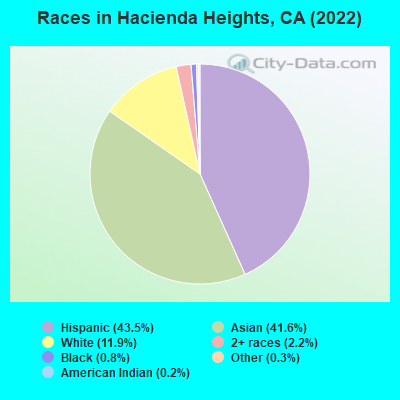
According to 2022 data, the most numerous races in Hacienda Heights, CA are Hispanic (25,568 residents), White alone (6,143 residents), and Asian alone (23,104 residents). 35.8% of Hacienda Heights residents speak English at home. 41.1% of Hacienda Heights, CA residents are foreign-born (28.6% born in Asia, 11.0% born in Latin America), which is 36.7% greater than the foreign-born rate of 26.0% across the entire state of California.
Race distribution in Hacienda Heights
2000 2022
15,816,790 46.7% White alone 10,966,556 32.4% Hispanic 3,648,860 10.8% Asian alone 2,181,926 6.4% Black alone 903,115 2.7% Two or more races 178,984 0.5% American Indian alone 103,736 0.3% Native Hawaiian and Other 71,681 0.2% Other race alone
15,732,184 40.3% Hispanic 13,160,426 33.7% White alone 5,957,867 15.3% Asian alone 2,025,218 5.2% Black alone 1,663,222 4.3% Two or more races 251,618 0.6% Other race alone 135,777 0.3% Native Hawaiian and Other 103,030 0.3% American Indian alone
Income and house value in Hacienda Heights Median household income in 2022 $96,857 White non-Hispanic householders$116,389 Black householders$141,970 American Indian and Alaska Native householders$100,211 Asian householders$75,282 Native Hawaiian and other Pacific Islander householders$131,388 Some other race householders$79,278 Two or more races householders$142,088 Hispanic or Latino race householdersMedian 2022 house value $883,627 White Non-Hispanic householders$822,799 Black or African American householders$600,002 American Indian or Alaska Native householders $899,464 Asian householders$674,868 Native Hawaiian and other Pacific Islander householders$645,353 Some other race householders$727,777 Two or more races householders$684,586 Hispanic or Latino householders
Median age by race in Hacienda Heights
46.4 Median age for White residents44.7 47.9 53.3 Median age for Black or African American residents53.1 58.0 37.8 Median age for American Indian / Alaska Native residents36.7 38.7 49.9 Median age for Asian residents47.2 52.1 74.3 Median age for Native Hawaiian / Pacific Islander residents32.3 Median age for Other race residents29.9 38.4 28.0 Median age for Two or more races residents26.8 38.7 59.1 Median age for White alone residents58.8 59.9 35.2 Median age for Hispanic or Latino residents30.4 39.8
Owner/renter occupied households by race in Hacienda Heights
House owners and renters - White residents 4,317 79.9% Owner occupied1,085 20.1% Renter occupiedHouse owners and renters - Black or African American residents 175 82.6% Owner occupied37 17.4% Renter occupiedHouse owners and renters - American Indian / Alaska Native residents 134 84.4% Owner occupied25 15.6% Renter occupiedHouse owners and renters - Asian residents 6,354 77.8% Owner occupied1,812 22.2% Renter occupiedHouse owners and renters - Native Hawaiian / Pacific Islander residents 8 65.0% Owner occupied4 35.0% Renter occupiedHouse owners and renters - Other race residents 1,597 61.0% Owner occupied1,021 39.0% Renter occupiedHouse owners and renters - Two or more races residents 821 74.7% Owner occupied278 25.3% Renter occupiedHouse owners and renters - White alone residents 2,133 83.3% Owner occupied427 16.7% Renter occupiedHouse owners and renters - Hispanic or Latino residents 4,507 70.3% Owner occupied1,906 29.7% Renter occupied
Language usage in Hacienda Heights
English speakers - Total 35.8% of residents of Hacienda Heights speak English at home.
28.1% of residents speak Spanish at home 10,776 72.7% Speak English very well4,052 27.3% Speak English less than very well36.1% of residents speak other language at home 7,622 40.1% Speak English very well11,370 59.9% Speak English less than very well
English speakers - Born in the United States 80.8% of residents of Hacienda Heights speak English at home.
9.4% of residents speak Spanish at home 300 93.2% Speak English very well22 6.8% Speak English less than very well10.4% of residents speak other language at home 276 77.5% Speak English very well80 22.5% Speak English less than very well
English speakers - Native, born elsewhere 34.9% of residents of Hacienda Heights speak English at home.
33.2% of residents speak Spanish at home 144 72.7% Speak English very well54 27.3% Speak English less than very well31.2% of residents speak other language at home 135 72.6% Speak English very well51 27.4% Speak English less than very well
English speakers - Foreign-born 5.7% of residents of Hacienda Heights speak English at home.
24.9% of residents speak Spanish at home 2,559 46.5% Speak English very well2,944 53.5% Speak English less than very well69.6% of residents speak other language at home 4,719 30.7% Speak English very well10,670 69.3% Speak English less than very well
White (Caucasian) - Speak only English Native:
71.0% (9,558)Foreign-born:
11.7% (280)
White (Caucasian) - Speak another language Native:
25.0% (3,362)Foreign-born:
86.4% (2,070)
Black or African American - Speak only English Native:
96.0% (509)Foreign-born:
49.8% (31)
Black or African American - Speak another language Native:
3.6% (19)Foreign-born:
46.7% (29)
American Indian / Alaska Native - Speak another language Native:
63.7% (235)Foreign-born:
99.6% (55)
Asian - Speak only English Native:
44.5% (2,755)Foreign-born:
4.8% (767)
Asian - Speak another language Native:
54.6% (3,383)Foreign-born:
94.5% (15,045)
Other race - Speak only English Native:
48.3% (3,957)Foreign-born:
5.2% (143)
Other race - Speak another language Native:
54.2% (4,438)Foreign-born:
94.7% (2,588)
Two or more races - Speak only English Native:
53.4% (1,496)Foreign-born:
1.3% (20)
Two or more races - Speak another language Native:
66.3% (1,859)Foreign-born:
100.0% (1,551)
White alone - Speak only English Native:
93.4% (5,126)Foreign-born:
29.2% (121)
White alone - Speak another language Native:
6.6% (364)Foreign-born:
70.6% (294)
Hispanic or Latino - Speak only English Native:
52.1% (9,941)Foreign-born:
6.5% (374)
Hispanic or Latino - Speak another language Native:
48.9% (9,313)Foreign-born:
93.6% (5,367)
Foreign-born residents in Hacienda Heights 22,609 residents are foreign born (28.6% Asia , 11.0% Latin America ).
This city:
41.1%California:
100.0%
Marital status for residents in Hacienda Heights Marital status - White (Caucasian) population 15 years and over
Males 40.9% Never married48.6% Now married1.1% Separated3.1% Widowed6.2% DivorcedFemales 32.0% Never married45.8% Now married2.6% Separated10.3% Widowed9.4% DivorcedWomen who gave birth in the past 12 months Now married:
71.1% (121)Unmarried:
28.9% (49)
Women who did not give birth in the past 12 months Now married:
37.0% (1,176)Unmarried:
63.0% (2,002)
Marital status - Black or African American population 15 years and over
Males 57.4% Never married26.5% Now married0.0% Separated3.9% Widowed12.3% DivorcedFemales 46.5% Never married33.9% Now married0.0% Separated13.8% Widowed5.9% DivorcedWomen who gave birth in the past 12 months Now married:
0.0% (0)Unmarried:
92.4% (1)
Women who did not give birth in the past 12 months Now married:
0.0% (0)Unmarried:
100.0% (104)
Marital status - American Indian / Alaska Native population 15 years and over
Males 18.2% Never married74.4% Now married0.0% Separated0.0% Widowed7.4% DivorcedFemales 25.3% Never married63.3% Now married0.0% Separated3.6% Widowed7.8% DivorcedWomen who gave birth in the past 12 months Now married:
100.0% (50)Unmarried:
0.0% (0)
Women who did not give birth in the past 12 months Now married:
47.9% (51)Unmarried:
52.1% (55)
Marital status - Asian population 15 years and over
Males 29.0% Never married63.6% Now married0.8% Separated2.7% Widowed3.8% DivorcedFemales 21.2% Never married60.5% Now married1.1% Separated9.9% Widowed7.3% DivorcedWomen who gave birth in the past 12 months Now married:
87.6% (190)Unmarried:
12.4% (27)
Women who did not give birth in the past 12 months Now married:
51.4% (2,186)Unmarried:
48.6% (2,064)
Marital status - Native Hawaiian / Pacific Islander population 15 years and over
Males 71.4% Never married0.0% Now married0.0% Separated0.0% Widowed28.6% DivorcedFemales 20.4% Never married0.0% Now married0.0% Separated68.5% Widowed11.1% DivorcedWomen who did not give birth in the past 12 months Now married:
0.0% (0)Unmarried:
100.0% (11)
Marital status - Other race population 15 years and over
Males 49.1% Never married42.5% Now married1.6% Separated2.1% Widowed4.6% DivorcedFemales 34.7% Never married47.8% Now married2.8% Separated6.4% Widowed8.4% DivorcedWomen who gave birth in the past 12 months Now married:
100.0% (45)Unmarried:
0.0% (0)
Women who did not give birth in the past 12 months Now married:
51.7% (1,455)Unmarried:
48.3% (1,358)
Marital status - Two or more races population 15 years and over
Males 55.2% Never married33.4% Now married2.9% Separated0.0% Widowed8.5% DivorcedFemales 39.0% Never married41.6% Now married0.0% Separated16.7% Widowed2.7% DivorcedWomen who gave birth in the past 12 months Now married:
0.0% (0)Unmarried:
100.0% (12)
Women who did not give birth in the past 12 months Now married:
31.5% (221)Unmarried:
68.5% (479)
Marital status - White alone, not Hispanic / Latino population 15 years and over
Males 26.3% Never married58.1% Now married0.5% Separated5.2% Widowed9.9% DivorcedFemales 18.8% Never married52.2% Now married0.9% Separated16.4% Widowed11.8% DivorcedWomen who gave birth in the past 12 months Now married:
80.9% (50)Unmarried:
19.1% (12)
Women who did not give birth in the past 12 months Now married:
41.0% (298)Unmarried:
59.0% (430)
Marital status - Hispanic or Latino population 15 years and over
Males 49.9% Never married42.3% Now married1.4% Separated1.9% Widowed4.6% DivorcedFemales 37.4% Never married44.3% Now married3.0% Separated7.3% Widowed8.0% DivorcedWomen who gave birth in the past 12 months Now married:
77.5% (176)Unmarried:
22.5% (51)
Women who did not give birth in the past 12 months Now married:
42.2% (2,591)Unmarried:
57.8% (3,553)
Ancestries in Hacienda Heights
653 1.6% American276 0.7% Italian246 0.6% Irish230 0.6% European226 0.6% German216 0.5% English105 0.3% Russian88 0.2% Scottish54 0.1% Polish51 0.1% African39 0.10% Greek37 0.09% Ukrainian34 0.09% Norwegian33 0.08% Dutch32 0.08% Lebanese32 0.08% Armenian31 0.08% Northern European25 0.06% Jordanian25 0.06% Romanian22 0.06% British19 0.05% Swedish19 0.05% Iranian16 0.04% Portuguese16 0.04% Scotch-Irish16 0.04% Egyptian15 0.04% French13 0.03% Turkish11 0.03% Welsh9 0.02% Maltese9 0.02% Canadian8 0.02% Eastern European7 0.02% French Canadian6 0.02% Luxembourger6 0.02% Croatian6 0.02% Slovak6 0.02% Hungarian5 0.01% Yugoslavian4 0.01% Belgian4 0.01% Assyrian
Geographical mobility in Hacienda Heights Same house 1 year ago 15,869 96.6% White (Caucasian)579 98.5% Black or African American526 100.0% American Indian / Alaska Native21,521 93.4% Asian69 100.0% Native Hawaiian / Pacific Islander10,571 95.6% Other race4,102 100.0% Two or more races5,973 96.5% White alone, not Hispanic / Latino24,291 95.8% Hispanic or LatinoMoved within same county 352 2.1% White / Caucasian12 2.1% Black or African American1,310 5.7% Asian467 4.2% Other race79 1.9% Two or more races107 1.7% White alone, not Hispanic / Latino823 3.2% Hispanic or LatinoMoved within same state 271 1.6% White / Caucasian128 0.6% Asian47 0.4% Other race119 1.9% White alone, not Hispanic / Latino304 1.2% Hispanic or LatinoMoved from different state 43 0.3% White / Caucasian2 0.4% Black or African American104 0.5% Asian7 0.1% Other race15 0.4% Two or more races45 0.7% White alone, not Hispanic / Latino16 0.1% Hispanic or LatinoMoved from abroad 31 0.2% White144 0.6% Asian33 0.3% Other race59 1.4% Two or more races7 0.1% White alone, not Hispanic / Latino107 0.4% Hispanic or Latino
Children Nativity (place of birth) in Hacienda Heights
Children under 6 years - Living with two parents Both parents native 911 100.0% Native0 0.0% Foreign-bornBoth parents foreign-born 590 97.0% Native18 3.0% Foreign-bornOne native, one foreign-born parent 572 100.0% NativeChildren under 6 years - Living with one parent Native parent 652 100.0% NativeForeign-born parent 135 100.0% NativeChildren 6 to 17 years - Living with two parents Both parents native 1,720 99.8% Native4 0.2% Foreign-bornBoth parents foreign-born 1,658 86.5% Native260 13.5% Foreign-bornOne native, one foreign-born parent 1,248 98.0% Native25 2.0% Foreign-bornChildren 6 to 17 years - Living with one parent Native parent 991 100.0% NativeForeign-born parent 689 52.6% Native619 47.4% Foreign-born
Place of birth for residents in Hacienda Heights 15,985 Asia12,927 Eastern Asia11,147 China6,253 Americas6,175 Latin America5,642 Central America2,720 South Eastern Asia482 South America318 Europe225 South Central Asia125 Southern Europe111 Western Asia94 Western Europe77 Northern America70 Eastern Europe50 Caribbean42 Africa28 Northern Africa27 Northern Europe10 Oceania7 Eastern Africa7 Western Africa6 Australia and New Zealand Subregion6,058 China4,907 Mexico4,286 Taiwan1,405 Korea1,071 Vietnam965 Philippines802 Hong Kong493 El Salvador373 Japan171 Indonesia169 India131 Cambodia122 Guatemala119 Peru101 Ecuador97 Thailand87 Malaysia87 Colombia77 Canada77 Burma75 Laos69 Brazil66 Argentina58 Costa Rica49 Greece48 Italy44 Germany42 Singapore38 Cuba32 Syria31 Ukraine30 Jordan27 Spain26 Pakistan21 Lebanon20 Panama20 Nicaragua16 Austria16 France16 Bolivia16 Ireland15 Sudan13 Belize13 Egypt12 Chile12 Kazakhstan12 Turkey12 Jamaica11 Russia11 Iran10 Netherlands9 Romania9 Uruguay8 Czechoslovakia8 Kuwait7 Honduras7 Nigeria7 Iraq7 Serbia7 Bangladesh7 Belgium6 Scotland6 Australia5 United Kingdom4 Poland
Grandparents responsible for own grandchildren in Hacienda Heights
Grandparents (30 to 59 years) White / Caucasian 55 28.9% Responsible for grandchildren136 71.1% Not responsible for grandchildrenAsian 58 39.8% Responsible for grandchildren88 60.2% Not responsible for grandchildrenOther race 33 17.4% Responsible for grandchildren157 82.6% Not responsible for grandchildrenTwo or more races 23 100.0% Responsible for grandchildrenWhite alone, not Hispanic / Latino 20 77.3% Responsible for grandchildren6 22.7% Not responsible for grandchildrenHispanic or Latino 86 20.1% Responsible for grandchildren344 79.9% Not responsible for grandchildrenGrandparents (60 years and over) White / Caucasian 79 18.5% Responsible for grandchildren346 81.5% Not responsible for grandchildrenAsian 110 17.7% Responsible for grandchildren512 82.3% Not responsible for grandchildrenOther race 19 5.7% Responsible for grandchildren319 94.3% Not responsible for grandchildrenTwo or more races 36 100.0% Not responsible for grandchildrenWhite alone, not Hispanic / Latino 5 3.6% Responsible for grandchildren120 96.4% Not responsible for grandchildrenHispanic or Latino 124 16.9% Responsible for grandchildren610 83.1% Not responsible for grandchildren