Races in Haverstraw, New York (NY) Detailed Stats
Data:
Races - White alone (%)
Races - White alone (% change since 2000)
Races - Black alone (%)
Races - Black alone (% change since 2000)
Races - American Indian alone (%)
Races - American Indian alone (% change since 2000)
Races - Asian alone (%)
Races - Asian alone (% change since 2000)
Races - Hispanic (%)
Races - Hispanic (% change since 2000)
Races - Native Hawaiian and Other Pacific Islander alone (%)
Races - Native Hawaiian and Other Pacific Islander alone (% change since 2000)
Races - Two or more races(%)
Races - Two or more races(% change since 2000)
Races - Other race alone (%)
Races - Other race alone (% change since 2000)
Racial diversity
Place of birth - Born in state of residence (%)
Place of birth - Born in state of residence (%) - White
Place of birth - Born in state of residence (%) - Black or African American
Place of birth - Born in state of residence (%) - Asian
Place of birth - Born in state of residence (%) - Hispanic or Latino
Place of birth - Born in state of residence (%) - American Indian and Alaska Native
Place of birth - Born in state of residence (%) - Multirace
Place of birth - Born in state of residence (%) - Other Race
Place of birth - Born in other state (%)
Place of birth - Born in other state (%) - White
Place of birth - Born in other state (%) - Black or African American
Place of birth - Born in other state (%) - Asian
Place of birth - Born in other state (%) - Hispanic or Latino
Place of birth - Born in other state (%) - American Indian and Alaska Native
Place of birth - Born in other state (%) - Multirace
Place of birth - Born in other state (%) - Other Race
Place of birth - Native, outside of US (%)
Place of birth - Native, outside of US (%) - White
Place of birth - Native, outside of US (%) - Black or African American
Place of birth - Native, outside of US (%) - Asian
Place of birth - Native, outside of US (%) - Hispanic or Latino
Place of birth - Native, outside of US (%) - American Indian and Alaska Native
Place of birth - Native, outside of US (%) - Multirace
Place of birth - Native, outside of US (%) - Other Race
Place of birth - Foreign born (%)
Place of birth - Foreign born (%) - White
Place of birth - Foreign born (%) - Black or African American
Place of birth - Foreign born (%) - Asian
Place of birth - Foreign born (%) - Hispanic or Latino
Place of birth - Foreign born (%) - American Indian and Alaska Native
Place of birth - Foreign born (%) - Multirace
Place of birth - Foreign born (%) - Other Race
Residents speaking English at home (%)
Residents speaking English at home - Born in the United States (%)
Residents speaking English at home - Native, born elsewhere (%)
Residents speaking English at home - Foreign born (%)
Residents speaking Spanish at home (%)
Residents speaking Spanish at home - Born in the United States (%)
Residents speaking Spanish at home - Native, born elsewhere (%)
Residents speaking Spanish at home - Foreign born (%)
Residents speaking other language at home (%)
Residents speaking other language at home - Born in the United States (%)
Residents speaking other language at home - Native, born elsewhere (%)
Residents speaking other language at home - Foreign born (%)
Marital status - Never married (%)
Marital status - Now married (%)
Marital status - Separated (%)
Marital status - Widowed (%)
Marital status - Divorced (%)
Ancestries Reported - Arab (%)
Ancestries Reported - Czech (%)
Ancestries Reported - Danish (%)
Ancestries Reported - Dutch (%)
Ancestries Reported - English (%)
Ancestries Reported - French (%)
Ancestries Reported - French Canadian (%)
Ancestries Reported - German (%)
Ancestries Reported - Greek (%)
Ancestries Reported - Hungarian (%)
Ancestries Reported - Irish (%)
Ancestries Reported - Italian (%)
Ancestries Reported - Lithuanian (%)
Ancestries Reported - Norwegian (%)
Ancestries Reported - Polish (%)
Ancestries Reported - Portuguese (%)
Ancestries Reported - Russian (%)
Ancestries Reported - Scotch-Irish (%)
Ancestries Reported - Scottish (%)
Ancestries Reported - Slovak (%)
Ancestries Reported - Subsaharan African (%)
Ancestries Reported - Swedish (%)
Ancestries Reported - Swiss (%)
Ancestries Reported - Ukrainian (%)
Ancestries Reported - United States (%)
Ancestries Reported - Welsh (%)
Ancestries Reported - West Indian (%)
Ancestries Reported - Other (%)
Geographical mobility - Same house 1 year ago (%)
Geographical mobility - Same house 1 year ago (%) - White
Geographical mobility - Same house 1 year ago (%) - Black or African American
Geographical mobility - Same house 1 year ago (%) - Asian
Geographical mobility - Same house 1 year ago (%) - Hispanic or Latino
Geographical mobility - Same house 1 year ago (%) - American Indian and Alaska Native
Geographical mobility - Same house 1 year ago (%) - Multirace
Geographical mobility - Same house 1 year ago (%) - Other Race
Geographical mobility - Moved within same county (%)
Geographical mobility - Moved within same county (%) - White
Geographical mobility - Moved within same county (%) - Black or African American
Geographical mobility - Moved within same county (%) - Asian
Geographical mobility - Moved within same county (%) - Hispanic or Latino
Geographical mobility - Moved within same county (%) - American Indian and Alaska Native
Geographical mobility - Moved within same county (%) - Multirace
Geographical mobility - Moved within same county (%) - Other Race
Geographical mobility - Moved from different county within same state (%)
Geographical mobility - Moved from different county within same state (%) - White
Geographical mobility - Moved from different county within same state (%) - Black or African American
Geographical mobility - Moved from different county within same state (%) - Asian
Geographical mobility - Moved from different county within same state (%) - Hispanic or Latino
Geographical mobility - Moved from different county within same state (%) - American Indian and Alaska Native
Geographical mobility - Moved from different county within same state (%) - Multirace
Geographical mobility - Moved from different county within same state (%) - Other Race
Geographical mobility - Moved from different state (%)
Geographical mobility - Moved from different state (%) - White
Geographical mobility - Moved from different state (%) - Black or African American
Geographical mobility - Moved from different state (%) - Asian
Geographical mobility - Moved from different state (%) - Hispanic or Latino
Geographical mobility - Moved from different state (%) - American Indian and Alaska Native
Geographical mobility - Moved from different state (%) - Multirace
Geographical mobility - Moved from different state (%) - Other Race
Geographical mobility - Moved from abroad (%)
Geographical mobility - Moved from abroad (%) - White
Geographical mobility - Moved from abroad (%) - Black or African American
Geographical mobility - Moved from abroad (%) - Asian
Geographical mobility - Moved from abroad (%) - Hispanic or Latino
Geographical mobility - Moved from abroad (%) - American Indian and Alaska Native
Geographical mobility - Moved from abroad (%) - Multirace
Geographical mobility - Moved from abroad (%) - Other Race
Place of birth for the foreign-born population - Ireland (%)
Place of birth for the foreign-born population - Denmark (%)
Place of birth for the foreign-born population - Norway (%)
Place of birth for the foreign-born population - Sweden (%)
Place of birth for the foreign-born population - United Kingdom (%)
Place of birth for the foreign-born population - England (%)
Place of birth for the foreign-born population - Scotland (%)
Place of birth for the foreign-born population - Other Northern Europe (%)
Place of birth for the foreign-born population - Austria (%)
Place of birth for the foreign-born population - Belgium (%)
Place of birth for the foreign-born population - France (%)
Place of birth for the foreign-born population - Germany (%)
Place of birth for the foreign-born population - Netherlands (%)
Place of birth for the foreign-born population - Switzerland (%)
Place of birth for the foreign-born population - Other Western Europe (%)
Place of birth for the foreign-born population - Greece (%)
Place of birth for the foreign-born population - Italy (%)
Place of birth for the foreign-born population - Portugal (%)
Place of birth for the foreign-born population - Spain (%)
Place of birth for the foreign-born population - Other Southern Europe (%)
Place of birth for the foreign-born population - Albania (%)
Place of birth for the foreign-born population - Belarus (%)
Place of birth for the foreign-born population - Bosnia and Herzegovina (%)
Place of birth for the foreign-born population - Bulgaria (%)
Place of birth for the foreign-born population - Croatia (%)
Place of birth for the foreign-born population - Czechoslovakia (%)
Place of birth for the foreign-born population - Hungary (%)
Place of birth for the foreign-born population - Latvia (%)
Place of birth for the foreign-born population - Lithuania (%)
Place of birth for the foreign-born population - North Macedonia (Macedonia) (%)
Place of birth for the foreign-born population - Moldova (%)
Place of birth for the foreign-born population - Poland (%)
Place of birth for the foreign-born population - Romania (%)
Place of birth for the foreign-born population - Russia (%)
Place of birth for the foreign-born population - Serbia (%)
Place of birth for the foreign-born population - Ukraine (%)
Place of birth for the foreign-born population - Other Eastern Europe (%)
Place of birth for the foreign-born population - China (%)
Place of birth for the foreign-born population - Hong Kong (%)
Place of birth for the foreign-born population - Taiwan (%)
Place of birth for the foreign-born population - Japan (%)
Place of birth for the foreign-born population - Korea (%)
Place of birth for the foreign-born population - Other Eastern Asia (%)
Place of birth for the foreign-born population - Afghanistan (%)
Place of birth for the foreign-born population - Bangladesh (%)
Place of birth for the foreign-born population - India (%)
Place of birth for the foreign-born population - Iran (%)
Place of birth for the foreign-born population - Kazakhstan (%)
Place of birth for the foreign-born population - Nepal (%)
Place of birth for the foreign-born population - Pakistan (%)
Place of birth for the foreign-born population - Sri Lanka (%)
Place of birth for the foreign-born population - Uzbekistan (%)
Place of birth for the foreign-born population - Other South Central Asia (%)
Place of birth for the foreign-born population - Burma (%)
Place of birth for the foreign-born population - Cambodia (%)
Place of birth for the foreign-born population - Indonesia (%)
Place of birth for the foreign-born population - Laos (%)
Place of birth for the foreign-born population - Malaysia (%)
Place of birth for the foreign-born population - Philippines (%)
Place of birth for the foreign-born population - Singapore (%)
Place of birth for the foreign-born population - Thailand (%)
Place of birth for the foreign-born population - Vietnam (%)
Place of birth for the foreign-born population - Other South Eastern Asia (%)
Place of birth for the foreign-born population - Armenia (%)
Place of birth for the foreign-born population - Iraq (%)
Place of birth for the foreign-born population - Israel (%)
Place of birth for the foreign-born population - Jordan (%)
Place of birth for the foreign-born population - Kuwait (%)
Place of birth for the foreign-born population - Lebanon (%)
Place of birth for the foreign-born population - Saudi Arabia (%)
Place of birth for the foreign-born population - Syria (%)
Place of birth for the foreign-born population - Turkey (%)
Place of birth for the foreign-born population - Yemen (%)
Place of birth for the foreign-born population - Other Western Asia (%)
Place of birth for the foreign-born population - Eritrea (%)
Place of birth for the foreign-born population - Ethiopia (%)
Place of birth for the foreign-born population - Kenya (%)
Place of birth for the foreign-born population - Somalia (%)
Place of birth for the foreign-born population - Uganda (%)
Place of birth for the foreign-born population - Zimbabwe (%)
Place of birth for the foreign-born population - Other Eastern Africa (%)
Place of birth for the foreign-born population - Cameroon (%)
Place of birth for the foreign-born population - Congo (%)
Place of birth for the foreign-born population - Democratic Republic of Congo (Zaire) (%)
Place of birth for the foreign-born population - Other Middle Africa (%)
Place of birth for the foreign-born population - Egypt (%)
Place of birth for the foreign-born population - Morocco (%)
Place of birth for the foreign-born population - Sudan (%)
Place of birth for the foreign-born population - Other Northern Africa (%)
Place of birth for the foreign-born population - South Africa (%)
Place of birth for the foreign-born population - Other Southern Africa (%)
Place of birth for the foreign-born population - Cabo Verde (%)
Place of birth for the foreign-born population - Ghana (%)
Place of birth for the foreign-born population - Liberia (%)
Place of birth for the foreign-born population - Nigeria (%)
Place of birth for the foreign-born population - Senegal (%)
Place of birth for the foreign-born population - Sierra Leone (%)
Place of birth for the foreign-born population - Other Western Africa (%)
Place of birth for the foreign-born population - Australia (%)
Place of birth for the foreign-born population - New Zealand (%)
Place of birth for the foreign-born population - Fiji (%)
Place of birth for the foreign-born population - Micronesia (%)
Place of birth for the foreign-born population - Bahamas (%)
Place of birth for the foreign-born population - Barbados (%)
Place of birth for the foreign-born population - Cuba (%)
Place of birth for the foreign-born population - Dominica (%)
Place of birth for the foreign-born population - Dominican Republic (%)
Place of birth for the foreign-born population - Grenada (%)
Place of birth for the foreign-born population - Haiti (%)
Place of birth for the foreign-born population - Jamaica (%)
Place of birth for the foreign-born population - St. Vincent and the Grenadines (%)
Place of birth for the foreign-born population - Trinidad and Tobago (%)
Place of birth for the foreign-born population - West Indies (%)
Place of birth for the foreign-born population - Other Caribbean (%)
Place of birth for the foreign-born population - Belize (%)
Place of birth for the foreign-born population - Costa Rica (%)
Place of birth for the foreign-born population - El Salvador (%)
Place of birth for the foreign-born population - Guatemala (%)
Place of birth for the foreign-born population - Honduras (%)
Place of birth for the foreign-born population - Mexico (%)
Place of birth for the foreign-born population - Nicaragua (%)
Place of birth for the foreign-born population - Panama (%)
Place of birth for the foreign-born population - Other Central America (%)
Place of birth for the foreign-born population - Argentina (%)
Place of birth for the foreign-born population - Bolivia (%)
Place of birth for the foreign-born population - Brazil (%)
Place of birth for the foreign-born population - Chile (%)
Place of birth for the foreign-born population - Colombia (%)
Place of birth for the foreign-born population - Ecuador (%)
Place of birth for the foreign-born population - Guyana (%)
Place of birth for the foreign-born population - Peru (%)
Place of birth for the foreign-born population - Uruguay (%)
Place of birth for the foreign-born population - Venezuela (%)
Place of birth for the foreign-born population - Other South America (%)
Place of birth for the foreign-born population - Canada (%)
Place of birth for the foreign-born population - Other Northern America (%)
Place of birth for the foreign-born population - Other (%)
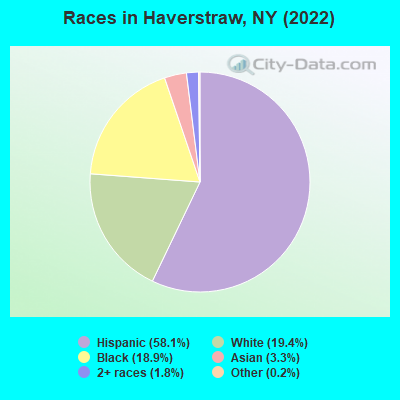
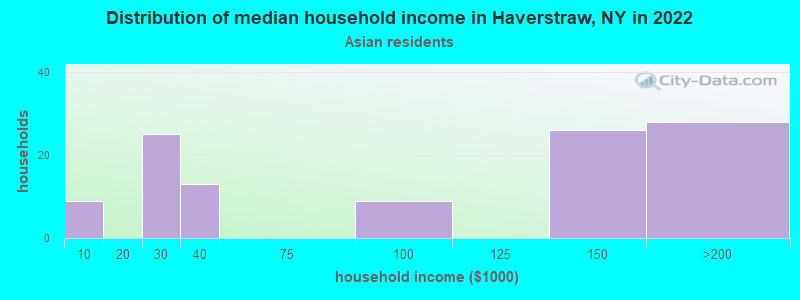
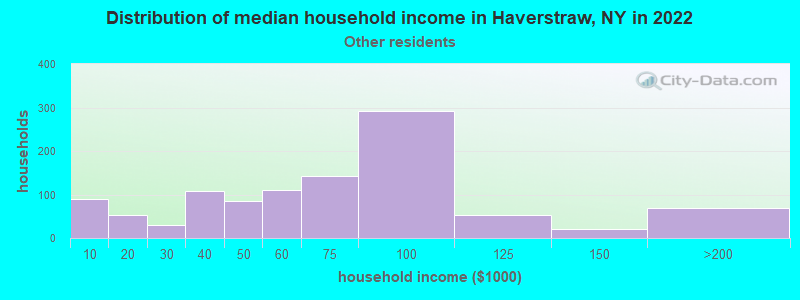
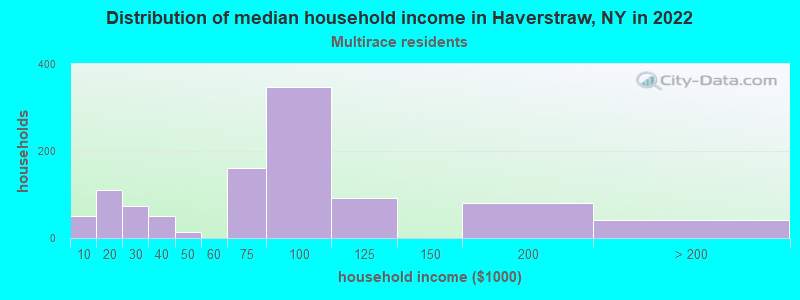
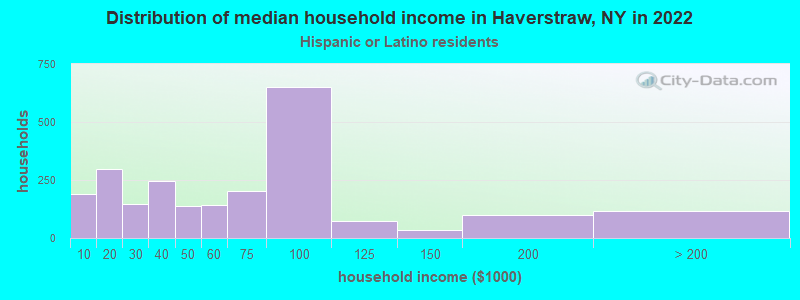
According to 2022 data, the most numerous races in Haverstraw, NY are White alone (2,399 residents), Hispanic (7,177 residents), and Black alone (2,335 residents). 42.2% of Haverstraw residents speak English at home. 32.7% of Haverstraw, NY residents are foreign-born (29.4% born in Latin America), which is 32.8% greater than the foreign-born rate of 22.0% across the entire state of New York.
Race distribution in Haverstraw
2000 2022
11,760,981 62.0% White alone 2,867,583 15.1% Hispanic 2,812,623 14.8% Black alone 1,035,926 5.5% Asian alone 366,116 1.9% Two or more races 75,499 0.4% Other race alone 52,499 0.3% American Indian alone 5,230 0.03% Native Hawaiian and Other
10,408,933 52.9% White alone 3,867,299 19.7% Hispanic 2,633,840 13.4% Black alone 1,776,286 9.0% Asian alone 732,670 3.7% Two or more races 216,110 1.1% Other race alone 35,082 0.2% American Indian alone 6,931 0.04% Native Hawaiian and Other
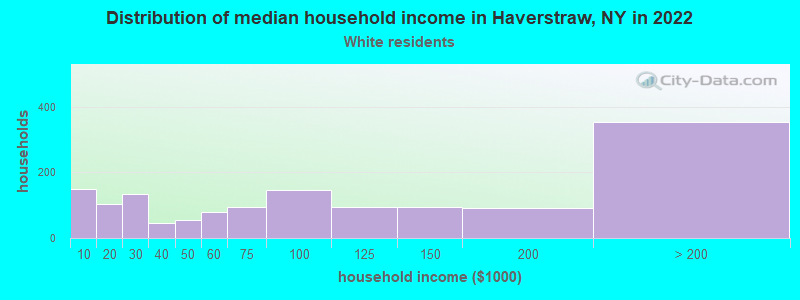
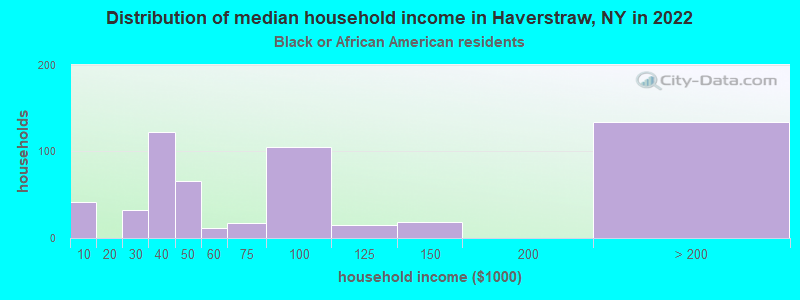
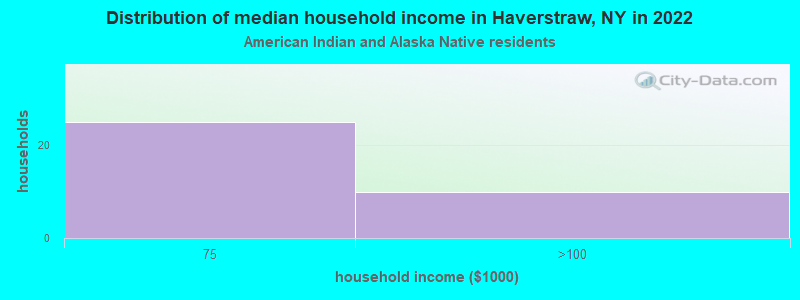
Income and house value in Haverstraw Median household income in 2022 $106,196 White non-Hispanic householders$71,796 Black householders$128,103 American Indian and Alaska Native householders$68,246 Some other race householders$73,511 Two or more races householders$68,269 Hispanic or Latino race householdersMedian 2022 house value $336,043 White Non-Hispanic householders$500,584 Black or African American householders $411,003 Asian householders$308,659 Some other race householders$395,919 Two or more races householders$310,283 Hispanic or Latino householders
Median age by race in Haverstraw
50.0 Median age for White residents44.4 54.0 30.0 Median age for Black or African American residents30.3 32.7 43.1 Median age for American Indian / Alaska Native residents4.8 44.7 44.8 Median age for Asian residents26.2 58.1 -463,937,621.4 Median age for Native Hawaiian / Pacific Islander residents-649,572,648.9 -666,666,666.0 30.3 Median age for Other race residents30.0 31.6 39.7 Median age for Two or more races residents36.8 40.5 55.2 Median age for White alone residents54.0 56.6 33.0 Median age for Hispanic or Latino residents30.9 36.9
Owner/renter occupied households by race in Haverstraw
House owners and renters - White residents 791 54.9% Owner occupied649 45.1% Renter occupiedHouse owners and renters - Black or African American residents 369 75.8% Owner occupied118 24.2% Renter occupiedHouse owners and renters - American Indian / Alaska Native residents 35 100.0% Renter occupiedHouse owners and renters - Asian residents 32 47.3% Owner occupied35 52.7% Renter occupiedHouse owners and renters - Other race residents 391 43.4% Owner occupied509 56.6% Renter occupiedHouse owners and renters - Two or more races residents 495 47.9% Owner occupied539 52.1% Renter occupiedHouse owners and renters - White alone residents 678 63.1% Owner occupied397 36.9% Renter occupiedHouse owners and renters - Hispanic or Latino residents 829 38.4% Owner occupied1,330 61.6% Renter occupied
Language usage in Haverstraw
English speakers - Total 42.2% of residents of Haverstraw speak English at home.
46.6% of residents speak Spanish at home 2,256 42.9% Speak English very well2,997 57.1% Speak English less than very well9.7% of residents speak other language at home 341 31.1% Speak English very well757 68.9% Speak English less than very well
All residents speak only English at home
English speakers - Native, born elsewhere 9.0% of residents of Haverstraw speak English at home.
81.6% of residents speak Spanish at home 191 36.1% Speak English very well338 63.9% Speak English less than very well22.4% of residents speak other language at home 12 8.3% Speak English very well133 91.7% Speak English less than very well
English speakers - Foreign-born 9.8% of residents of Haverstraw speak English at home.
77.9% of residents speak Spanish at home 668 21.7% Speak English very well2,408 78.3% Speak English less than very well13.8% of residents speak other language at home 192 35.3% Speak English very well352 64.7% Speak English less than very well
White (Caucasian) - Speak only English Native:
77.1% (2,078)Foreign-born:
23.8% (119)
White (Caucasian) - Speak another language Native:
23.2% (625)Foreign-born:
73.7% (368)
Black or African American - Speak only English Native:
80.0% (1,250)Foreign-born:
28.3% (161)
Black or African American - Speak another language Native:
19.8% (309)Foreign-born:
71.2% (405)
American Indian / Alaska Native - Speak another language Native:
100.0% (23)Foreign-born:
100.0% (68)
Asian - Speak another language Native:
50.8% (105)Foreign-born:
96.8% (185)
Other race - Speak another language Native:
67.2% (1,022)Foreign-born:
100.0% (1,618)
Two or more races - Speak only English Native:
33.4% (549)Foreign-born:
8.9% (122)
Two or more races - Speak another language Native:
61.7% (1,013)Foreign-born:
89.6% (1,223)
White alone - Speak only English Native:
91.9% (1,964)Foreign-born:
52.9% (72)
White alone - Speak another language Native:
8.0% (171)Foreign-born:
48.4% (66)
Hispanic or Latino - Speak only English Native:
26.2% (845)Foreign-born:
4.3% (137)
Hispanic or Latino - Speak another language Native:
64.2% (2,066)Foreign-born:
95.7% (3,065)
Foreign-born residents in Haverstraw 4,043 residents are foreign born (29.4% Latin America ).
This city:
32.7%New York:
22.6%
Marital status for residents in Haverstraw Marital status - White (Caucasian) population 15 years and over
Males 44.6% Never married39.6% Now married2.0% Separated6.1% Widowed7.7% DivorcedFemales 26.9% Never married43.3% Now married1.8% Separated10.1% Widowed17.9% DivorcedWomen who gave birth in the past 12 months Now married:
0.0% (0)Unmarried:
100.0% (31)
Women who did not give birth in the past 12 months Now married:
46.4% (251)Unmarried:
53.6% (290)
Marital status - Black or African American population 15 years and over
Males 48.8% Never married43.4% Now married3.3% Separated0.5% Widowed4.0% DivorcedFemales 71.8% Never married16.9% Now married0.0% Separated0.0% Widowed11.3% DivorcedWomen who gave birth in the past 12 months Now married:
0.0% (0)Unmarried:
100.0% (166)
Women who did not give birth in the past 12 months Now married:
39.2% (103)Unmarried:
60.8% (161)
Marital status - American Indian / Alaska Native population 15 years and over
Males 0.0% Never married100.0% Now married0.0% Separated0.0% Widowed0.0% DivorcedFemales 0.0% Never married31.4% Now married31.4% Separated31.4% Widowed5.9% DivorcedWomen who gave birth in the past 12 months Now married:
100.0% (13)Unmarried:
0.0% (0)
Women who did not give birth in the past 12 months Now married:
88.5% (33)Unmarried:
11.5% (4)
Marital status - Asian population 15 years and over
Males 62.0% Never married38.0% Now married0.0% Separated0.0% Widowed0.0% DivorcedFemales 62.6% Never married28.1% Now married0.0% Separated9.4% Widowed0.0% DivorcedWomen who did not give birth in the past 12 months Now married:
100.0% (39)Unmarried:
0.0% (0)
Marital status - Other race population 15 years and over
Males 40.3% Never married57.0% Now married2.7% Separated0.0% Widowed0.0% DivorcedFemales 35.4% Never married40.9% Now married1.9% Separated7.5% Widowed14.3% DivorcedWomen who gave birth in the past 12 months Now married:
71.9% (47)Unmarried:
28.1% (18)
Women who did not give birth in the past 12 months Now married:
43.9% (335)Unmarried:
56.1% (428)
Marital status - Two or more races population 15 years and over
Males 44.1% Never married53.4% Now married0.0% Separated0.0% Widowed2.5% DivorcedFemales 54.8% Never married24.9% Now married0.0% Separated12.3% Widowed8.0% DivorcedWomen who did not give birth in the past 12 months Now married:
21.0% (203)Unmarried:
79.0% (764)
Marital status - White alone, not Hispanic / Latino population 15 years and over
Males 44.9% Never married39.9% Now married0.0% Separated8.7% Widowed6.5% DivorcedFemales 29.2% Never married39.4% Now married1.1% Separated12.7% Widowed17.7% DivorcedWomen who did not give birth in the past 12 months Now married:
38.3% (128)Unmarried:
61.7% (206)
Marital status - Hispanic or Latino population 15 years and over
Males 40.6% Never married51.9% Now married3.6% Separated0.0% Widowed3.9% DivorcedFemales 38.8% Never married37.3% Now married2.1% Separated8.7% Widowed13.1% DivorcedWomen who gave birth in the past 12 months Now married:
51.9% (57)Unmarried:
48.1% (53)
Women who did not give birth in the past 12 months Now married:
37.4% (622)Unmarried:
62.6% (1,041)
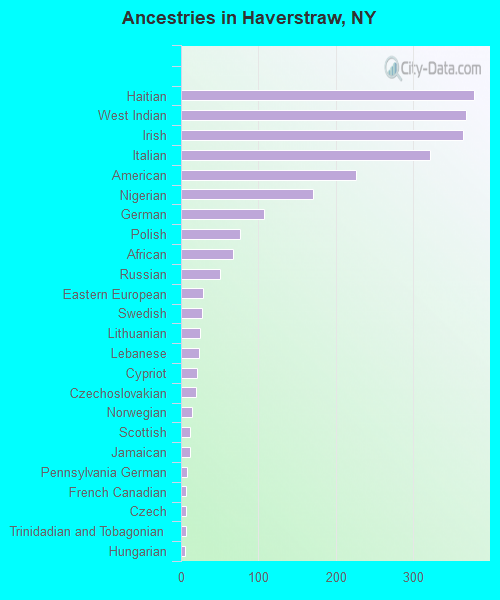
Ancestries in Haverstraw
379 4.6% Haitian368 4.5% West Indian364 4.5% Irish322 3.9% Italian226 2.8% American170 2.1% Nigerian107 1.3% German76 0.9% Polish67 0.8% African50 0.6% Russian28 0.3% Eastern European27 0.3% Swedish25 0.3% Lithuanian23 0.3% Lebanese21 0.3% Cypriot20 0.2% Czechoslovakian14 0.2% Norwegian12 0.1% Scottish11 0.1% Jamaican8 0.10% Pennsylvania German7 0.09% French Canadian6 0.07% Czech6 0.07% Trinidadian and Tobagonian5 0.06% Hungarian3 0.04% British1 0.01% Scotch-Irish
Geographical mobility in Haverstraw Same house 1 year ago 2,774 81.4% White (Caucasian)1,614 67.1% Black or African American112 100.0% American Indian / Alaska Native392 98.4% Asian3,188 86.8% Other race3,052 97.0% Two or more races1,984 82.9% White alone, not Hispanic / Latino6,682 92.2% Hispanic or LatinoMoved within same county 418 12.3% White / Caucasian32 1.3% Black or African American115 3.1% Other race70 2.2% Two or more races184 7.7% White alone, not Hispanic / Latino498 6.9% Hispanic or LatinoMoved within same state 164 4.8% White / Caucasian770 32.1% Black or African American4 0.9% Asian374 10.2% Other race14 0.4% Two or more races148 6.2% White alone, not Hispanic / Latino258 3.6% Hispanic or LatinoMoved from different state 4 0.1% White / Caucasian405 16.8% Black or African American5 0.2% White alone, not Hispanic / LatinoMoved from abroad 34 1.0% White57 1.6% Other race31 1.3% White alone, not Hispanic / Latino57 0.8% Hispanic or Latino
Children Nativity (place of birth) in Haverstraw
Children under 6 years - Living with two parents Both parents native 84 100.0% NativeBoth parents foreign-born 329 100.0% NativeOne native, one foreign-born parent 132 100.0% NativeChildren under 6 years - Living with one parent Native parent 296 100.0% NativeForeign-born parent 255 96.6% Native9 3.4% Foreign-bornChildren 6 to 17 years - Living with two parents Both parents native 184 100.0% NativeBoth parents foreign-born 529 67.7% Native252 32.3% Foreign-bornOne native, one foreign-born parent 83 100.0% NativeChildren 6 to 17 years - Living with one parent Native parent 249 100.0% NativeForeign-born parent 240 56.6% Native183 43.4% Foreign-born
Grandparents responsible for own grandchildren in Haverstraw
Grandparents (30 to 59 years) White / Caucasian 31 100.0% Not responsible for grandchildrenBlack or African American 141 100.0% Not responsible for grandchildrenAmerican Indian / Alaska Native 15 100.0% Not responsible for grandchildrenOther race 103 100.0% Not responsible for grandchildrenTwo or more races 39 100.0% Not responsible for grandchildrenHispanic or Latino 174 100.0% Not responsible for grandchildrenGrandparents (60 years and over) White / Caucasian 45 54.8% Responsible for grandchildren37 45.2% Not responsible for grandchildrenBlack or African American 48 100.0% Not responsible for grandchildrenAmerican Indian / Alaska Native 28 100.0% Not responsible for grandchildrenOther race 40 100.0% Not responsible for grandchildrenHispanic or Latino 100 100.0% Not responsible for grandchildren